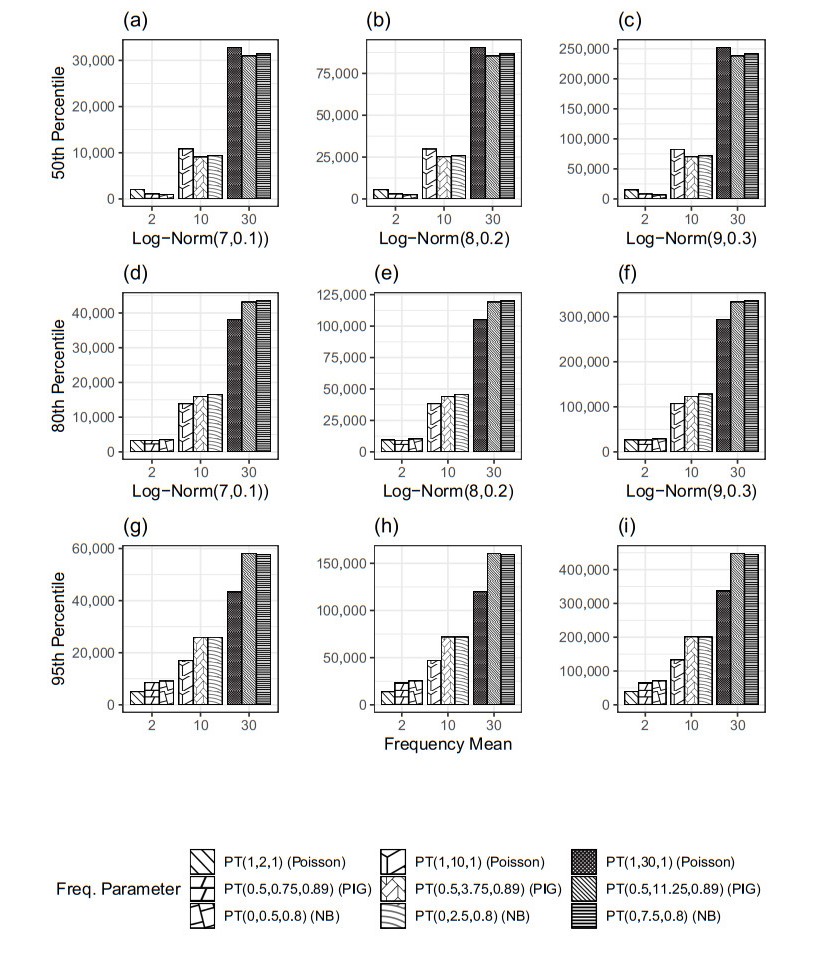
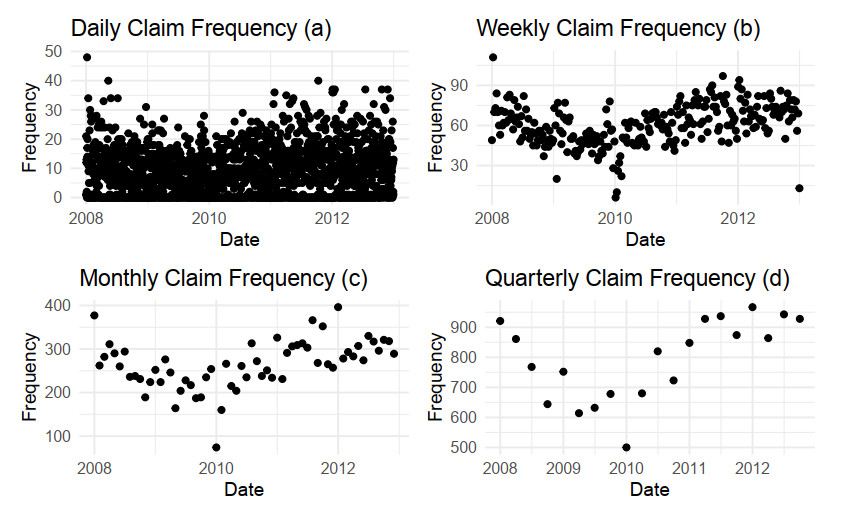
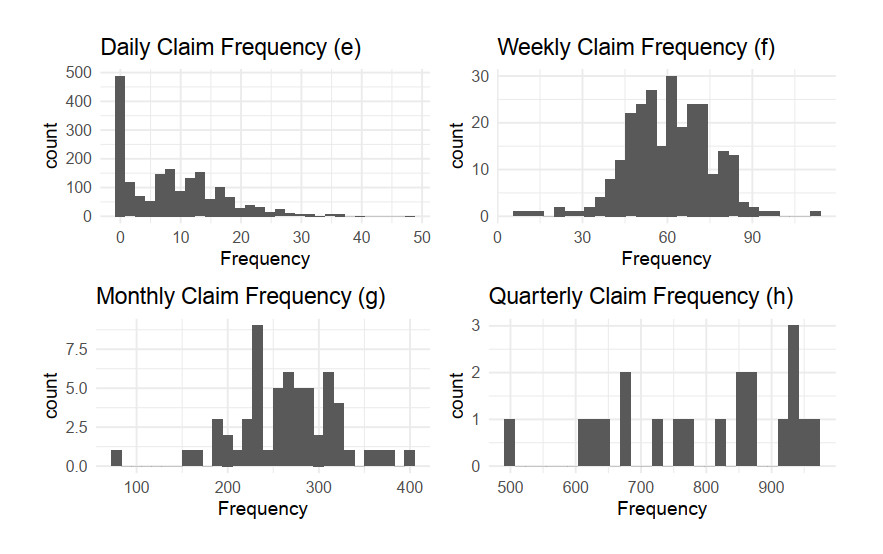
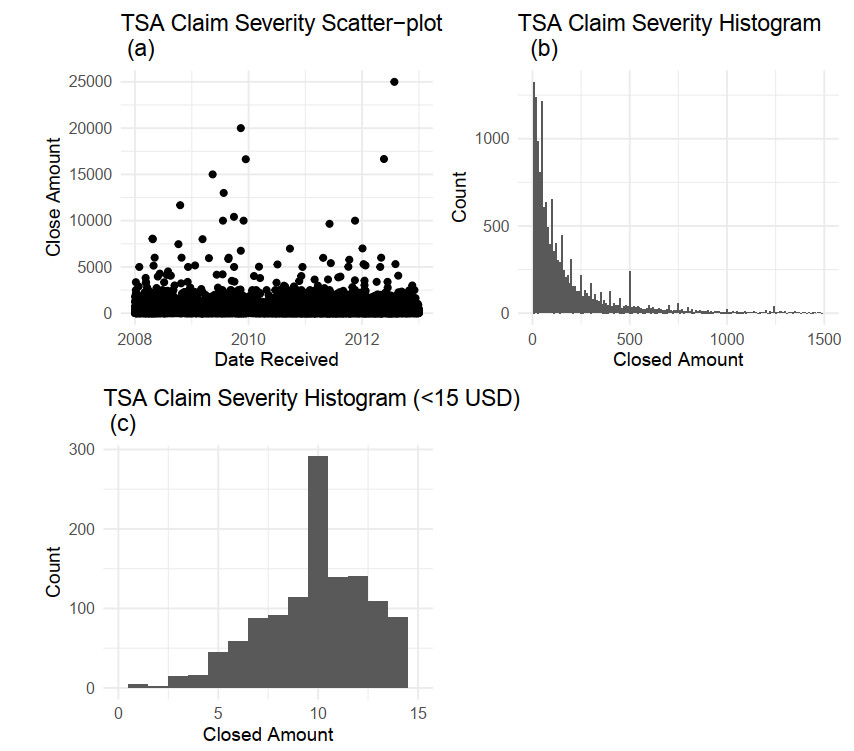
Aggregate loss models are used by insurers to make operational decisions, set insurance premiums, optimize reinsurance and manage risk. The aggregate loss is the summation of all random losses that occurred in a period, and it is a function of both the loss severity and the loss frequency. The need for a flexible model in fitting severity has been well studied in the literature. We extend this work by introducing the Poisson-Tweedie distribution family for the frequency distribution. The Poisson-Tweedie distribution family contains many of the commonly used distributions for modelling loss frequency, thus making loss frequency fitting more flexible and reducing the chance of model misspecification. Using simulation, we show that the sensitivity of percentile based risk measures to different specifications of the frequency distribution. We then apply our proposed model to the Transportation Security Administration (TSA) claims data to demonstrate modelling capacity of the Poisson-Tweedie distribution.
Citation: S. Chen, Z. Wang, M. Kelly. Aggregate loss model with Poisson-Tweedie frequency[J]. Big Data and Information Analytics, 2021, 6: 56-73. doi: 10.3934/bdia.2021005
Aggregate loss models are used by insurers to make operational decisions, set insurance premiums, optimize reinsurance and manage risk. The aggregate loss is the summation of all random losses that occurred in a period, and it is a function of both the loss severity and the loss frequency. The need for a flexible model in fitting severity has been well studied in the literature. We extend this work by introducing the Poisson-Tweedie distribution family for the frequency distribution. The Poisson-Tweedie distribution family contains many of the commonly used distributions for modelling loss frequency, thus making loss frequency fitting more flexible and reducing the chance of model misspecification. Using simulation, we show that the sensitivity of percentile based risk measures to different specifications of the frequency distribution. We then apply our proposed model to the Transportation Security Administration (TSA) claims data to demonstrate modelling capacity of the Poisson-Tweedie distribution.

| [1] |
Lo A, Remorov A, (2017) Stop-loss strategies with serial correlation, regime switching, and transaction costs, J Financ Mark 34: 1-15. doi: 10.1016/j.finmar.2017.02.003

|
| [2] |
Tan K S, Weng C, Zhang Y, (2009) Var and cte criteria for optimal quota-share and stop-loss reinsurance, North Am Actuarial J 13: 459-482. doi: 10.1080/10920277.2009.10597569
|
| [3] | Griffiths R, Mnif W, (2017) Various approximations of the total aggregate loss quantile function with application to operational risk, J Oper Risk 12: 23-46. |
| [4] |
Karam E, Planchet F, (2012) Operational risks in financial sectors, Adv Decis Sci 2012: 1-57. doi: 10.1155/2012/385387
|
| [5] | Panjer H H, (2006) Operational Risk: Modeling Analytics, Wiley Series in Probability and Statistics, Wiley. |
| [6] |
Cummins J D, Dionne G, Mcdonald J B, et al. (1990) Application of gb2 family of distribution in modeling insurance losses processes, Insur Math Econ 9: 257-272. doi: 10.1016/0167-6687(90)90003-V
|
| [7] |
Jin T, Provost S B, J Ren, (2016) Moment-based density approximations for aggregate losses, Scand Actuarial J 2016: 216-245. doi: 10.1080/03461238.2014.921640
|
| [8] | Shevchenko P V, (2011) Modelling Operational Risk Using Bayesian Inference, Springer Berlin Heidelberg. |
| [9] |
Bae T, Ko B, (2020) On the mixtures of length-biased weibull distributions for loss severity modeling, J Korean Stat Soc 49: 422-438. doi: 10.1007/s42952-019-00021-z
|
| [10] |
Willmot G E, Lin X, (2011) Risk modelling with the mixed erlang distribution, Appl Stochastic Models Bus Ind 27: 2-16. doi: 10.1002/asmb.838
|
| [11] |
Esnaola M, Puig P, Gonzalez D, et al. (2013) A flexible count data model to fit the wide diversity of expression profiles arising from extensively replicated rna-seq experiments, BMC Bioinf 14: 254. doi: 10.1186/1471-2105-14-254
|
| [12] |
El-Shaarawi A H, Zhu R, Joe H, (2011) Modelling species abundance using the poisson-tweedie family, Environmetrics 22: 152-164. doi: 10.1002/env.1036
|
| [13] |
Kelly M, Wang Z, (2020) A data set for modeling claims processes—tsa claims data, Risk Manage Insur Rev 23: 269-276. doi: 10.1111/rmir.12155
|
| [14] | Jorion P, (2000) Value at Risk: The New Benchmark for Managing Financial Risk, McGraw-Hill. |
| [15] |
Embrechts P, Frei M, (2009) Panjer recursion versus fft for compound distributions, Math Methods Oper Res 69: 497-508. doi: 10.1007/s00186-008-0249-2
|
| [16] | Wand M P, Jones M C, (1995) Kernel Smoothing, Monographs on Statistics and Applied Probability, Springer US. |
Figures(6) / Tables(7)

S. Chen, Z. Wang, M. Kelly. Aggregate loss model with Poisson-Tweedie frequency[J]. Big Data and Information Analytics, 2021, 6: 56-73. doi: 10.3934/bdia.2021005


 DownLoad: