Citation: Renata Tisi, Marco Rigamonti, Silvia Groppi, Fiorella Belotti. Calcium homeostasis and signaling in fungi and their relevance for pathogenicity of yeasts and filamentous fungi[J]. AIMS Molecular Science, 2016, 3(4): 505-549. doi: 10.3934/molsci.2016.4.505
[1] | Mitchell Ratner, Chih-Chieh (Jason) Chiu . Portfolio Effects of VIX Futures Index. Quantitative Finance and Economics, 2017, 1(3): 288-299. doi: 10.3934/QFE.2017.3.288 |
[2] | Akash Deep . Advanced financial market forecasting: integrating Monte Carlo simulations with ensemble Machine Learning models. Quantitative Finance and Economics, 2024, 8(2): 286-314. doi: 10.3934/QFE.2024011 |
[3] | Lucjan T. Orlowski, Monika Sywak . Wavering interactions between commodity futures prices and us dollar exchange rates. Quantitative Finance and Economics, 2019, 3(2): 221-243. doi: 10.3934/QFE.2019.2.221 |
[4] | Gabriel Frahm . How often is the financial market going to collapse?. Quantitative Finance and Economics, 2018, 2(3): 590-614. doi: 10.3934/QFE.2018.3.590 |
[5] | Etti G. Baranoff, Patrick Brockett, Thomas W. Sager, Bo Shi . Was the U.S. life insurance industry in danger of systemic risk by using derivative hedging prior to the 2008 financial crisis?. Quantitative Finance and Economics, 2019, 3(1): 145-164. doi: 10.3934/QFE.2019.1.145 |
[6] | Cunyi Yang, Li Chen, Bin Mo . The spillover effect of international monetary policy on China's financial market. Quantitative Finance and Economics, 2023, 7(4): 508-537. doi: 10.3934/QFE.2023026 |
[7] | Dimitra Loukia Kolia, Simeon Papadopoulos . The levels of bank capital, risk and efficiency in the Eurozone and the U.S. in the aftermath of the financial crisis. Quantitative Finance and Economics, 2020, 4(1): 66-90. doi: 10.3934/QFE.2020004 |
[8] | Andrea Ferrario, Massimo Guidolin, Manuela Pedio . Comparing in- and out-of-sample approaches to variance decomposition-based estimates of network connectedness an application to the Italian banking system. Quantitative Finance and Economics, 2018, 2(3): 661-701. doi: 10.3934/QFE.2018.3.661 |
[9] | Chen Li, Xiaohu Li . Stochastic arrangement increasing risks in financial engineering and actuarial science – a review. Quantitative Finance and Economics, 2018, 2(1): 675-701. doi: 10.3934/QFE.2018.1.190 |
[10] | Jyh-Horng Lin, Shi Chen, Jeng-Yan Tsai . How does soft information about small business lending affect bank efficiency under capital regulation?. Quantitative Finance and Economics, 2019, 3(1): 53-74. doi: 10.3934/QFE.2019.1.53 |
Following the financial crisis of the prior decade prudential supervisors have turned to stress testing as a primary mechanism with which to gauge the resiliency of financial institutions' with respect to their capital and liquidity resource adequacy to withstand extreme economic scenarios (Acharya, 2009; Demirguc-Kunt et al., 2010). Prior to this, the primary means of risk measurement and management—particularly in the field of credit risk (Merton, 1974)—has been through advanced mathematical, statistical and quantitative techniques and models, which leads to model risk. Model risk (Board of Governors of the Federal Reserve System, 2011; "FRB-BOG") can be defined as the potential that a model does not sufficiently capture the risks it is used to assess, and the danger that it may underestimate potential risks in the future. Stress testing has been used by supervisors to assess the reliability of credit risk models, as can be seen in the revised Basel framework (Basel Committee on Banking Supervision 2006, 2009 a, b, c, d, 2010 a, b; "BCBS") and the Federal Reserve's Comprehensive Capital Analysis and Review ("CCAR") program.
A clear pattern that we have recorded is that most of the high-profile failures of the financial crisis era included firms for which the supervisors considered the internal risk models to be robust and that they were deemed to have sufficient capital resources in order to survive a downturn (Schuermann, 2014). This set of surprise failures revealed that the question of capital adequacy was not answered, since as internal models estimate a positive default probability that is in line with the supervisor's or institution's risk appetite, the inability of such methodologies to estimate the actual potential dangers was an impetus in the search for different capital adequacy assessment methodologies, prime among these being the discipline of stress testing.
There are a number of modeling considerations that institutions must consider in estimating losses on their credit portfolios, and in the context of stress testing for CCAR purposes we can focus on some particularities relevant to the design of scenarios and the choice of risk factors. There are two broad categories of model types in use. Bottom-up models are loan-or obligor-level models used by banks to forecast the expected losses of retail and wholesale loans for each loan. The expected loss is calculated for each loan, and then the sum of expected losses across all loans provides an estimate of portfolio losses, through conditioning on macroeconomic or financial/obligor specific variables. The primary advantages of bottom-up models are the ease of modeling heterogeneity of underlying loans and interaction of loan-level risk factors. The primary disadvantages of loan-level models are that while there are a variety of loan-level methodologies that can be used, these models are much more complex to specify and estimate. These models generally require more sophisticated econometric and simulation techniques, and model validation standards may more stringent. In contrast, top-down models are pool (or segment) level models used by banks to forecast charge-off rates by retail and wholesale loan types as a function of macroeconomic and financial variables. In most cases for these models, banks use only one to four macroeconomic and financial risk drivers as explanatory variables. These variables are usually determined by interaction between model development teams and line of business experts. The primary advantage of top-down models has been the ready availability of data and the simplicity of model estimation. The primary disadvantage of pool-level models is that borrower specific characteristics are generally not used as variables, except at the aggregate level using pool averages. Modeling challenges include determination of an appropriate loss horizon (e.g., for CCAR it is a 9-quarter duration), determination of an appropriate averaging methodology, appropriate data segmentation and loss aggregation, as well as the annualization of loss rates. In this paper we consider top-down models.
This paper shall proceed as follows. Section 2 reviews the available literature on stress testing and scenario generation. Section 3 presents the competing econometric methodologies for generating scenarios, time series Vector Autoregressive ("VAR") and Markov Switching VAR ("MS-VAR") models. Section 4 presents the empirical implementation, the data description, a discussion of the estimation results and their implications. Section 5 concludes the study and provides directions for future avenues of research.
Since the dawn of modern risk management in the 1990s, stress testing has been a tool used to address the basic question of how exposures or positions behave under adverse conditions. Traditionally this form of stress testing has been in the domain of sensitivity analysis (e.g., shocks to spreads, prices, volatilities, etc.) or historical scenario analysis (e.g., historical episodes such as Black Monday 1987 or the post-Lehman bankruptcy period; or hypothetical situations such as modern version of the Great Depression or stagflation). These analyses are particularly suited to market risk, where data are plentiful, but for other risk types in data-scarce environments (e.g., operational, credit, reputational or business risk) there is a greater reliance on hypothetical scenario analysis (e.g., natural disasters, computer fraud, litigation events, etc.).
Stress testing first appears in the supervisory realm under the auspices of the Basel I Accord within the 1995 Amendment on Market Risks (BCBS 1988, 1996). The contemporaneous publication of RiskMetricsTM (J.P. Morgan, 1994) established the practice of market risk management as an analytical discipline in its own right and subsumed several stress testing methodologies thereto developed in this context. Jorion (1996) discusses aspects of stress testing in a book addressing Value-at-Risk ("VaR"). Kupiec (1999), Berkowitz et al. (1999) and the Committee on Global Financial Systems survey (2000; "CGFS") analyze stress testing in a trading and treasury VaR context. Mosser et al. (2001) noted that most stress testing of the period relied upon transparent and easily identifiable historical market factors with respect to asset classes in the trading book.
However, in the case of the banking book (e.g., corporate/C & I or consumer loans), this approach of asset class shocks does not carry over as well, as to the extent these are less marketable there are more idiosyncrasies to account for. Therefore, stress testing with respect to credit risk has evolved later and as a separate discipline in the domain of credit portfolio modeling. However, even in the seminal examples of CreditMetricsTM (J.P. Morgan, 1997) and CreditRisk+TM (Wilde, 1997), stress testing was not a component of such models. The commonality of all such credit portfolio models was subsequently demonstrated (Koyluoglu and Hickman, 1998), as well as the correspondence between the state of the economy and the credit loss distribution, and therefore that this framework is naturally amenable to stress testing. In this spirit, a class of models was built upon the CreditMetricsTM framework through macroeconomic stress testing on credit portfolios using credit migration matrices (Bangia et al., 2002). Nevertheless, prior to the financial crisis supervisory guidance for stress testing were rather unformed in the banking book as compared to other areas such as interest rate, counterparty or country risk (FRB-BOG 1996, 1999, 2002).
In the decade following the financial crisis there is a great expansion of the literature on stress testing. Foglia (2009) survey the existing credit risk stress testing literature of this era. Inanoglu and Jacobs, Jr. (2009) address the aggregation of risk types of capital models in the stress testing and sensitivity analysis of economic capital. Jacobs, Jr. (2010) extends Jacobs and Inanoglu (2009) to the validation of models for stressed capital. Schuermann (2014) analyzes the predominance of stress testing as a supervisory tool in terms of rationales for its utility, outlines for its execution, as well as guidelines and opinions on disseminating the output under various conditions. Jacobs, Jr. (2013) surveys of practices and supervisory expectations for the stress testing of credit risk in the context of a ratings migration methodology in the CreditMetricsTM framework. Rebonato (2010) proposes a Bayesian casual network model, for stress testing having the capability to cohesively incorporate expert knowledge in the model design and methodology of the stress testing process. Another recent study features the application of a Bayesian regression model for credit loss implemented using Fed Y9 data, wherein regulated financial institutions report their gains and losses in conjunction with Federal Reserve scenarios, which can formally incorporate exogenous factors such as such supervisory scenarios, and also quantify the uncertainty in model output that results from stochastic model inputs (Jacobs, Jr. et al., 2015). Jacobs (2015) presents an analysis of the impact of asset price bubbles on standard credit risk measures and provides evidence that asset price bubbles are a phenomenon that must be taken into consideration in the proper determination of economic capital for both credit risk management and measurement purposes. The author also calibrates the model to historical equity prices and in a stress testing exercise project credit losses on both baseline and stressed conditions for bubble and non-bubble parameter estimate settings. Jacobs (2017b) extends Jacobs (2015) by performing a sensitivity analysis of the models with respect to key parameters, empirically calibrates the model to a long history of equity prices, and simulates the model under normal and stressed parameter settings. While the author find statistically significant evidence that the historical S & P index exhibits only mild bubble behavior, this translates in underestimation of potential extreme credit losses according to standard measures by an order of magnitude; however, the degree of relative underestimation of risk due to asset price bubbles is significantly attenuated under stressed parameter setting in the model.
The relative merits of various risk measures and the aggregation of varying risk types, classic examples being Value-at-Risk ("VaR") and related quantities, have been discussed extensively by prior research (Jorion 1997, 2006). An important result in the domain of modeling dependency structures is a general result of mathematical statistics due to Sklar (1956), allowing the combination of arbitrary marginal risk distributions into a joint distribution while preserving a non-normal correlation structure, readily found an application in finance. Among the early academics to introduce this methodology is Embrechts et al.(1999, 2002, 2003). This was applied to credit risk management and credit derivatives by Li (2000). The notion of copulas as a generalization of dependence according to linear correlations is used as a motivation for applying the technique to understanding tail events in Frey and McNeil (2001). This treatment of tail dependence contrasts to Poon et al. (2004), who instead use a data intensive multivariate extension of extreme value theory, which requires observations of joint tail events. Inanoglu and Jacobs (2009) develop a coherent approach to aggregating different risk types for diversified financial institutions. The authors model the main risks faced—market, credit and operational—that have distinct distributional properties, that historically have been modeled in differing framework, contributing to the modeling effort by providing tools and insights to practitioners and regulators.
On the topic of scenario generation wed find rather limited literature to date. Bidder and McKenna (2015) propose the use of robust forecasting analysis to estimate adverse scenarios in stress testing that are generated from a single pessimistic view with respect to a baseline predictive model, the so-called "worst case distribution", a means of assessing weaknesses within a framework that can account for model misspecifications in a general sense. Frame et al. (2015) examine the Office of Federal Housing Enterprise Oversight's ("OFHEO") risk-based capital stress test for Fannie Mae and Freddie Mac. The authors conclude that the key driver in the model, 30-year fixed-rate mortgage performance, left the model specification and parameters settings fixed in the forecast period, and that the house price stress scenario was insufficiently severe, resulting in a significant underprediction of mortgage credit losses and associated capital requirements during the downturn. Finally, we extend Jacobs (2016) on the topic of scenario generation and stress testing employing the MS-VAR model, by in addition to this framework considering the prediction of credit loss in a multiple equation setting.
Stress testing is concerned principally concerned with the policy advisory functions of macroeconomic forecasting, wherein stressed loss projections are leveraged by risk managers and supervisors as a decision-support tool informing the resiliency institutions during stress periods1. Traditionally the way that these objectives have been achieved ranged from high-dimensional multi-equation models, all the way down to single-equation rules, the latter being the product of economic theories. Many of these methodologies were found to be inaccurate and unstable during the economic tumult of the 1970s as empirical regularities such as Okun's Law or the Phillips Curve started to fail. Starting with Sims (1980) and the VAR methodology we saw the arrival of a new paradigm, where as opposed to the univariate AR modeling framework (Box and Jenkins, 1976; Brockwell and Davis, 1991; Commandeur and Koopman, 2007), the VAR model presents as a flexible multi-equation model still in the linear class, but in which variables can be explained by their own and other variable's lags, including variables exogenous to the system. We consider the VAR methodology to be appropriate in the application of stress testing, as our modeling interest concerns relationships and forecasts of multiple macroeconomic and bank-specific variables. We also consider the MS-VAR paradigm in this study, which is closely related to this linear time-invariant VAR model. In this framework we analyze the dynamic propagation of innovations and the effects of regime change in a system. A basis for this approach is the statistics of probabilistic functions of Markov chains (Baum and Petrie, 1966; Baum et al., 1970). The MS-VAR model also subsumes the mixtures of normal distributions (Pearson, 1984) and hidden Markov-chain (Blackwell and Koopmans, 1957; Heller, 1965) frameworks. All of these approaches are further related to Markov-chain regression models (Goldfeld and Quandt, 1973) and to the statistical analysis of the Markov-switching models (Hamilton 1988, 1989). Most closely aligned to our application is the theory of doubly stochastic processes (Tjostheim, 1986) that incorporates the MS-VAR model as a Gaussian autoregressive process conditioned on an exogenous regime generating process.
1 Refer to Stock and Watson (2001) for a discussion of the basic aspects of macroeconomic forecasting (i.e., characterization, forecasting, inferences and policy advice regarding macroeconomic time series and the structure of the economy.)
Let Yt=(Y1t,...,Ykt)T be a k-dimensional vector valued time series, the output variables of interest, in our application with the entries representing some loss measure in a particular segment, that may be influenced by a set of observable input variables denoted by Xt=(X1t,...,Xrt)T, an r-dimensional vector valued time series also referred as exogenous variables, and in our context representing a set of macroeconomic factors. This gives rise to the VARMAX(p,q,s) ("vector autoregressive-moving average with exogenous variables") representation:
YtΦ(B)=XtΘ(B)+EtΘ∗(B) | (1) |
Which is equivalent to:
Yt−p∑j=1ΦjYt−j=s∑j=0ΘjXt−j+Et−q∑j=1Θ∗jEt−j | (2) |
Where Φ(B)=Ir−p∑j=1ΦjBj, Θ(B)=s∑j=0ΘjBj and Θ(B)=Ir−q∑j=1Θ∗jBj are autoregressive lag polynomials of respective orders p, s and q, respectively, and B is the back-shift operator that satisfies BiXt=Xt−i for any process {Xt}. It is common to assume that the input process Xt is generated independently of the noise process Et=(E1t,...,Ekt)T 2. The autoregressive parameter matrices Φj represent sensitivities of output variables to their own lags and to lags of other output variables, while the corresponding matrices Θj are model sensitivities of output variables to contemporaneous and lagged values of input variables3. It follows that the dependency structure of the output variables Yt, as given by the autocovariance function, is dependent upon the parameters Φj, and hence the correlations amongst the Yt as well as the correlation amongst the Xt that depend upon the parameters Θj. In contrast, in a system of univariate ARMAX(p,q,s) ("autoregressive-moving average with exogenous variables") models, the correlations amongst the elements of Yt are not taken into account, hence the parameter vectors Θj have a diagonal structure (Brockwell and Davis, 1991).
2 In fact, the exogenous variables {Xt} can represent both stochastic and non-stochastic (deterministic) variables, examples being sinusoidal seasonal (periodic) functions of time, used to represent the seasonal fluctuations in the output process {Yt}, or intervention analysis modelling in which a simple step (or pulse indicator) function taking the values of 0 or 1 to indicate the effect of output due to unusual intervention events in the system.
3 Note that the VARMAX model (1)–(2) could be written in various equivalent forms, involving a lower triangular coefficient matrix for Yt at lag zero, or a leading coefficient matrix for εt at lag zero, or even a more general form that contains a leading (non-singular) coefficient matrix for Yt at lag zero that reflects instantaneous links amongst the output variables that are motivated by theoretical considerations (provided that the proper identifiability conditions are satisfied (Hanan, 1971; Kohn, 1979)). In the econometrics setting, such a model form is usually referred to as a dynamic simultaneous equations model or a dynamic structural equation model. A related model is obtained by multiplying the dynamic simultaneous equations model form by the inverse of the lag 0 coefficient matrix is referred to as the reduced form model, which has a state space representation (Hanan, 1988).
In this study we consider a vector autoregressive model with exogenous variables ("VARX"), denoted by VARX(p,s), which restricts the Moving Average ("MA") terms beyond lag zero to be zero, or Θ∗j=0k×kj>0:
Yt−p∑j=1ΦjYt−j=s∑j=1ΘjXt−j+Et | (3) |
The rationale for this restriction is three-fold. First, in MA terms were in no cases significant in the model estimations, so that the data simply does not support a VARMX representation. Second, the VARX model avails us of the very convenient DSE package in R, which has computational and analytical advantages (R Development Core Team, 2017). Finally, the VARX framework is more practical and intuitive than the more elaborate VARMAX model, and allows for superior communication of results to practitioners.
We now consider the MS-VARX generalization of the VARX methodology with changes in regime, where the parameters of the VARX system B=(ΦT,ΘT)T∈Rp+s will be time-varying. However, the process might be time-invariant conditional on an unobservable regime variable st∈(1,...,M), denoting the state at time t out of M feasible states. In that case, then the conditional probability density of the observed time series Yt is given by:
p(Yt|Ψt,st)={f(Yt|Ψt−1,B1)ifst=1⋮f(Yt|Ψt−1,BM)ifst=M, | (4) |
Where Bm is the VAR parameter matrix in regime m∈(1,...,M) and Ψt−1 are the observations {yt−j}∞j=1. Therefore, given a regime st, the conditional VARX(p,s|st) system in expectation form can be written as:
E[Yt|Ψt−1,st]=p∑j=1ΦjYt−j(st)+s∑j=1Θj(st)Xt−j | (5) |
We define the innovation term as:
Et=Yt−E[Yt|Ψt,st] | (6) |
The innovation process εt is a Gaussian, zero-mean white noise process having variance-covariance matrix Σ(st):
Et∼NID(0,Σ(st)) | (7) |
If the VARX(p,s|st) process is defined conditionally upon an unobservable regime st as in equation (4), the description of the process generating mechanism should be made complete by specifying the stochastic assumption of the MS-VAR model. In this construct, st follows a discrete state homogenous Markov chain:
Pr(st|{yt−j}∞j=1,{st−j}∞j=1)=Pr({st−j}∞j=1|ρρ) | (8) |
Where ρρ denotes the parameter vector of the regime generating process. We estimate the MS-VAR model using MSBVAR the package in R (R Development Core Team, 2017). Finally note that in the remainder of the document outside this section we will use the acronyms VAR and MS-VAR instead of VARX and MS-VARX to refer to our competing modeling methodologies.
The Federal Reserve's CCAR stress testing exercise requires U.S. domiciled top-tier financial institutions to submit comprehensive capital plans conditioned upon prescribed supervisory, and at least a single bank-specific, set of scenarios (base, adverse and severe). The supervisory scenarios are constituted of 9 quarter paths of critical macroeconomic variables ("MVs"). In the case of institutions materially engaged in trading activities, in addition there is a requirement to project an instantaneous market or counterparty credit loss shock conditioned on the institution's idiosyncratic scenario, in addition to supervisory prescribed market risk stress scenario. Additionally, large custodian banks are asked to estimate a potential default of their largest counterparty.
Institutions are asked to submit post-stress capital projections in their capital plan starting September 30th of the year, spanning the nine-quarter planning horizon that begins in the fourth quarter of the current year, defining movements of key MVs. In this study we consider the MVs of the 2015 CCAR, and their base as well as severely adverse scenarios:
● Real Gross Domestic Product Growth ("RGDP")
● Real Gross Domestic Investment ("RDIG")
● Consumer Price Index ("CPI")
● Real Disposable Personal Income ("RDPI")
● Unemployment Rate ("UNEMP")
● Three-month Treasury Bill Rate ("3MTBR")
● Ten-year Treasury Bond Rate ("10YTBR")
● BBB Corporate Bond Rate ("BBBCR")
● Dow Jones Index ("DJI")
● National House Price Index ("HPI")
● Nominal Disposable Personal Income Growth ("NDPIG")
● Mortgage Rate ("MR")
● CBOE's Equity Market Volatility Index ("VIX")
● Commercial Real Estate Price Index ("CREPI")
Our model selection process imposed the following criteria in selecting input and output variables across both multiple and univariate VAR and MS-VAR models4:
4 We perform this model selection in an R script designed for this purpose, using the libraries "dse" and "tse" to estimate and evaluate VAR and MS-VAR models (R Core Development Team, 2017).
● Transformations of chosen variables should indicate stationarity
● Signs of coefficient estimates are economically intuitive
● Probability values of coefficient estimates indicate statistical significance at conventional confidence levels
● Residual diagnostics indicate white noise behavior
● Model performance metrics (goodness of fit, risk ranking and cumulative error measures) are within industry accepted thresholds of acceptability
● Scenarios rank order intuitively (i.e., severely adverse scenario stress losses exceeding scenario base expected losses)
We considered a diverse set of macroeconomic drivers representing varied dimensions of the economic environment, and a sufficient number of drivers (balancing the consideration of avoiding over-fitting) by industry standards (i.e., at least 2–3 and no more than 5–7 independent variables). According to these criteria, we identify the optimal set focusing on 5 of the 9 most commonly used national Fed CCAR MVs as input variables in the VAR model:
● Real Gross Domestic Investment ("RDIG")
● Unemployment Rate ("UNEMP")
● Commercial Real Estate Price Index ("CREPI")
● BBB Corporate Credit Spread ("BBBCS")
● CBOE's Equity Volatility Index ("VIX")
Similarly, we identify the following loss segments (with loss measured by Gross Charge-off Rates—"GCOs") according to the same criteria, in conjunction with the requirement that they cover the most prevalent portfolio types in typical traditional banking institutions:
● Residential Real Estate ("RESI")
● Commercial Real Estate ("CRE")
● Consumer Credit ("CONS")
● Commercial and Industrial ("C & I")
This historical data, 60 quarterly observations from 1Q01 to 4Q155, are summarized in Table 1 in terms of distributional statistics and correlations, as in Figures 1 to 9 of this section. Across all series when looking at the time series dimension (in the left panels of the figures, in levels in the top and percent changes on the bottom), we observe that the credit cycle is clearly reflected, with indicators of economic or financial stress (health) and charge-off loss rates displaying peaks (troughs) in the recession of 2001–2002 and in the financial crisis of 2007–2008, with the latter episode dominating in terms of severity by an order of magnitude. However, there are some differences in timing, extent and duration of these spikes across macroeconomic variables and loss rates. These patterns are reflected in the percent change transformations of the variables as well, with corresponding spikes in these series that correspond to the cyclical peaks and troughs, although there is also much more idiosyncratic variation observed when looking at the data in this form. Shifting focus to the smoothed histogram graphs (in the right panels of the figures, in levels in the top and percent changes on the bottom), we note that there are significant deviations from normality in terms of excess skewness and excess kurtosis
5 We leave out the last 2 years of available data, 1Q16–4Q17, in order to have a holdout sample for testing the accuracy of the models—refer to the Diebold-Mariano tests at the end of this section. We also choose to start our sample in 2001, as we believe that the earlier period would reflect economic conditions not relevant for the last decade and also because in the financial industry this is a standard starting point for CCAR and DFAST stress testing models.
Output Variables -Loss Observation Segments | Input Variables -Macroeconomic Factors | |||||||||||||||||
Residential Real Estate | Commercial Real Estate | Consumer Credit | Commercial and Industrial | Real Gross Domestic Investment | Unemployment Rate | Commercial Real Estate Price Index | Baa 10 Year Corporate Bond Yield | CBOE Market Volatility Index | ||||||||||
Level | Change | Level | Change | Level | Change | Level | Change | Level | Change | Level | Change | Level | Change | Level | Change | Level | Change | |
Count | 60 | 59 | 60 | 59 | 60 | 59 | 60 | 59 | 60 | 59 | 60 | 59 | 60 | 59 | 60 | 59 | 60 | 59 |
Mean | 0.73 | 6.43% | 0.61 | 10.11 | 3.04 | 0.18% | 0.87 | 0.07% | 2.20 | -1.0% | 6.50 | 0.60% | 198.9 | 1.13% | 3.67 | 0.01% | 26.5 | 3.31% |
Std. Dev. | 0.794 | 40.7% | 0.82 | 70.9% | 1.22 | 11.3% | 0.686 | 20.2% | 3.65 | 6.0% | 1.70 | 6.99% | 37.57 | 4.19% | 0.97 | 9.87% | 12.2 | 31.9% |
Min. | 0.06 | -61.8% | 0.01 | -80.0% | 1.74 | -42.1% | 0.18 | -28.3% | -12.6 | -244% | 4.20 | -7.6% | 135.8 | -14.6% | 1.60 | -24.2% | 12.7 | -49.5% |
25th Prc. | 0.14 | -15% | 0.06 | -20% | 2.30 | -5.2% | 0.30 | -16% | 1.03 | -182% | 5.30 | -2.5% | 170.6 | 0.00% | 2.90 | -6.1% | 19.1 | -17.4% |
Median | 0.28 | -1.31% | 0.15 | -7.18% | 2.73 | -0.62% | 0.62 | -3.95% | 2.70 | 5.00% | 5.85 | -1.2% | 197.5 | 1.27% | 3.80 | 0.94% | 21.5 | -1.44% |
75t th Prc. | 1.38 | 11.5% | 0.95 | 17.6% | 3.17 | 7.4% | 1.34 | 13.6% | 3.40 | 263% | 7.85 | 1.07% | 233.1 | 3.85% | 4.40 | 5.41% | 30.9 | 7.36% |
Max. | 2.78 | 165% | 2.95 | 400.0% | 6.72 | 29.54% | 2.53 | 60.0% | 11.8 | 1640% | 9.90 | 38.1% | 258.9 | 9.81% | 5.40 | 35.00% | 80.9 | 111.5% |
Coef. Var. | 1.08 | 6.33 | 1.36 | 7.02 | 0.40 | 64.23 | 0.78 | 289.97 | 1.65 | 599.21 | 0.26 | 11.68 | 0.19 | 3.73 | 0.27 | 1283.59 | 0.46 | 9.64 |
Skewness | 1.04 | 2.09 | 1.45 | 3.39 | 1.52 | -0.50 | 0.92 | 0.80 | -1.20 | -1.05 | 0.71 | 3.31 | -0.04 | -1.65 | -0.4 | 0.3860 | 2.10 | 1.54 |
Kurtosis | -0.30 | 6.06 | 0.79 | 15.66 | 1.79 | 2.77 | -0.27 | 0.21 | 5.50 | 5.41 | -0.8 | 14.31 | -1.29 | 4.62 | -0.6 | 1.93 | 5.91 | 2.36 |
relative to the Gaussian case, although the extent of these deviations exhibits significant variations across variables (e.g., in the case of the VIX, the non-normality is extreme, and obviously in the case of certain indices or loss rates the bounded domain are clear violations of normality). Furthermore, such deviations from normality are accentuated by an order of magnitude when examining these distributions of the variables in percent change form, which holds generally although with the extent of the deviations varying somewhat across variables. Finally, we note that in general the variation relative to the mean is an order of magnitude greater than looking at percent changes relative to levels.
The correlations amongst all of the independent and dependent variables, in both their level and percentage change forms, are displayed in Tables 2 through 4. First, we will describe main features of the dependency structure within the group of input macroeconomic variables, then the same for the output loss rate variables, and finally the cross-correlations between these two groups. We observe that all correlations have intuitive signs and magnitudes that suggest significant relationships, although the latter are not large enough to suggest any issues with multicollinearity. While the correlations of the percent change transformations are generally lower, they are still intuitive and of reasonable magnitudes. We also note that percent changes of variables are negatively (positively) correlated with levels when indicators are those of economic strength (weakness). The correlation matrix amongst the macroeconomic variables appears in Table 2. For example, considering some of the stronger relationships amongst the levels, the correlations between UNEMP/VIX, CREPI/UNEMP and BBBCY/RDIG are 36.5%, –36.0% and –21.5%, respectively. For example, considering some of the stronger relationships amongst the percent changes, the correlations between BBBCR/CREPI, UNEMP/RDIG and VIX/CREPI are 34.3%, –7.8% and 28.6%, respectively. The correlation matrix amongst the credit loss rate variables appear in Table 3. For example, considering some of the stronger relationships amongst the levels, the correlations between CRE/RESI, CONS/CRE and CNI/CONS are 86.3%, 90.4% and 79.8%, respectively. For example, considering some of the stronger relationships amongst the percent changes, the correlations between CONS/CRE, CNI/CRE, and CNI/CONS are 26.2%, 15.5% and 38.1%, respectively.
Real Gross Domestic Investment | Unemployment Rate | Commercial Real Estate Price Index | Baa 10 Year Corporate Bond Yield | CBOE Market Volatility Index | |||||||
Level | Change | Level | Change | Level | Change | Level | Change | Level | Change | ||
Real Gross Domestic Investment | Level | 1 | |||||||||
Change | -41.11% | 1 | |||||||||
Unemployment Rate | Level | -14.78% | -1.62% | 1 | |||||||
Change | -19.37% | -7.83% | 48.07% | 1 | |||||||
Commercial Real Estate Price Index | Level | 22.87% | 0.81% | -35.99% | -12.30% | 1 | |||||
Change | 2.20% | 8.95% | -24.43% | -43.00% | -42.18% | 1 | |||||
Baa 10 Year Corporate Bond Rate | Level | -21.46% | -1.55% | 30.03% | 67.07% | -21.74% | -6.88% | 1 | |||
Change | -1.81% | -9.31% | 31.66% | 11.13% | -38.29% | -34.33% | 18.27% | 1 | |||
CBOE Equity Market Volatility Index | Level | -17.81% | -7.71% | 36.50% | 49.28% | -64.27% | -25.93% | 20.57% | 15.35% | 1 | |
Change | -14.23% | -3.34% | -7.29% | 6.57% | -14.75% | -28.98% | 15.29% | 34.33% | 44.56% | 1 |
Residential Real Estate | Commercial Real Estate | Consumer Credit | Commercial and Industrial | ||||||
Level | Change | Level | Change | Level | Change | Level | Change | ||
Residential Real Estate | Level | 1 | |||||||
Change | 2.74% | 1 | |||||||
Commercial Real Estate | Level | 86.26% | 3.05% | 1 | |||||
Change | 6.25% | 16.51% | 2.22% | 1 | |||||
Consumer Credit | Level | 81.42% | 1.71% | 90.35% | 7.41% | 1 | |||
Change | 2.00% | 26.15% | 2.68% | 16.44% | 20.08% | 1 | |||
Commercial and Industrial | Level | 54.61% | 3.92% | 64.56% | -3.04% | 79.79% | 18.24% | 1 | |
Change | -2.81% | 15.49% | 0.37% | 19.19% | 0.1822% | 38.07% | 19.81% | 1 |
Residential Real Estate | Commercial Real Estate | Consumer Credit | Commercial and Industrial | ||||||
Level | Change | Level | Change | Level | Change | Level | Change | ||
Real Gross Domestic Investment | Level | -9.39% | -10.62% | -5.73% | -9.87% | -9.63% | -14.63% | -14.03% | -1.44% |
Change | -0.12% | 4.73% | -2.06% | -7.71% | -3.90% | 6.13% | -4.88% | -21.47% | |
Unemployment Rate | Level | 92.76% | 5.79% | 89.80% | -2.27% | 77.51% | 11.11% | 58.80% | 12.57% |
Change | 12.96% | 33.55% | -10.18% | 27.72% | 7.67% | 25.48% | 3.26% | 41.65% | |
Commercial Real Estate Price Index | Level | -26.31% | 45.18% | -33.98% | -15.42% | -54.65% | 44.23% | -79.65% | -48.00% |
Change | -4.00% | -5.50% | -0.11% | -11.47% | 2.57% | -10.03% | -5.19% | -1.24% | |
Baa 10 Year Corporate Bond Rate | Level | 31.90% | 11.26% | 25.65% | 5.62% | -8.32% | -15.36% | 19.16% | 5.36% |
Change | 23.67% | 17.36% | -27.77% | 13.18% | -28.35% | -10.77% | 31.62% | 35.73% | |
CBOE Equity Market Volatility Index | Level | 22.16% | 40.93% | 26.25% | 23.47% | 29.05% | 28.40% | 33.17% | 46.76% |
Change | 9.67% | 19.21% | 1.05% | 27.16% | 3.50% | 8.02% | 6.82% | 10.14% |
The correlation matrix amongst the credit loss rate and macroeconomic variables appear in the Table 4. For example, considering some of the stronger relationships of the levels, the correlations between UNEMP/CRE, CREPI/CNI and UNEMP/RESI are 89.8%, 58.8% and 92.8%, respectively. For example, considering some of the stronger relationships amongst the percent changes, the correlations between UNEMP/CNI, UNEMP/CONS, and VIX/CRE are 41.7%, 25.5% and 27.2%, respectively.
In Table 5 we display the Augmented Dickey-Fuller ("ADF"; Dickey and Fuller, 1981) statistics of the macroeconomic variables under consideration. We observe that we only reject the null hypothesis of a unit root process (or of non-stationarity) in one case for the variables in level form, whereas in percent change for we are able to reject this in all cases at the 5% confidence level or better. We also show results of the Kwiatkowski, Phillips, Schmidt and Shin ("KPSS"; Kwiatkowski et al., 1992) test, in which the null hypothesis is a stationary time series, where we are not able to reject the null hypothesis in all cases for the percent changes, but not for the variables in level form where we do reject the null hypothesis in some cases. Taken in combination with the observations regarding the correlation analysis of Table 1, this leads to the choice of modeling the percent changes in the macroeconomic variables in order to generate base and stress scenarios. As a practice, when modeling in a time series framework, it is preferable to work with data that are jointly stationary.
Stationarity Test | Levels | Percent Changes | |||
Test Statistic | P-Value | Test Statistic | P-Value | ||
Augmented Dickey-Fuller | Real Gross Domestic Investment | -3.8979 | 0.0202 | -3.8979 | 0.0202 |
Unemployment Rate | -2.1582 | 0.5108 | -2.3114 | 0.0224 | |
Commercial Real Estate Price Index | -2.0886 | 0.5390 | -3.0847 | 0.0455 | |
BBB 10 Year Corporate Bond Yield | -2.1872 | 0.4991 | -4.4104 | 0.0100 | |
CBOE Market Volatility Index | -2.3422 | 0.4365 | -5.1761 | 0.0100 | |
Residential Real Estate Loss Rate | -1.4057 | 0.8150 | -1.9883 | 0.0483 | |
Commercial Real Estate Loss Rate | -1.9643 | 0.5892 | -1.8584 | 0.0451 | |
Consumer Credit Loss Rate | -2.3685 | 0.4258 | -3.6123 | 0.0398 | |
Commercial and Industrial Loss Rate | -3.4832 | 0.0512 | -1.6232 | 0.0291 | |
Kwiatkowski–Phillips–Schmidt–Shin | Real Gross Domestic Investment | 0.6870 | 0.0023 | 0.0109 | 0.3166 |
Unemployment Rate | 0.4553 | 0.0091 | 0.1178 | 0.1971 | |
Commercial Real Estate Price Index | 0.3420 | 0.0014 | -0.2742 | 0.2741 | |
BBB 10 Year Corporate Bond Rate | 0.3813 | 0.0079 | -0.1303 | 0.2698 | |
CBOE Equity Market Volatility Index | 0.4507 | 0.0000 | 0.0139 | 0.1389 | |
Residential Real Estate Loss Rate | 0.4652 | 0.0014 | 0.1995 | 0.3581 | |
Commercial Real Estate Loss Rate | 0.2462 | 0.0021 | -0.1965 | 0.3374 | |
Consumer Credit Loss Rate | 0.4384 | 0.0065 | 0.0659 | 0.1207 | |
Commercial and Industrial Loss Rate | 0.4886 | 0.0098 | 0.0437 | 0.4992 |
A critical modeling consideration for the MS-VAR estimation is the choice of process generation distributions for the normal and the stressed regimes. As described in the summary statistics of Table 1, we find that when analyzing the macroeconomic data in percent change form, there is considerable skewness in the direction of adverse changes (i.e., right skewness for variables where increases denote deteriorating economic conditions such as UNEMP, and left skewness in variables where declines are a sign of weakening conditions such as RDIG). Furthermore, in normal regimes where percent changes are small we find a normal distribution to adequately describe the error distribution, whereas when such changes are at extreme levels in the adverse direction we find that a log-normal distribution does a good job of characterizing the data generating process.6
6 This is similar to the findings of Loregian and Meucci (2016) and Jacobs (2017a) in the context of modelling U.S. Treasury yields. We observe that this mixture well characterizes the empirical distributions of the data in this paper.
Another important modeling consideration with respect to scenario generation is the methodology for partitioning the space of scenario paths across our 6 macroeconomic variables for the Base and Severe scenario. In the case of the Severe scenario, we choose to identify such a path in which all six macroeconomic variables exceed their historical 99.0th percentile in at least a single quarter, and then in that set for each variable we take an average across such paths in each quarter. It is our view that this is a reasonable definition of a Severe scenario, and in our risk advisory practice we have observed similar definitions in the industry.7 In the case of the Base scenario, we take an average across all paths in a given quarter for a given variable. The scenarios are shown in Figures 10 to 14 where we show for each macroeconomic variable the base and severe scenarios for the VAR and MS-VAR models8, and also compare this to the corresponding Fed scenarios, along with the historical time series. We make the following general conclusions regarding the different scenario generation methodologies:
7 We have performed a sensitivity analysis, available upon eques, using the 95th and 99.9th percentiles, and the results are not greatly changed.
8 Estimation results for the VAR and MS-VAR model are available upon request. The models are all convergent and goodness of fit metrics in with industry standards. Signs of coefficient estimates are in line with economic intuition and estimates are all significant at conventional levels. We use the dse, tseries and MSBVAR libraries in R in order to perform the estimations (R Development Core Team, 2017).
● In the Severe scenario, the MS-VAR model is far more conservative than the VAR model, and is always at least matching and in some cases even well exceeding historical peaks or troughs in the adverse direction.
● In terms of magnitude, the VAR model is similar to the Fed scenarios, but the trajectories of either the VAR or MS-VAR model tend to be more regular, rising at a more gradual pace into the forecast period.
● In the Base scenarios, the Fed model is rather similar to the VAR model, but in all cases the MS-VAR model produces a higher base, which is driven by the skewness of the mixture error distribution.
The estimation results are summarized in Tables 6 and 7. Table 6 tabulates the results of the VAR (1) estimation of a 4-equation system, while Table 7 tabulates the results of the single equation AR (1) models for each portfolio segment separately. Below we highlight the main conclusions of this study in regard to the difference between the multiple and single equation estimations (detailed descriptions of estimation results and residual diagnostics are given in an Addendum to this paper):
Coefficient Estimates | P-Values | ||||||||
Statistic | Residential Real Estate | Commercial Real Estate | Consumer Credit | Commercial and Industrial | Residential Real Estate | Commercial Real Estate | Consumer Credit | Commercial and Industrial | |
Output Variables -Loss Observation Segments | Residential Real Estate | 0.6808 | 0.3765 | 0.0576 | 0.0055 | 0.00E+00 | 0.00E+00 | 0.00E+00 | 3.84E-02 |
Commercial Real Estate | 0.3510 | 0.5205 | 0.0950 | 0.0869 | 0.00E+00 | 0.00E+00 | 0.00E+00 | 1.17E-07 | |
Consumer Credit | 0.2225 | 0.5346 | 0.3772 | 0.3698 | 2.74E-11 | 0.00E+00 | 0.00E+00 | 0.00E+00 | |
Commercial and Industrial | 0.3370 | 0.2637 | 0.0054 | 0.7879 | 0.00E+00 | 0.00E+00 | 2.41E-02 | 0.00E+00 | |
Input Variables -Macroeconomic Factors | Real Gross Domestic Investment | -0.0156 | -0.0185 | -0.0339 | -0.0047 | 6.75E-04 | 1.32E-05 | 2.49E-02 | 2.14E-01 |
Unemployment Rate | 0.0215 | 0.0157 | 0.0598 | 0.0164 | 7.86E-10 | 5.19E-07 | 7.99E-04 | 7.73E-05 | |
Commercial Real Estate Price Index | -0.0006 | -0.0227 | -0.0063 | -0.0053 | 3.52E-04 | 0.00E+00 | 7.32E-11 | 0.00E+00 | |
BBB 10 Year Corporate Bond Rate | 0.0675 | 0.0226 | 0.2731 | 0.0676 | 0.00E+00 | 6.50E-13 | 0.00E+00 | 0.00E+00 | |
CBOE Equity Market Volatility Index | 0.0012 | 0.0118 | 0.0158 | 0.0118 | 5.24E-02 | 9.83E-13 | 2.07E-10 | 1.21E-11 | |
Model Performance Metrics | Log-Likelihood | -42.90 | |||||||
Root Mean Squared Error / Mean | 0.2609 | 0.3006 | 0.1016 | 0.2408 | |||||
Squared Correlation | 0.9397 | 0.9503 | 0.9352 | 0.9038 | |||||
Cumulative Percentage Error -Entire Sample | 4.126% | 4.794% | 3.913% | 5.714% | |||||
Cumulative Percentage Error -Recent Period | 5.158% | 5.565% | 6.673% | 3.995% | |||||
Cumulative Percentage Error -Downturn Period | -3.686% | -4.370% | -3.118% | -4.072% |
Coefficient Estimates | P-Values | ||||||||
Statistic | Residential Real Estate | Commercial Real Estate | Consumer Credit | Commercial and Industrial | Residential Real Estate | Commercial Real Estate | Consumer Credit | Commercial and Industrial | |
Output Variables -Loss Observation Segments | Residential Real Estate | 0.9641 | 0.0000 | ||||||
Commercial Real Estate | 0.9525 | 0.0000 | |||||||
Consumer Credit | 0.8774 | 0.0000 | |||||||
Commercial and Industrial | 0.8357 | 0.0000 | |||||||
Input Variables -Macroeconomic Factors | Real Gross Domestic Investment | -0.0085 | -0.0081 | -0.0299 | -0.0003 | 4.21E-02 | 4.57E-02 | 1.17E-02 | 4.84E-02 |
Unemployment Rate | 0.0135 | 0.0034 | 0.0318 | 0.0094 | 1.38E-03 | 2.21E-02 | 4.92E-04 | 2.82E-02 | |
Commercial Real Estate Price Index | -0.0003 | -0.0010 | -0.0028 | -0.0035 | 7.78E-08 | 9.72E-08 | 0.00E+00 | 1.11E-16 | |
BBB 10 Year Corporate Bond Rate | 0.0433 | 0.0130 | 0.1385 | 0.0468 | 0.00E+00 | 1.53E-09 | 0.00E+00 | 0.00E+00 | |
CBOE Equity Market Volatility Index | 0.0012 | 0.0035 | 0.0071 | 0.0068 | 4.35E-02 | 4.22E-05 | 3.34E-02 | 5.09E-12 | |
Model Performance Metric | Log-Likelihood | -11.00 | -11.91 | -34.81 | -5.33 | ||||
Log-Likelihood Ratio Statistic -VARMAX Null | 2.72 | 2.56 | 0.42 | 4.17 | 2.18E-11 | 9.55E-12 | 0.00E+00 | 6.69E-09 | |
Root Mean Squared Error / Mean | 0.3293 | 0.3923 | 0.2161 | 0.3100 | |||||
Squared Correlation | 0.8399 | 0.8470 | 0.7858 | 0.8037 | |||||
Cumulative Percentage Error -Entire Sample | 8.17% | 7.60% | -11.55% | -11.30% | |||||
Cumulative Percentage Error -Recent Period | 9.25% | 10.29% | -22.52% | -6.86% | |||||
Cumulative Percentage Error -Downturn Period | -10.33% | -8.46% | -27.76% | -8.34% |
● In both the VAR and AR models, all coefficient estimates are of intuitive sign, and statistically significant at conventional confidence levels, although we note that the significance levels are generally at higher levels for the VAR as comparted to the AR models.
● Residual diagnostics reveal lack of serial autocorrelation and a Gaussian distribution in both VAR and AR models, although we note that the quality of residuals if somewhat better for the VAR as comparted to the AR models.
● Across all 4 segments, according to the likelihood ratio statistic, we reject the hypothesis that the restrictions of the single equation AR models are justified.
● The results of the estimation are broadly consistent across the VAR and AR models, but with a few notable differences, such that the autocorrelation terms are larger in the AR models than in the VAR model.
● The VAR models show greater sensitivity to macroeconomic factors than do the AR models.
● The VAR models are generally more accurate according to standard measures of model fit with respect to each segment.
● The VAR is more conservative than the AR as by measured by cumulative 9-quarter percentage error in the sense of under-predicting (over-predicting) to a lesser degree during the downturn (recent) period.
The results of the scenario analysis with respect to the credit loss segments, for both AR and VAR estimation, as well as for the three scenario generation methodologies (Fed, VAR and MS-VAR), are shown in Tables 8 and 9, as well as in Figures 15 through 18. The results across modeling segments are in line with the scenarios analysis as per macroeconomic variable as discussed in this section, but these results in terms of conservatism of the Severe forecasts are accentuated in the VAR model and dampened in the AR models. In the severe scenario, the MS-VAR model is far more conservative than the VAR model, reflecting the greater sensitivity to macroeconomic factors noted in the estimation results, and always at least matching and in some cases well exceeding historical peaks or troughs in the adverse direction.
Scenario | Statistic | Modeling Segment | Scenario | Modeling Segment | ||||||
Residential Real Estate | Commercial Real Estate | Consumer Credit | Commercial and Industrial | Residential Real Estate | Commercial Real Estate | Consumer Credit | Commercial and Industrial | |||
Fed Base | Mean | 0.2587 | 0.0930 | 1.8571 | 0.3512 | Fed Severely Adverse | 0.2743 | 0.2173 | 2.1794 | 0.5909 |
Standard Deviation | 0.0384 | 0.0455 | 0.0442 | 0.0286 | 0.0406 | 0.1185 | 0.4207 | 0.1650 | ||
Minimum | 0.2046 | 0.0170 | 1.8067 | 0.3046 | 0.2252 | -0.0217 | 1.2789 | 0.2893 | ||
25th Percentile | 0.2272 | 0.0595 | 1.8244 | 0.3297 | 0.2341 | 0.1685 | 1.8839 | 0.4739 | ||
Median | 0.2595 | 0.0967 | 1.8448 | 0.3563 | 0.2723 | 0.2281 | 2.2580 | 0.5967 | ||
75th Percentile | 0.2889 | 0.1291 | 1.8785 | 0.3744 | 0.2945 | 0.3253 | 2.5021 | 0.7324 | ||
Maximum | 0.3174 | 0.1573 | 1.9484 | 0.3888 | 0.3511 | 0.3445 | 2.6334 | 0.7953 | ||
Cumulative Loss | 3.3627 | 1.2089 | 24.1426 | 4.5661 | 3.5657 | 2.8243 | 28.3327 | 7.6811 | ||
Cumulative Loss Relative to Recent Period | 1.2933 | 2.4178 | 1.4286 | 2.2830 | 1.3714 | 5.6486 | 1.6765 | 3.8406 | ||
Cumulative Loss Relative to Downturn Period | 0.1308 | 0.0460 | 0.3755 | 0.2195 | 0.1387 | 0.1074 | 0.4406 | 0.3693 | ||
VAR Model Base | Mean | 0.2923 | 0.1208 | 1.9015 | 0.3877 | VAR Model Severely Adverse | 0.2594 | 0.2218 | 2.9533 | 1.3755 |
Standard Deviation | 0.0574 | 0.0599 | 0.0641 | 0.0457 | 0.1006 | 0.1072 | 0.4598 | 0.4527 | ||
Minimum | 0.2019 | 0.0209 | 1.8115 | 0.3020 | 0.0844 | 0.0382 | 1.6095 | 0.4136 | ||
25th Percentile | 0.2487 | 0.0767 | 1.8499 | 0.3580 | 0.2161 | 0.1709 | 2.9414 | 1.1734 | ||
Median | 0.2952 | 0.1248 | 1.8943 | 0.3979 | 0.2446 | 0.1901 | 3.0590 | 1.4404 | ||
75th Percentile | 0.3379 | 0.1686 | 1.9440 | 0.4257 | 0.2938 | 0.2934 | 3.2333 | 1.6629 | ||
Maximum | 0.3754 | 0.2052 | 2.0077 | 0.4392 | 0.5067 | 0.4302 | 3.4646 | 2.0801 | ||
Cumulative Loss | 3.8005 | 1.5700 | 24.7199 | 5.0399 | 3.3722 | 2.8828 | 38.3931 | 17.8817 | ||
Cumulative Loss Relative to Recent Period | 1.4617 | 3.1400 | 1.4627 | 2.5200 | 1.2970 | 5.7655 | 2.2718 | 8.9408 | ||
Cumulative Loss Relative to Downturn Period | 0.1479 | 0.0597 | 0.3844 | 0.2423 | 0.1312 | 0.1096 | 0.5971 | 0.8597 | ||
Regime Switching Model Base | Mean | 0.3360 | 0.1821 | 2.0186 | 0.4142 | Regime Switching Model Severely Adverse | 0.9249 | 1.2696 | 4.6953 | 1.6844 |
Standard Deviation | 0.0822 | 0.0811 | 0.1973 | 0.0559 | 0.5048 | 0.7820 | 2.4530 | 1.0219 | ||
Minimum | 0.2071 | 0.0382 | 1.8380 | 0.3102 | 0.2363 | -0.0547 | 1.4164 | 0.1437 | ||
25th Percentile | 0.2742 | 0.1246 | 1.8820 | 0.3785 | 0.5456 | 0.6673 | 2.3354 | 0.6546 | ||
Median | 0.3417 | 0.1917 | 1.9375 | 0.4314 | 0.6909 | 1.4276 | 5.0869 | 2.2355 | ||
75th Percentile | 0.4019 | 0.2491 | 2.1084 | 0.4600 | 1.3450 | 1.9156 | 7.2006 | 2.5118 | ||
Maximum | 0.4489 | 0.2861 | 2.4608 | 0.4718 | 1.7271 | 2.2146 | 7.3885 | 2.6254 | ||
Cumulative Loss | 4.3675 | 2.3669 | 26.2423 | 5.3849 | 12.0235 | 16.5051 | 61.0384 | 21.8977 | ||
Cumulative Loss Relative to Recent Period | 1.6798 | 4.7338 | 1.5528 | 2.6924 | 4.6244 | 33.0102 | 3.6117 | 10.9488 | ||
Cumulative Loss Relative to Downturn Period | 0.1699 | 0.0900 | 0.4081 | 0.2589 | 0.4678 | 0.6276 | 0.9493 | 1.0528 |
Scenario | Statistic | Modeling Segment | Scenario | Modeling Segment | ||||||
Residential Real Estate | Commercial Real Estate | Consumer Credit | Commercial and Industrial | Residential Real Estate | Commercial Real Estate | Consumer Credit | Commercial and Industrial | |||
Fed Base | Mean | 0.2062 | 0.0588 | 0.8989 | 0.2422 | Fed Severely Adverse | 0.1884 | 0.1406 | 1.9620 | 0.4649 |
Standard Deviation | 0.0704 | 0.0310 | 0.3462 | 0.0758 | 0.0573 | 0.0515 | 0.1279 | 0.0943 | ||
Minimum | 0.0907 | 0.0092 | 0.5308 | 0.1250 | 0.0633 | 0.0260 | 1.7759 | 0.2962 | ||
25th Percentile | 0.1663 | 0.0351 | 0.6120 | 0.1933 | 0.1709 | 0.1305 | 1.8680 | 0.4179 | ||
Median | 0.2009 | 0.0604 | 0.7984 | 0.2511 | 0.2110 | 0.1562 | 1.9857 | 0.4927 | ||
75th Percentile | 0.2529 | 0.0835 | 1.1134 | 0.3111 | 0.2311 | 0.1743 | 2.0854 | 0.5514 | ||
Maximum | 0.3275 | 0.1036 | 1.5795 | 0.3512 | 0.2417 | 0.1979 | 2.1230 | 0.5674 | ||
Cumulative Loss | 2.6805 | 0.7639 | 11.6863 | 3.1491 | 2.4491 | 1.8279 | 25.5062 | 6.0443 | ||
Cumulative Loss Relative to Recent Period | 0.4622 | 1.5277 | 0.6183 | 1.5746 | 0.3401 | 0.9140 | 1.5092 | 3.0221 | ||
Cumulative Loss Relative to Downturn Period | 0.1136 | 0.0290 | 0.1817 | 0.1514 | 0.0878 | 0.0695 | 0.2997 | 0.2906 | ||
VAR Model Base | Mean | 0.2105 | 0.0076 | 0.7330 | 0.2422 | VAR Model Severely Adverse | 0.2396 | 0.2323 | 2.6082 | 1.1489 |
Standard Deviation | 0.1315 | 0.0037 | 0.5570 | 0.0758 | 0.1727 | 0.0837 | 0.3808 | 0.2650 | ||
Minimum | 0.0095 | 0.0013 | 0.1246 | 0.1250 | 0.0220 | 0.0433 | 1.7796 | 0.5654 | ||
25th Percentile | 0.1083 | 0.0049 | 0.2747 | 0.1933 | 0.1111 | 0.2176 | 2.4853 | 1.0446 | ||
Median | 0.2177 | 0.0079 | 0.6006 | 0.2511 | 0.2158 | 0.2603 | 2.7857 | 1.2318 | ||
75th Percentile | 0.3172 | 0.0106 | 1.0737 | 0.3111 | 0.3643 | 0.2904 | 2.8854 | 1.3786 | ||
Maximum | 0.3983 | 0.0124 | 1.8310 | 0.3512 | 0.5431 | 0.3030 | 2.9230 | 1.4185 | ||
Cumulative Loss | 2.7360 | 0.0983 | 9.5293 | 3.1491 | 3.1149 | 3.0197 | 33.9062 | 14.9357 | ||
Cumulative Loss Relative to Recent Period | 0.4717 | 0.1966 | 0.5042 | 1.5746 | 0.5371 | 6.0393 | 2.0063 | 7.4678 | ||
Cumulative Loss Relative to Downturn Period | 0.1159 | 0.0037 | 0.1482 | 0.1514 | 0.1303 | 0.1148 | 0.3984 | 0.7181 | ||
Regime Switching Model Base | Mean | 0.3126 | 0.1380 | 1.2556 | 0.2422 | Regime Switching Model Severely Adverse | 0.8319 | 1.1002 | 3.7624 | 1.1576 |
Standard Deviation | 0.1912 | 0.0598 | 0.2199 | 0.0758 | 0.3556 | 0.6910 | 1.4307 | 0.6079 | ||
Minimum | 0.0259 | 0.0289 | 1.0623 | 0.1250 | 0.0861 | 0.0322 | 1.8287 | 0.2345 | ||
25th Percentile | 0.1641 | 0.0963 | 1.0996 | 0.1933 | 0.6731 | 0.4644 | 2.2674 | 0.5267 | ||
Median | 0.3258 | 0.1489 | 1.1895 | 0.2511 | 0.7692 | 1.4092 | 4.1468 | 1.5085 | ||
75th Percentile | 0.4684 | 0.1906 | 1.3244 | 0.3111 | 1.0180 | 1.6879 | 5.1048 | 1.6317 | ||
Maximum | 0.5754 | 0.2063 | 1.7838 | 0.3512 | 1.4150 | 1.7707 | 5.3215 | 1.6693 | ||
Cumulative Loss | 4.0640 | 1.7942 | 16.3224 | 3.1491 | 10.8147 | 14.3029 | 48.9108 | 15.0490 | ||
Cumulative Loss Relative to Recent Period | 0.6395 | 3.5885 | 0.8636 | 1.5746 | 1.8646 | 28.6058 | 2.8941 | 7.5245 | ||
Cumulative Loss Relative to Downturn Period | 0.1034 | 0.0682 | 0.2538 | 0.1514 | 0.4583 | 0.5438 | 0.5747 | 0.7235 |
As an example, in the case of the C & I segment in the VAR estimation and as measured by the cumulative loss relative to that in the downturn period in VAR estimation, in the C & I segment this multiple is 1.05 in the MS-VAR model but only 0.85 (0.36) in the VAR (Fed) scenario generation models. However, in the corresponding multiple is 0.75 in the MS-VAR model but only 0.71 (0.29) in the VAR (Fed) scenario generation models.
In Table 10 we implement the Mariano-Diebold (Diebold and Mariano, 2002) accuracy tests of the hypotheses that the multiple equation VAR model outperforms the RS-VAR model. This is an important exercise, as the literature notes that often regime switching time series models are prone to the problem of over-fitting (Dacco and Satchell, 1999; Engel, 1994). We are able to reject the null hypothesis that the MS-VAR model is outperformed by the VAR model, both on a 1-step ahead and on an out-of-sample basis9. In the latter, we recalibrate the model leaving out the last 8 quarters of data, and predict credit losses over this period.
Forecast Horizon | 1-Step Ahead | 8 Quarter Out-of-Sample/Time | ||
Modeling Segment | Test Statistic | P-Value | Test Statistic | P-Value |
Residential Real Estate | 2.5675829 | 0.0106 | 0.7492074 | 0.2838 |
Commercial Real Estate | 2.8342814 | 0.0096 | 0.5472589 | 0.2522 |
Consumer Credit | 3.8153666 | 0.0028 | 0.3536867 | 0.1341 |
Commercial and Industrial | 2.102496 | 0.0071 | 1.9498362 | 0.1565 |
9 The holdout sample covers the last 2 years, the 1st quarter of 2016 through the 4th quarter of 2017.
This paper has considered analyzing the estimation methodologies and the macroeconomic scenarios provided, key ingredient of the stress testing process, such as the Federal Reserve's CCAR program. We have analyzed the estimation methodology implications around the supervisory requirements that banks develop their own macroeconomic scenarios. A standard approach such as the VAR statistical model, that exploits the dependency structure between both macroeconomic drivers and modeling segments, has been examined in the context of the well-known phenomenon of fat-tailed distributions that deviate from a Gaussian error structure. We have investigated the implications the MS-VAR challenger model, commonly seen in academics yet not prevalent in practice. These competing models have been empirically tested with Federal Reserve macroeconomic data released for CCAR purposes and Y9 regulatory filings. Our main finding is that the MS-VAR model produces more conservative Severe loss projections as compared to the VAR model, as well as greater forecast greater accuracy according to the KPSS testing, which we explain in the ability of the regime switching paradigm to better accommodate extreme events observed in history that deviate from normality. The MS-VAR model is capable in the Severe scenario of at least matching and sometimes well exceeding historical extremes in the direction of augmented losses, as compared to the VAR model. The VAR model bears similarities to the Fed model in terms of the magnitude of scenarios, but we observe that the trajectories of either the VAR or MS-VAR models tend to be more regular. The Fed model in the Base scenarios is rather close to that of the VAR model, but the MS-VAR model projects an augmented base in all cases, which attribute to the skewness error distribution in the regime-switching or mixture setting.
As a second main conclusion, we have considered the case of banks that model the risk of their portfolios using top-of-the-house modeling techniques, and have addressed an issue of how to incorporate the correlation of risks amongst the different segments. An approach to incorporate this consideration of a dependency structure was proposed, and the bias that results from ignoring this aspect is quantified, through estimating a VAR time series models for credit loss using Fed Y9 data. We found that the multiple equation VAR model outperforms the single equation AR models according to various metrics across all modeling segments. The results of the estimation are broadly consistent across the VAR and AR models, but with a few notable differences (e.g., most segments exhibit significant but mild autocorrelation, and different subsets of the macroeconomic variables are significant across different segments). Across all 4 segments, according to the likelihood ratio statistic, we reject the hypothesis that the restrictions of the single equation AR models are justified. Furthermore, while the VAR models are generally more accurate according to standard measures of model fit with respect to each segment, it is inconclusive whether the VAR or AR models are more or less conservative as measured by cumulative 9-quarter losses.
There are several directions in which this line of research could be extended, including but not limited to the following:
● More granular classes of credit risk models, such as ratings migration or PD/LGD scorecard/regression
● Alternative data-sets, for example bank or loan level data
● More general classes of regression model, such as logistic, semi-parametric or machine learning / artificial intelligence techniques (Jacobs, 2018)
● Applications related to stress testing, such as regulatory or economic capital
There is no conflict of interest with respect to either author. Regarding Michael Jacobs, Jr. the views and conclusions expressed in this paper do not reflect a position or opinion held by Accenture LLP or any affiliated firms. The research for this article was co-authored by Frank J. Sensenbrenner, in collaboration with Michael Jacobs, Jr., in Mr. Sensenbrenner's personal capacity and not in his official capacity as an employee of the Commodity Futures Trading Commission (CFTC). The analyses and conclusions expressed in this research paper are those of Mr. Sensenbrenner and Mr. Jacobs, Jr., and do not reflect the views of other employees of the CFTC Division of Clearing and Risk, other CFTC staff, the Commission itself, or the United States Government.
[1] |
Wolfe D, Pearce D (2006) Channeling studies in yeast: yeast as a model for channelopathies? Neuromolecular Med 8: 279-306. doi: 10.1385/NMM:8:3:279
![]() |
[2] |
Cui J, Kaandorp J, Ositelu O, et al. (2009) Simulating calcium influx and free calcium concentrations in yeast. Cell Calcium 45: 123-132. doi: 10.1016/j.ceca.2008.07.005
![]() |
[3] |
Ton V, Rao R (2004) Functional expression of heterologous proteins in yeast: insights into Ca2+ signaling and Ca2+-transporting ATPases. Am J Physiol Cell Physiol 287: C580-589. doi: 10.1152/ajpcell.00135.2004
![]() |
[4] | Iida H, Yagawa Y, Anraku Y (1990) Essential role for induced Ca2+ influx followed by [Ca2+]i rise in maintaining viability of yeast cells late in the mating pheromone response pathway. A study of [Ca2+]i in single Saccharomyces cerevisiae cells with imaging of fura-2. J Biol Chem 265: 13391-13399. |
[5] | Halachmi D, Eilam Y (1993) Calcium homeostasis in yeast cells exposed to high concentrations of calcium. Roles of vacuolar H+-ATPase and cellular ATP. FEBS Lett 316: 73-78. |
[6] | Berridge MJ, Lipp P, Bootman MD (2000) The versatility and universality of calcium signalling. Nat Rev Mol Cell Biol 1, 11-21. |
[7] | Dunn T, Gable K, Beeler T (1994) Regulation of cellular Ca2+ by yeast vacuoles. J Biol Chem 269: 7273-7278. |
[8] |
Zelter A, Bencina M, Bowman B, et al. (2004) A comparative genomic analysis of the calcium signaling machinery in Neurospora crassa, Magnaporthe grisea, and Saccharomyces cerevisiae. Fungal Genet Biol 41: 827-841. doi: 10.1016/j.fgb.2004.05.001
![]() |
[9] |
Bencina M, Bagar T, Lah L, et al. (2009) A comparative genomic analysis of calcium and proton signaling/homeostasis in Aspergillus species. Fungal Genet Biol 46: S93-S104. doi: 10.1016/j.fgb.2008.07.019
![]() |
[10] |
Pittman JK (2011) Vacuolar Ca2+ uptake. Cell Calcium 50: 139-146. doi: 10.1016/j.ceca.2011.01.004
![]() |
[11] | Brini M, Cali T, Ottolini D, et al. (2012) Calcium pumps: why so many? Compr Physiol 2: 1045-1060. |
[12] |
Palmgren MG, Axelsen KB (1998) Evolution of P-type ATPases. Biochim Biophys Acta 1365: 37-45. doi: 10.1016/S0005-2728(98)00041-3
![]() |
[13] | Vandecaetsbeek I, Vangheluwe P, Raeymaekers L, et al. (2011) The Ca2+ pumps of the endoplasmic reticulum and Golgi apparatus. Cold Spring Harb Perspect Biol 3: 725-738. |
[14] |
He W, Hu Z (2012) The role of the Golgi-resident SPCA Ca(2)+/Mn(2)+ pump in ionic homeostasis and neural function. Neurochem Res 37: 455-468. doi: 10.1007/s11064-011-0644-6
![]() |
[15] |
Brini M, Cali T, Ottolini D, et al. (2013) The plasma membrane calcium pump in health and disease. FEBS J 280: 5385-5397. doi: 10.1111/febs.12193
![]() |
[16] |
Brini M, Carafoli E (2009) Calcium pumps in health and disease. Physiol Rev 89: 1341-1378. doi: 10.1152/physrev.00032.2008
![]() |
[17] | Cunningham K, Fink G (1994) Ca2+ transport in Saccharomyces cerevisiae. J Exp Biol 196: 157-166. |
[18] |
Bowman BJ, Draskovic M, Freitag M, et al. (2009) Structure and distribution of organelles and cellular location of calcium transporters in Neurospora crassa. Eukaryot Cell 8: 1845-1855. doi: 10.1128/EC.00174-09
![]() |
[19] |
Bowman BJ, Abreu S, Margolles-Clark E, et al. (2011) Role of four calcium transport proteins, encoded by nca-1, nca-2, nca-3, and cax, in maintaining intracellular calcium levels in Neurospora crassa. Eukaryot Cell 10: 654-661. doi: 10.1128/EC.00239-10
![]() |
[20] |
Stathopoulos A, Cyert M (1997) Calcineurin acts through the CRZ1/TCN1-encoded transcription factor to regulate gene expression in yeast. Genes Dev 11: 3432-3444. doi: 10.1101/gad.11.24.3432
![]() |
[21] |
Matheos D, Kingsbury T, Ahsan U, et al. (1997) Tcn1p/Crz1p, a calcineurin-dependent transcription factor that differentially regulates gene expression in Saccharomyces cerevisiae. Genes Dev 11: 3445-3458. doi: 10.1101/gad.11.24.3445
![]() |
[22] |
Cunningham K, Fink G (1994) Calcineurin-dependent growth control in Saccharomyces cerevisiae mutants lacking PMC1, a homolog of plasma membrane Ca2+ ATPases. J Cell Biol 124: 351-363. doi: 10.1083/jcb.124.3.351
![]() |
[23] |
Findon H, Calcagno-Pizarelli AM, Martinez JL, et al. (2010) Analysis of a novel calcium auxotrophy in Aspergillus nidulans. Fungal Genet Biol 47: 647-655. doi: 10.1016/j.fgb.2010.04.002
![]() |
[24] |
Dinamarco TM, Freitas FZ, Almeida RS, et al. (2012) Functional characterization of an Aspergillus fumigatus calcium transporter (PmcA) that is essential for fungal infection. PLoS One 7: e37591. doi: 10.1371/journal.pone.0037591
![]() |
[25] |
Jiang H, Liu F, Zhang S, et al. (2014) Putative PmrA and PmcA are important for normal growth, morphogenesis and cell wall integrity, but not for viability in Aspergillus nidulans. Microbiology 160: 2387-2395. doi: 10.1099/mic.0.080119-0
![]() |
[26] |
Fan W, Idnurm A, Breger J, et al. (2007) Eca1, a sarcoplasmic/endoplasmic reticulum Ca2+-ATPase, is involved in stress tolerance and virulence in Cryptococcus neoformans. Infect Immun 75: 3394-3405. doi: 10.1128/IAI.01977-06
![]() |
[27] |
Adamikova L, Straube A, Schulz I, et al. (2004) Calcium signaling is involved in dynein-dependent microtubule organization. Mol Biol Cell 15: 1969-1980. doi: 10.1091/mbc.E03-09-0675
![]() |
[28] |
Rudolph H, Antebi A, Fink G, et al. (1989) The yeast secretory pathway is perturbed by mutations in PMR1, a member of a Ca2+ ATPase family. Cell 58: 133-145. doi: 10.1016/0092-8674(89)90410-8
![]() |
[29] |
Antebi A, Fink G (1992) The yeast Ca2+-ATPase homologue, PMR1, is required for normal Golgi function and localizes in a novel Golgi-like distribution. Mol Biol Cell 3: 633-654. doi: 10.1091/mbc.3.6.633
![]() |
[30] |
Halachmi D, Eilam Y (1996) Elevated cytosolic free Ca2+ concentrations and massive Ca2+ accumulation within vacuoles, in yeast mutant lacking PMR1, a homolog of Ca2+ -ATPase. FEBS Lett 392: 194-200. doi: 10.1016/0014-5793(96)00799-5
![]() |
[31] |
Strayle, J, Pozzan T, Rudolph H (1999) Steady-state free Ca2+ in the yeast endoplasmic reticulum reaches only 10 microM and is mainly controlled by the secretory pathway pump pmr1. EMBO J 18: 4733-4743. doi: 10.1093/emboj/18.17.4733
![]() |
[32] |
D��rr G, Strayle J, Plemper R, et al. (1998) The medial-Golgi ion pump Pmr1 supplies the yeast secretory pathway with Ca2+ and Mn2+ required for glycosylation, sorting, and endoplasmic reticulum-associated protein degradation. Mol Biol Cell 9: 1149-1162. doi: 10.1091/mbc.9.5.1149
![]() |
[33] |
Hu Z, Bonifas JM, Beech J, et al. (2000) Mutations in ATP2C1, encoding a calcium pump, cause Hailey-Hailey disease. Nat Genet 24: 61-65. doi: 10.1038/71701
![]() |
[34] |
Behne MJ, Tu CL, Aronchik I, et al. (2003) Human keratinocyte ATP2C1 localizes to the Golgi and controls Golgi Ca2+ stores. J Invest Dermatol 121: 688-694. doi: 10.1046/j.1523-1747.2003.12528.x
![]() |
[35] |
Cronin S, Rao R, Hampton R (2002) Cod1p/Spf1p is a P-type ATPase involved in ER function and Ca2+ homeostasis. J Cell Biol 157: 1017-1028. doi: 10.1083/jcb.200203052
![]() |
[36] |
Cronin S, Khoury A, Ferry D, et al. (2000) Regulation of HMG-CoA reductase degradation requires the P-type ATPase Cod1p/Spf1p. J Cell Biol 148: 915-924. doi: 10.1083/jcb.148.5.915
![]() |
[37] |
Vashist S, Frank CG, Jakob CA, et al. (2002) Two distinctly localized p-type ATPases collaborate to maintain organelle homeostasis required for glycoprotein processing and quality control. Mol Biol Cell 13: 3955-3966. doi: 10.1091/mbc.02-06-0090
![]() |
[38] |
Yu Q, Wang H, Xu N, et al. (2012) Spf1 strongly influences calcium homeostasis, hyphal development, biofilm formation and virulence in Candida albicans. Microbiology 158: 2272-2282. doi: 10.1099/mic.0.057232-0
![]() |
[39] |
Yu Q, Ding X, Zhang B, et al. (2013) The P-type ATPase Spf1 is required for endoplasmic reticulum functions and cell wall integrity in Candida albicans. Int J Med Microbiol 303: 257-266. doi: 10.1016/j.ijmm.2013.05.003
![]() |
[40] |
Krumpe K, Frumkin I, Herzig Y, et al. (2012) Ergosterol content specifies targeting of tail-anchored proteins to mitochondrial outer membranes. Mol Biol Cell 23: 3927-3935. doi: 10.1091/mbc.E11-12-0994
![]() |
[41] |
Cohen Y, Megyeri M, Chen OC, et al. (2013) The yeast p5 type ATPase, spf1, regulates manganese transport into the endoplasmic reticulum. PLoS One 8: e85519. doi: 10.1371/journal.pone.0085519
![]() |
[42] |
Miseta A, Kellermayer R, Aiello D, et al. (1999) The vacuolar Ca2+/H+ exchanger Vcx1p/Hum1p tightly controls cytosolic Ca2+ levels in S. cerevisiae. FEBS Lett 451: 132-136. doi: 10.1016/S0014-5793(99)00519-0
![]() |
[43] |
Cai X, Lytton J (2004) The cation/Ca2+ exchanger superfamily: phylogenetic analysis and structural implications. Mol Biol Evol 21: 1692-1703. doi: 10.1093/molbev/msh177
![]() |
[44] |
Shigaki T, Rees I, Nakhleh L, et al. (2006) Identification of three distinct phylogenetic groups of CAX cation/proton antiporters. J Mol Evol 63: 815-825. doi: 10.1007/s00239-006-0048-4
![]() |
[45] |
Pozos T, Sekler I, Cyert M (1996) The product of HUM1, a novel yeast gene, is required for vacuolar Ca2+/H+ exchange and is related to mammalian Na+/Ca2+ exchangers. Mol Cell Biol 16: 3730-3741. doi: 10.1128/MCB.16.7.3730
![]() |
[46] | Forster C, Kane P (2000) Cytosolic Ca2+ homeostasis is a constitutive function of the V-ATPase in Saccharomyces cerevisiae. J Biol Chem 275: 38245-38253. |
[47] |
Waight AB, Pedersen BP, Schlessinger A, et al. (2013) Structural basis for alternating access of a eukaryotic calcium/proton exchanger. Nature 499: 107-110. doi: 10.1038/nature12233
![]() |
[48] | Kingsbury TJ, Cunningham KW (2000) A conserved family of calcineurin regulators. Genes Dev 14: 1595-1604. |
[49] |
Spielvogel A, Findon H, Arst HN, et al. (2008) Two zinc finger transcription factors, CrzA and SltA, are involved in cation homoeostasis and detoxification in Aspergillus nidulans. Biochem J 414: 419-429. doi: 10.1042/BJ20080344
![]() |
[50] |
Kmetzsch L, Staats CC, Simon E, et al. (2010) The vacuolar Ca2+ exchanger Vcx1 is involved in calcineurin-dependent Ca2+ tolerance and virulence in Cryptococcus neoformans. Eukaryot Cell 9: 1798-1805. doi: 10.1128/EC.00114-10
![]() |
[51] |
Cagnac O, Aranda-Sicilia MN, Leterrier M, et al. (2010) Vacuolar cation/H+ antiporters of Saccharomyces cerevisiae. J Biol Chem 285: 33914-33922. doi: 10.1074/jbc.M110.116590
![]() |
[52] |
Demaegd D, Foulquier F, Colinet AS, et al. (2013) Newly characterized Golgi-localized family of proteins is involved in calcium and pH homeostasis in yeast and human cells. Proc Natl Acad Sci U S A 110: 6859-6864. doi: 10.1073/pnas.1219871110
![]() |
[53] |
Foulquier F, Amyere M, Jaeken J, et al. (2012) TMEM165 deficiency causes a congenital disorder of glycosylation. Am J Hum Genet 91: 15-26. doi: 10.1016/j.ajhg.2012.05.002
![]() |
[54] |
Cagnac O, Leterrier M, Yeager M, et al. (2007) Identification and characterization of Vnx1p, a novel type of vacuolar monovalent cation/H+ antiporter of Saccharomyces cerevisiae. J Biol Chem 282: 24284-24293. doi: 10.1074/jbc.M703116200
![]() |
[55] |
Manohar M, Mei H, Franklin AJ, et al. (2010) Zebrafish (Danio rerio) endomembrane antiporter similar to a yeast cation/H+ transporter is required for neural crest development. Biochemistry 49: 6557-6566. doi: 10.1021/bi100362k
![]() |
[56] |
Hong S, Cong X, Jing H, et al. (2013) Characterization of Ca2+/H+ exchange in the plasma membrane of Saccharomyces cerevisiae. Arch Biochem Biophys 537: 125-132. doi: 10.1016/j.abb.2013.07.005
![]() |
[57] |
Fischer M, Schnell N, Chattaway J, et al. (1997) The Saccharomyces cerevisiae CCH1 gene is involved in calcium influx and mating. FEBS Lett 419: 259-262. doi: 10.1016/S0014-5793(97)01466-X
![]() |
[58] |
Iida H, Nakamura H, Ono T, et al. (1994) MID1, a novel Saccharomyces cerevisiae gene encoding a plasma membrane protein, is required for Ca2+ influx and mating. Mol Cell Biol 14: 8259-8271. doi: 10.1128/MCB.14.12.8259
![]() |
[59] |
Martin DC, Kim H, Mackin NA, et al. (2011) New regulators of a high affinity Ca2+ influx system revealed through a genome-wide screen in yeast. J Biol Chem 286: 10744-10754. doi: 10.1074/jbc.M110.177451
![]() |
[60] |
Ding X, Yu Q, Xu N, et al. (2013) Ecm7, a regulator of HACS, functions in calcium homeostasis maintenance, oxidative stress response and hyphal development in Candida albicans. Fungal Genet Biol 57: 23-32. doi: 10.1016/j.fgb.2013.05.010
![]() |
[61] |
Tasaka Y, Nakagawa Y, Sato C, et al. (2000) yam8+, a Schizosaccharomyces pombe gene, is a potential homologue of the Saccharomyces cerevisiae MID1 gene encoding a stretch-activated Ca2+-permeable channel. Biochem Biophys Res Commun 269: 265-269. doi: 10.1006/bbrc.2000.2278
![]() |
[62] |
Lew RR, Abbas Z, Anderca MI, et al. (2008) Phenotype of a mechanosensitive channel mutant, mid-1, in a filamentous fungus, Neurospora crassa. Eukaryot Cell 7: 647-655. doi: 10.1128/EC.00411-07
![]() |
[63] |
Wang S, Cao J, Liu X, et al. (2012) Putative calcium channels CchA and MidA play the important roles in conidiation, hyphal polarity and cell wall components in Aspergillus nidulans. PLoS One 7: e46564. doi: 10.1371/journal.pone.0046564
![]() |
[64] |
Brand A, Lee K, Veses V, et al. (2009) Calcium homeostasis is required for contact-dependent helical and sinusoidal tip growth in Candida albicans hyphae. Mol Microbiol 71: 1155-1164. doi: 10.1111/j.1365-2958.2008.06592.x
![]() |
[65] |
Liu M, Du P, Heinrich G, et al. (2006) Cch1 mediates calcium entry in Cryptococcus neoformans and is essential in low-calcium environments. Eukaryot Cell 5: 1788-1796. doi: 10.1128/EC.00158-06
![]() |
[66] |
Cavinder B, Hamam A, Lew RR, et al. (2011) Mid1, a mechanosensitive calcium ion channel, affects growth, development, and ascospore discharge in the filamentous fungus Gibberella zeae. Eukaryot Cell 10: 832-841. doi: 10.1128/EC.00235-10
![]() |
[67] |
Hallen HE, Trail F (2008) The L-type calcium ion channel cch1 affects ascospore discharge and mycelial growth in the filamentous fungus Gibberella zeae (anamorph Fusarium graminearum). Eukaryot Cell 7: 415-424. doi: 10.1128/EC.00248-07
![]() |
[68] |
Bormann J, Tudzynski P (2009) Deletion of Mid1, a putative stretch-activated calcium channel in Claviceps purpurea, affects vegetative growth, cell wall synthesis and virulence. Microbiology 155: 3922-3933. doi: 10.1099/mic.0.030825-0
![]() |
[69] |
Zhou XL, Stumpf MA, Hoch HC, et al. (1991) A mechanosensitive channel in whole cells and in membrane patches of the fungus Uromyces. Science 253: 1415-1417. doi: 10.1126/science.1716786
![]() |
[70] |
Nakajima-Shimada J, Sakaguchi S, Tsuji F, et al. (2000) Ca2+ signal is generated only once in the mating pheromone response pathway in Saccharomyces cerevisiae. Cell Struct Funct 25: 125-131. doi: 10.1247/csf.25.125
![]() |
[71] |
Batiza A, Schulz T, Masson P (1996) Yeast respond to hypotonic shock with a calcium pulse. J Biol Chem 271: 23357-23362. doi: 10.1074/jbc.271.38.23357
![]() |
[72] |
Matsumoto T, Ellsmore A, Cessna S, et al. (2002) An osmotically induced cytosolic Ca2+ transient activates calcineurin signaling to mediate ion homeostasis and salt tolerance of Saccharomyces cerevisiae. J Biol Chem 277: 33075-33080. doi: 10.1074/jbc.M205037200
![]() |
[73] |
Peiter E, Fischer M, Sidaway K, et al. (2005) The Saccharomyces cerevisiae Ca2+ channel Cch1pMid1p is essential for tolerance to cold stress and iron toxicity. FEBS Lett 579: 5697-5703. doi: 10.1016/j.febslet.2005.09.058
![]() |
[74] |
Locke E, Bonilla M, Liang L, et al. (2000) A homolog of voltage-gated Ca2+ channels stimulated by depletion of secretory Ca2+ in yeast. Mol Cell Biol 20: 6686-6694. doi: 10.1128/MCB.20.18.6686-6694.2000
![]() |
[75] |
Rigamonti M, Groppi S, Belotti F, et al. (2015) Hypotonic stress-induced calcium signaling in Saccharomyces cerevisiae involves TRP-like transporters on the endoplasmic reticulum membrane. Cell Calcium 57: 57-68. doi: 10.1016/j.ceca.2014.12.003
![]() |
[76] | Courchesne WE, Vlasek C, Klukovich R, et al. (2011) Ethanol induces calcium influx via the Cch1-Mid1 transporter in Saccharomyces cerevisiae. Arch Microbiol 193: 323-334. |
[77] |
Groppi S, Belotti F, Brand?o RL, et al. (2011) Glucose-induced calcium influx in budding yeast involves a novel calcium transport system and can activate calcineurin. Cell Calcium 49: 376-386. doi: 10.1016/j.ceca.2011.03.006
![]() |
[78] |
T?k��s-F��zesi M, Bedwell D, Repa I, et al. (2002) Hexose phosphorylation and the putative calcium channel component Mid1p are required for the hexose-induced transient elevation of cytosolic calcium response in Saccharomyces cerevisiae. Mol Microbiol 44: 1299-1308. doi: 10.1046/j.1365-2958.2002.02956.x
![]() |
[79] |
Tisi R, Baldassa S, Belotti F, et al. (2002) Phospholipase C is required for glucose-induced calcium influx in budding yeast. FEBS Lett 520: 133-138. doi: 10.1016/S0014-5793(02)02806-5
![]() |
[80] |
Viladevall L, Serrano R, Ruiz A, et al. (2004) Characterization of the calcium-mediated response to alkaline stress in Saccharomyces cerevisiae. J Biol Chem 279: 43614-43624. doi: 10.1074/jbc.M403606200
![]() |
[81] | Courchesne W, Ozturk S (2003) Amiodarone induces a caffeine-inhibited, MID1-depedent rise in free cytoplasmic calcium in Saccharomyces cerevisiae. Mol Microbiol 47: 223-234. |
[82] | Muller E, Locke E, Cunningham K (2001) Differential regulation of two Ca2+ influx systems by pheromone signaling in Saccharomyces cerevisiae. Genetics 159: 1527-1538. |
[83] |
Bonilla M, Cunningham K (2003) Mitogen-activated protein kinase stimulation of Ca2+ signaling is required for survival of endoplasmic reticulum stress in yeast. Mol Biol Cell 14: 4296-4305. doi: 10.1091/mbc.E03-02-0113
![]() |
[84] |
Jiang H, Shen Y, Liu W, et al. (2014) Deletion of the putative stretch-activated ion channel Mid1 is hypervirulent in Aspergillus fumigatus. Fungal Genet Biol 62: 62-70. doi: 10.1016/j.fgb.2013.11.003
![]() |
[85] |
Paidhungat M, Garrett S (1997) A homolog of mammalian, voltage-gated calcium channels mediates yeast pheromone-stimulated Ca2+ uptake and exacerbates the cdc1(Ts) growth defect. Mol Cell Biol 17: 6339-6347. doi: 10.1128/MCB.17.11.6339
![]() |
[86] |
Hong MP, Vu K, Bautos JM, et al. (2013) Activity of the calcium channel pore Cch1 is dependent on a modulatory region of the subunit Mid1 in Cryptococcus neoformans. Eukaryot Cell 12: 142-150. doi: 10.1128/EC.00130-12
![]() |
[87] |
Wang H, Liang Y, Zhang B, et al. (2011) Alkaline stress triggers an immediate calcium fluctuation in Candida albicans mediated by Rim101p and Crz1p transcription factors. FEMS Yeast Res 11: 430-439. doi: 10.1111/j.1567-1364.2011.00730.x
![]() |
[88] | Eilam Y, Chernichovsky D (1987) Uptake of Ca2+ driven by the membrane potential in energy-depleted yeast cells. J Gen Microbiol 133: 1641-1649. |
[89] |
Eilam Y, Othman M (1990) Activation of Ca2+ influx by metabolic substrates in Saccharomyces cerevisiae: role of membrane potential and cellular ATP levels. J Gen Microbiol 136: 861-866. doi: 10.1099/00221287-136-5-861
![]() |
[90] |
Pereira M, Tisi R, Fietto L, et al. (2008) Carbonyl cyanide m-chlorophenylhydrazone induced calcium signaling and activation of plasma membrane H+-ATPase in the yeast Saccharomyces cerevisiae. FEMS Yeast Res 8: 622-630. doi: 10.1111/j.1567-1364.2008.00380.x
![]() |
[91] |
Stefan CP, Zhang N, Sokabe T, et al. (2013) Activation of an essential calcium signaling pathway in Saccharomyces cerevisiae by Kch1 and Kch2, putative low-affinity potassium transporters. Eukaryot Cell 12: 204-214. doi: 10.1128/EC.00299-12
![]() |
[92] |
Stefan CP, Cunningham KW (2013) Kch1 family proteins mediate essential responses to endoplasmic reticulum stresses in the yeasts Saccharomyces cerevisiae and Candida albicans. J Biol Chem 288: 34861-34870. doi: 10.1074/jbc.M113.508705
![]() |
[93] |
Maruoka T, Nagasoe Y, Inoue S, et al. (2002) Essential hydrophilic carboxyl-terminal regions including cysteine residues of the yeast stretch-activated calcium-permeable channel Mid1. J Biol Chem 277: 11645-11652. doi: 10.1074/jbc.M111603200
![]() |
[94] |
Possani LD, Becerril B, Delepierre M, et al. (1999) Scorpion toxins specific for Na+-channels. Eur J Biochem 264: 287-300. doi: 10.1046/j.1432-1327.1999.00625.x
![]() |
[95] |
Senatore A, Monteil A, van Minnen J, et al. (2013) NALCN ion channels have alternative selectivity filters resembling calcium channels or sodium channels. PLoS One 8: e55088. doi: 10.1371/journal.pone.0055088
![]() |
[96] | Ghezzi A, Liebeskind BJ, Thompson A, et al. (2014) Ancient association between cation leak channels and Mid1 proteins is conserved in fungi and animals. Front Mol Neurosci 7: 15. |
[97] |
Teng J, Goto R, Iida K, et al. (2008) Ion-channel blocker sensitivity of voltage-gated calcium-channel homologue Cch1 in Saccharomyces cerevisiae. Microbiology 154: 3775-3781. doi: 10.1099/mic.0.2008/021089-0
![]() |
[98] |
Kmetzsch L, Staats CC, Rodrigues ML, et al. (2011) Calcium signaling components in the human pathogen: Cryptococcus neoformans. Commun Integr Biol 4: 186-187. doi: 10.4161/cib.4.2.14271
![]() |
[99] |
de Castro PA, Chiaratto J, Winkelstroter LK, et al. (2014) The involvement of the Mid1/Cch1/Yvc1 calcium channels in Aspergillus fumigatus virulence. PLoS One 9: e103957. doi: 10.1371/journal.pone.0103957
![]() |
[100] |
Yang M, Brand A, Srikantha T, et al. (2011) Fig1 Facilitates Calcium Influx and Localizes to Membranes Destined To Undergo Fusion during Mating in Candida albicans. Eukaryot Cell 10: 435-444. doi: 10.1128/EC.00145-10
![]() |
[101] |
Cavinder B, Trail F (2012) Role of Fig1, a component of the low-affinity calcium uptake system, in growth and sexual development of filamentous fungi. Eukaryot Cell 11: 978-988. doi: 10.1128/EC.00007-12
![]() |
[102] |
Muller E, Mackin N, Erdman S, et al. (2003) Fig1p facilitates Ca2+ influx and cell fusion during mating of Saccharomyces cerevisiae. J Biol Chem 278: 38461-38469. doi: 10.1074/jbc.M304089200
![]() |
[103] |
Zhang S, Zheng H, Long N, et al. (2014) FigA, a putative homolog of low-affinity calcium system member Fig1 in Saccharomyces cerevisiae, is involved in growth and asexual and sexual development in Aspergillus nidulans. Eukaryot Cell 13: 295-303. doi: 10.1128/EC.00257-13
![]() |
[104] |
Van Itallie CM, Anderson JM (2006) Claudins and epithelial paracellular transport. Annu Rev Physiol 68: 403-429. doi: 10.1146/annurev.physiol.68.040104.131404
![]() |
[105] | Gunzel D, Fromm M (2012) Claudins and other tight junction proteins. Compr Physiol 2: 1819-1852. |
[106] |
Zhang N, Dudgeon D, Paliwal S, et al. (2006) Multiple signaling pathways regulate yeast cell death during the response to mating pheromones. Mol Biol Cell 17: 3409-3422. doi: 10.1091/mbc.E06-03-0177
![]() |
[107] | Brand A, Shanks S, Duncan VM, et al. (2007) Hyphal orientation of Candida albicans is regulated by a calcium-dependent mechanism. Curr Biol 17: 347-352. |
[108] |
Venkatachalam K, Montell C (2007) TRP channels. Annu Rev Biochem 76: 387-417. doi: 10.1146/annurev.biochem.75.103004.142819
![]() |
[109] |
Vrenken KS, Jalink K, van Leeuwen FN, et al. (2016) Beyond ion-conduction: Channel-dependent and -independent roles of TRP channels during development and tissue homeostasis. Biochim Biophys Acta 1863: 1436-1446. doi: 10.1016/j.bbamcr.2015.11.008
![]() |
[110] |
Palmer C, Zhou X, Lin J, et al. (2001) A TRP homolog in Saccharomyces cerevisiae forms an intracellular Ca2+-permeable channel in the yeast vacuolar membrane. Proc Natl Acad Sci U S A 98: 7801-7805. doi: 10.1073/pnas.141036198
![]() |
[111] |
Denis V, Cyert M (2002) Internal Ca2+ release in yeast is triggered by hypertonic shock and mediated by a TRP channel homologue. J Cell Biol 156: 29-34. doi: 10.1083/jcb.200111004
![]() |
[112] |
Zhou X, Batiza A, Loukin S, et al. (2003) The transient receptor potential channel on the yeast vacuole is mechanosensitive. Proc Natl Acad Sci U S A 100: 7105-7110. doi: 10.1073/pnas.1230540100
![]() |
[113] |
Chang Y, Schlenstedt G, Flockerzi V, et al. (2010) Properties of the intracellular transient receptor potential (TRP) channel in yeast, Yvc1. FEBS Lett 584: 2028-2032. doi: 10.1016/j.febslet.2009.12.035
![]() |
[114] |
Su Z, Zhou X, Loukin S, et al. (2009) Mechanical force and cytoplasmic Ca2+ activate yeast TRPY1 in parallel. J Membr Biol 227: 141-150. doi: 10.1007/s00232-009-9153-9
![]() |
[115] |
Su Z, Anishkin A, Kung C, et al. (2011) The core domain as the force sensor of the yeast mechanosensitive TRP channel. J Gen Physiol 138: 627-640. doi: 10.1085/jgp.201110693
![]() |
[116] |
Bouillet LE, Cardoso AS, Perovano E, et al. (2012) The involvement of calcium carriers and of the vacuole in the glucose-induced calcium signaling and activation of the plasma membrane H+-ATPase in Saccharomyces cerevisiae cells. Cell Calcium 51: 72-81. doi: 10.1016/j.ceca.2011.10.008
![]() |
[117] |
Yu Q, Wang F, Zhao Q, et al. (2014) A novel role of the vacuolar calcium channel Yvc1 in stress response, morphogenesis and pathogenicity of Candida albicans. Int J Med Microbiol 304: 339-350. doi: 10.1016/j.ijmm.2013.11.022
![]() |
[118] |
Prole DL, Taylor CW (2012) Identification and analysis of cation channel homologues in human pathogenic fungi. PLoS One 7: e42404. doi: 10.1371/journal.pone.0042404
![]() |
[119] |
Boratyn GM, Camacho C, Cooper PS, et al. (2013) BLAST: a more efficient report with usability improvements. Nucleic Acids Res 41: W29-33. doi: 10.1093/nar/gkt282
![]() |
[120] |
Goncalves AP, Cordeiro JM, Monteiro J, et al. (2014) Activation of a TRP-like channel and intracellular Ca2+ dynamics during phospholipase-C-mediated cell death. J Cell Sci 127: 3817-3829. doi: 10.1242/jcs.152058
![]() |
[121] |
Bonilla M, Nastase K, Cunningham K (2002) Essential role of calcineurin in response to endoplasmic reticulum stress. EMBO J 21: 2343-2353. doi: 10.1093/emboj/21.10.2343
![]() |
[122] |
Hong MP, Vu K, Bautos J, et al. (2010) Cch1 restores intracellular Ca2+ in fungal cells during endoplasmic reticulum stress. J Biol Chem 285: 10951-10958. doi: 10.1074/jbc.M109.056218
![]() |
[123] |
Okada Y, Maeno E, Shimizu T, et al. (2001) Receptor-mediated control of regulatory volume decrease (RVD) and apoptotic volume decrease (AVD). J Physiol 532: 3-16. doi: 10.1111/j.1469-7793.2001.0003g.x
![]() |
[124] |
Becker D, Blase C, Bereiter-Hahn J, et al. (2005) TRPV4 exhibits a functional role in cell-volume regulation. J Cell Sci 118: 2435-2440. doi: 10.1242/jcs.02372
![]() |
[125] | Numata T, Shimizu T, Okada Y (2007) TRPM7 is a stretch- and swelling-activated cation channel involved in volume regulation in human epithelial cells. Am J Physiol Cell Physiol 292: C460-467. |
[126] |
Berrier C, Besnard M, Ajouz B, et al. (1996) Multiple mechanosensitive ion channels from Escherichia coli, activated at different thresholds of applied pressure. J Membr Biol 151: 175-187. doi: 10.1007/s002329900068
![]() |
[127] |
Rigamonti M, Belotti F, Martegani E, et al. (2013) Novel role for known and unknown calcium transport involved proteins in Saccharomyces cerevisiae. Yeast 30: 157. doi: 10.1002/yea.2946
![]() |
[128] |
Protchenko O, Rodriguez-Suarez R, Androphy R, et al. (2006) A screen for genes of heme uptake identifies the FLC family required for import of FAD into the endoplasmic reticulum. J Biol Chem 281: 21445-21457. doi: 10.1074/jbc.M512812200
![]() |
[129] |
Palmer CP, Aydar E, Djamgoz MB (2005) A microbial TRP-like polycystic-kidney-disease-related ion channel gene. Biochem J 387: 211-219. doi: 10.1042/BJ20041710
![]() |
[130] |
Aydar E, Palmer CP (2009) Polycystic kidney disease channel and synaptotagmin homologues play roles in Schizosaccharomyces pombe cell wall synthesis/repair and membrane protein trafficking. J Membr Biol 229: 141-152. doi: 10.1007/s00232-009-9180-6
![]() |
[131] | Rzhetsky A, Nei M (1994) METREE: a program package for inferring and testing minimum-evolution trees. Comput Appl Biosci 10: 409-412. |
[132] |
Tamura K, Stecher G, Peterson D, et al. (2013) MEGA6: Molecular Evolutionary Genetics Analysis version 6.0. Mol Biol Evol 30: 2725-2729. doi: 10.1093/molbev/mst197
![]() |
[133] |
Efron B, Halloran E, Holmes S (1996) Bootstrap confidence levels for phylogenetic trees. Proc Natl Acad Sci U S A 93: 13429-13434. doi: 10.1073/pnas.93.23.13429
![]() |
[134] | Jones DT, Taylor WR, Thornton JM (1992) The rapid generation of mutation data matrices from protein sequences. Comput Appl Biosci 8: 275-282. |
[135] | Nei M, Kumar S (2000) Molecular Evolution and Phylogenetics, Oxford University Press, New York. |
[136] | Saitou N, Nei M (1987) The neighbor-joining method: a new method for reconstructing phylogenetic trees. Mol Biol Evol 4: 406-425. |
[137] |
Hsiang T, Baillie DL (2005) Comparison of the yeast proteome to other fungal genomes to find core fungal genes. J Mol Evol 60: 475-483. doi: 10.1007/s00239-004-0218-1
![]() |
[138] |
Bok JW, Sone T, Silverman-Gavrila LB, et al. (2001) Structure and function analysis of the calcium-related gene spray in Neurospora crassa. Fungal Genet Biol 32: 145-158. doi: 10.1006/fgbi.2000.1259
![]() |
[139] |
Stephenson KS, Gow NA, Davidson FA, et al. (2014) Regulation of vectorial supply of vesicles to the hyphal tip determines thigmotropism in Neurospora crassa. Fungal Biol 118: 287-294. doi: 10.1016/j.funbio.2013.12.007
![]() |
[140] |
Colletti GA, Kiselyov K (2011) TRPML1. Adv Exp Med Biol 704: 209-219. doi: 10.1007/978-94-007-0265-3_11
![]() |
[141] |
Puertollano R, Kiselyov K (2009) TRPMLs: in sickness and in health. Am J Physiol Renal Physiol 296: F1245-1254. doi: 10.1152/ajprenal.90522.2008
![]() |
[142] | Fares H, Greenwald I (2001) Regulation of endocytosis by CUP-5, the Caenorhabditis elegans mucolipin-1 homolog. Nat Genet 28: 64-68. |
[143] |
Lima WC, Leuba F, Soldati T, et al. (2012) Mucolipin controls lysosome exocytosis in Dictyostelium. J Cell Sci 125: 2315-2322. doi: 10.1242/jcs.100362
![]() |
[144] | Dong XP, Shen D, Wang X, et al. (2010) PI(3,5)P(2) controls membrane trafficking by direct activation of mucolipin Ca2+ release channels in the endolysosome. Nat Commun 1: 38. |
[145] |
Ma Y, Sugiura R, Koike A, et al. (2011) Transient receptor potential (TRP) and Cch1-Yam8 channels play key roles in the regulation of cytoplasmic Ca2+ in fission yeast. PLoS One 6: e22421. doi: 10.1371/journal.pone.0022421
![]() |
[146] | Bonora M, Pinton P (2014) The mitochondrial permeability transition pore and cancer: molecular mechanisms involved in cell death. Front Oncol 4: 302. |
[147] |
Carraro M, Giorgio V, Sileikyte J, et al. (2014) Channel formation by yeast F-ATP synthase and the role of dimerization in the mitochondrial permeability transition. J Biol Chem 289: 15980-15985. doi: 10.1074/jbc.C114.559633
![]() |
[148] |
De Stefani D, Raffaello A, Teardo E, et al. (2011) A forty-kilodalton protein of the inner membrane is the mitochondrial calcium uniporter. Nature 476: 336-340. doi: 10.1038/nature10230
![]() |
[149] |
Baughman JM, Perocchi F, Girgis HS, et al. (2011) Integrative genomics identifies MCU as an essential component of the mitochondrial calcium uniporter. Nature 476: 341-345. doi: 10.1038/nature10234
![]() |
[150] |
Marchi S, Pinton P (2014) The mitochondrial calcium uniporter complex: molecular components, structure and physiopathological implications. J Physiol 592: 829-839. doi: 10.1113/jphysiol.2013.268235
![]() |
[151] |
Uribe S, Rangel P, Pardo J (1992) Interactions of calcium with yeast mitochondria. Cell Calcium 13: 211-217. doi: 10.1016/0143-4160(92)90009-H
![]() |
[152] |
Nakayama Y, Yoshimura K, Iida H (2012) Organellar mechanosensitive channels in fission yeast regulate the hypo-osmotic shock response. Nat Commun 3: 1020. doi: 10.1038/ncomms2014
![]() |
[153] |
Nakayama Y, Hirata A, Iida H (2014) Mechanosensitive channels Msy1 and Msy2 are required for maintaining organelle integrity upon hypoosmotic shock in Schizosaccharomyces pombe. FEMS Yeast Res 14: 992-994. doi: 10.1111/1567-1364.12181
![]() |
[154] |
Gustin MC, Zhou XL, Martinac B, et al. (1988) A mechanosensitive ion channel in the yeast plasma membrane. Science 242: 762-765. doi: 10.1126/science.2460920
![]() |
[155] |
Triggle DJ (2006) L-type calcium channels. Curr Pharm Des 12: 443-457. doi: 10.2174/138161206775474503
![]() |
[156] |
Jiang L, Alber J, Wang J, et al. (2012) The Candida albicans plasma membrane protein Rch1p, a member of the vertebrate SLC10 carrier family, is a novel regulator of cytosolic Ca2+ homoeostasis. Biochem J 444: 497-502. doi: 10.1042/BJ20112166
![]() |
[157] |
Zhao Y, Yan H, Happeck R, et al. (2016) The plasma membrane protein Rch1 is a negative regulator of cytosolic calcium homeostasis and positively regulated by the calcium/calcineurin signaling pathway in budding yeast. Eur J Cell Biol 95: 164-174. doi: 10.1016/j.ejcb.2016.01.001
![]() |
[158] |
Kraus P, Heitman J (2003) Coping with stress: calmodulin and calcineurin in model and pathogenic fungi. Biochem Biophys Res Commun 311: 1151-1157. doi: 10.1016/S0006-291X(03)01528-6
![]() |
[159] |
Lewit-Bentley A, Rety S (2000) EF-hand calcium-binding proteins. Curr Opin Struct Biol 10: 637-643. doi: 10.1016/S0959-440X(00)00142-1
![]() |
[160] | Matsuura I, Ishihara K, Nakai Y, et al. (1991) A site-directed mutagenesis study of yeast calmodulin. J Biochem 109: 190-197. |
[161] |
Cyert M (2001) Genetic analysis of calmodulin and its targets in Saccharomyces cerevisiae. Annu Rev Genet 35: 647-672. doi: 10.1146/annurev.genet.35.102401.091302
![]() |
[162] |
Cruz MC, Goldstein AL, Blankenship JR, et al. (2002) Calcineurin is essential for survival during membrane stress in Candida albicans. EMBO J 21: 546-559. doi: 10.1093/emboj/21.4.546
![]() |
[163] |
Kontoyiannis DP, Lewis RE, Osherov N, et al. (2003) Combination of caspofungin with inhibitors of the calcineurin pathway attenuates growth in vitro in Aspergillus species. J Antimicrob Chemother 51: 313-316. doi: 10.1093/jac/dkg090
![]() |
[164] |
Steinbach WJ, Reedy JL, Cramer RA Jr, et al. (2007) Harnessing calcineurin as a novel anti-infective agent against invasive fungal infections. Nat Rev Microbiol 5: 418-430. doi: 10.1038/nrmicro1680
![]() |
[165] |
Rispail N, Soanes DM, Ant C, et al. (2009) Comparative genomics of MAP kinase and calcium-calcineurin signalling components in plant and human pathogenic fungi. Fungal Genet Biol 46: 287-298. doi: 10.1016/j.fgb.2009.01.002
![]() |
[166] |
Moser M, Lee S, Klevit R, et al. (1995) Ca2+ binding to calmodulin and its role in Schizosaccharomyces pombe as revealed by mutagenesis and NMR spectroscopy. J Biol Chem 270: 20643-20652. doi: 10.1074/jbc.270.35.20643
![]() |
[167] |
Joseph J, Means A (2002) Calcium binding is required for calmodulin function in Aspergillus nidulans. Eukaryot Cell 1: 119-125. doi: 10.1128/EC.01.1.119-125.2002
![]() |
[168] |
Davis T, Urdea M, Masiarz F, et al. (1986) Isolation of the yeast calmodulin gene: calmodulin is an essential protein. Cell 47: 423-431. doi: 10.1016/0092-8674(86)90599-4
![]() |
[169] |
Geiser J, van Tuinen D, Brockerhoff S, et al. (1991) Can calmodulin function without binding calcium? Cell 65: 949-959. doi: 10.1016/0092-8674(91)90547-C
![]() |
[170] |
Ohya Y, Botstein D (1994) Diverse essential functions revealed by complementing yeast calmodulin mutants. Science 263: 963-966. doi: 10.1126/science.8310294
![]() |
[171] |
Uttenweiler A, Schwarz H, Mayer A (2005) Microautophagic vacuole invagination requires calmodulin in a Ca2+-independent function. J Biol Chem 280: 33289-33297. doi: 10.1074/jbc.M506086200
![]() |
[172] |
Geiser JR, Sundberg HA, Chang BH, et al. (1993) The essential mitotic target of calmodulin is the 110-kilodalton component of the spindle pole body in Saccharomyces cerevisiae. Mol Cell Biol 13: 7913-7924. doi: 10.1128/MCB.13.12.7913
![]() |
[173] |
Brockerhoff S, Stevens R, Davis T (1994) The unconventional myosin, Myo2p, is a calmodulin target at sites of cell growth in Saccharomyces cerevisiae. J Cell Biol 124: 315-323. doi: 10.1083/jcb.124.3.315
![]() |
[174] |
de Carvalho MJ, Amorim Jesuino RS, Daher BS, et al. (2003) Functional and genetic characterization of calmodulin from the dimorphic and pathogenic fungus Paracoccidioides brasiliensis. Fungal Genet Biol 39: 204-210. doi: 10.1016/S1087-1845(03)00044-6
![]() |
[175] | Lee SC, Lee YH (1998) Calcium/calmodulin-dependent signaling for appressorium formation in the plant pathogenic fungus Magnaporthe grisea. Mol Cells 8: 698-704. |
[176] |
Warwar V, Oved S, Dickman MB (2000) Antisense expression of the calmodulin gene from Colletotrichum trifolii impairs prepenetration development(1). FEMS Microbiol Lett 191: 213-219. doi: 10.1111/j.1574-6968.2000.tb09342.x
![]() |
[177] |
Kraus PR, Nichols CB, Heitman J (2005) Calcium- and calcineurin-independent roles for calmodulin in Cryptococcus neoformans morphogenesis and high-temperature growth. Eukaryot Cell 4: 1079-1087. doi: 10.1128/EC.4.6.1079-1087.2005
![]() |
[178] | Ohya Y, Kawasaki H, Suzuki K, et al. (1991) Two yeast genes encoding calmodulin-dependent protein kinases. Isolation, sequencing and bacterial expressions of CMK1 and CMK2. J Biol Chem 266: 12784-12794. |
[179] |
Cyert M, Kunisawa R, Kaim D, et al. (1991) Yeast has homologs (CNA1 and CNA2 gene products) of mammalian calcineurin, a calmodulin-regulated phosphoprotein phosphatase. Proc Natl Acad Sci U S A 88: 7376-7380. doi: 10.1073/pnas.88.16.7376
![]() |
[180] |
Bodvard K, Jorhov A, Blomberg A, et al. (2013) The yeast transcription factor Crz1 is activated by light in a Ca2+/calcineurin-dependent and PKA-independent manner. PLoS One 8: e53404. doi: 10.1371/journal.pone.0053404
![]() |
[181] |
Farcasanu IC, Mitrica R, Cristache L, et al. (2013) Optical manipulation of Saccharomyces cerevisiae cells reveals that green light protection against UV irradiation is favored by low Ca2+ and requires intact UPR pathway. FEBS Lett 587: 3514-3521. doi: 10.1016/j.febslet.2013.09.008
![]() |
[182] |
Hirata D, Harada S, Namba H, et al. (1995) Adaptation to high-salt stress in Saccharomyces cerevisiae is regulated by Ca2+/calmodulin-dependent phosphoprotein phosphatase (calcineurin) and cAMP-dependent protein kinase. Mol Gen Genet 249: 257-264. doi: 10.1007/BF00290525
![]() |
[183] |
Iida H, Ohya Y, Anraku Y (1995) Calmodulin-dependent protein kinase II and calmodulin are required for induced thermotolerance in Saccharomyces cerevisiae. Curr Genet 27: 190-193. doi: 10.1007/BF00313434
![]() |
[184] |
Moser M, Geiser J, Davis T (1996) Ca2+-calmodulin promotes survival of pheromone-induced growth arrest by activation of calcineurin and Ca2+-calmodulin-dependent protein kinase. Mol Cell Biol 16: 4824-4831. doi: 10.1128/MCB.16.9.4824
![]() |
[185] |
Breuder T, Hemenway CS, Movva NR, et al. (1994) Calcineurin is essential in cyclosporin A- and FK506-sensitive yeast strains. Proc Natl Acad Sci U S A 91: 5372-5376. doi: 10.1073/pnas.91.12.5372
![]() |
[186] | Hemenway CS, Dolinski K, Cardenas ME, et al. (1995) vph6 mutants of Saccharomyces cerevisiae require calcineurin for growth and are defective in vacuolar H+-ATPase assembly. Genetics 141: 833-844. |
[187] | Holyoak CD, Thompson S, Ortiz Calderon C, et al. (2000) Loss of Cmk1 Ca2+-calmodulin-dependent protein kinase in yeast results in constitutive weak organic acid resistance, associated with a post-transcriptional activation of the Pdr12 ATP-binding cassette transporter. Mol Microbiol 37: 595-605. |
[188] |
Mendoza I, Quintero FJ, Bressan RA, et al. (1996) Activated calcineurin confers high tolerance to ion stress and alters the budding pattern and cell morphology of yeast cells. J Biol Chem 271: 23061-23067. doi: 10.1074/jbc.271.38.23061
![]() |
[189] |
Cyert M (2003) Calcineurin signaling in Saccharomyces cerevisiae: how yeast go crazy in response to stress. Biochem Biophys Res Commun 311: 1143-1150. doi: 10.1016/S0006-291X(03)01552-3
![]() |
[190] |
Stathopoulos-Gerontides A, Guo J, Cyert M (1999) Yeast calcineurin regulates nuclear localization of the Crz1p transcription factor through dephosphorylation. Genes Dev 13: 798-803. doi: 10.1101/gad.13.7.798
![]() |
[191] |
Boustany L, Cyert M (2002) Calcineurin-dependent regulation of Crz1p nuclear export requires Msn5p and a conserved calcineurin docking site. Genes Dev 16: 608-619. doi: 10.1101/gad.967602
![]() |
[192] |
Yoshimoto H, Saltsman K, Gasch A, et al. (2002) Genome-wide analysis of gene expression regulated by the calcineurin/Crz1p signaling pathway in Saccharomyces cerevisiae. J Biol Chem 277: 31079-31088. doi: 10.1074/jbc.M202718200
![]() |
[193] |
Marchi V, Sorin A, Wei Y, et al. (1999) Induction of vacuolar Ca2+-ATPase and H+/Ca2+ exchange activity in yeast mutants lacking Pmr1, the Golgi Ca2+-ATPase. FEBS Lett 454: 181-186. doi: 10.1016/S0014-5793(99)00803-0
![]() |
[194] |
Cunningham K, Fink G (1996) Calcineurin inhibits VCX1-dependent H+/Ca2+ exchange and induces Ca2+ ATPases in Saccharomyces cerevisiae. Mol Cell Biol 16: 2226-2237. doi: 10.1128/MCB.16.5.2226
![]() |
[195] |
Zhao C, Jung U, Garrett-Engele P, et al. (1998) Temperature-induced expression of yeast FKS2 is under the dual control of protein kinase C and calcineurin. Mol Cell Biol 18: 1013-1022. doi: 10.1128/MCB.18.2.1013
![]() |
[196] |
Hernandez-Lopez M. J, Panadero J, Prieto JA, et al. (2006) Regulation of salt tolerance by Torulaspora delbrueckii calcineurin target Crz1p. Eukaryot Cell 5: 469-479. doi: 10.1128/EC.5.3.469-479.2006
![]() |
[197] |
Chen YL, Brand A, Morrison EL, et al. (2011) Calcineurin controls drug tolerance, hyphal growth, and virulence in Candida dubliniensis. Eukaryot Cell 10: 803-819. doi: 10.1128/EC.00310-10
![]() |
[198] |
Chen YL, Yu SJ, Huang HY, et al. (2014) Calcineurin controls hyphal growth, virulence, and drug tolerance of Candida tropicalis. Eukaryot Cell 13: 844-854. doi: 10.1128/EC.00302-13
![]() |
[199] | Juvvadi PR, Kuroki Y, Arioka M, et al. (2003) Functional analysis of the calcineurin-encoding gene cnaA from Aspergillus oryzae: evidence for its putative role in stress adaptation. Arch Microbiol 179: 416-422. |
[200] |
Kothe GO, Free SJ (1998) Calcineurin subunit B is required for normal vegetative growth in Neurospora crassa. Fungal Genet Biol 23: 248-258. doi: 10.1006/fgbi.1998.1037
![]() |
[201] |
Harel A, Bercovich S, Yarden O (2006) Calcineurin is required for sclerotial development and pathogenicity of Sclerotinia sclerotiorum in an oxalic acid-independent manner. Mol Plant Microbe Interact 19: 682-693. doi: 10.1094/MPMI-19-0682
![]() |
[202] | Choi J, Kim Y, Lee Y (2009) Functional analysis of MCNA, a gene encoding a catalytic subunit of calcineurin, in the rice blast fungus Magnaporthe oryzae. J Microbiol Biotechnol 19: 11-16. |
[203] |
Cramer RA Jr, Perfect BZ, Pinchai N, et al. (2008) Calcineurin target CrzA regulates conidial germination, hyphal growth, and pathogenesis of Aspergillus fumigatus. Eukaryot Cell 7: 1085-1097. doi: 10.1128/EC.00086-08
![]() |
[204] |
Steinbach WJ, Cramer RA Jr, Perfect BZ et al. (2006) Calcineurin controls growth, morphology, and pathogenicity in Aspergillus fumigatus. Eukaryot Cell 5: 1091-1103. doi: 10.1128/EC.00139-06
![]() |
[205] |
Juvvadi PR, Fortwendel JR, Pinchai N, et al. (2008) Calcineurin localizes to the hyphal septum in Aspergillus fumigatus: implications for septum formation and conidiophore development. Eukaryot Cell 7: 1606-1610. doi: 10.1128/EC.00200-08
![]() |
[206] |
Juvvadi PR, Fortwendel JR, Rogg LE, et al. (2011) Localization and activity of the calcineurin catalytic and regulatory subunit complex at the septum is essential for hyphal elongation and proper septation in Aspergillus fumigatus. Mol Microbiol 82: 1235-1259. doi: 10.1111/j.1365-2958.2011.07886.x
![]() |
[207] |
Miyakawa T, Mizunuma M (2007) Physiological roles of calcineurin in Saccharomyces cerevisiae with special emphasis on its roles in G2/M cell-cycle regulation. Biosci Biotechnol Biochem 71: 633-645. doi: 10.1271/bbb.60495
![]() |
[208] |
Wu H, Peisley A, Graef IA, et al. (2007) NFAT signaling and the invention of vertebrates. Trends Cell Biol 17: 251-260. doi: 10.1016/j.tcb.2007.04.006
![]() |
[209] | Hirayama S, Sugiura R, Lu Y, et al. (2003) Zinc finger protein Prz1 regulates Ca2+ but not Cl- homeostasis in fission yeast. Identification of distinct branches of calcineurin signaling pathway in fission yeast. J Biol Chem 278: 18078-18084. |
[210] |
Soriani FM, Malavazi I, da Silva Ferreira ME, et al. (2008) Functional characterization of the Aspergillus fumigatus CRZ1 homologue, CrzA. Mol Microbiol 67: 1274-1291. doi: 10.1111/j.1365-2958.2008.06122.x
![]() |
[211] |
Thewes S (2014) Calcineurin-Crz1 signaling in lower eukaryotes. Eukaryot Cell 13: 694-705. doi: 10.1128/EC.00038-14
![]() |
[212] |
Zhang H, Zhao Q, Liu K, et al. (2009) MgCRZ1, a transcription factor of Magnaporthe grisea, controls growth, development and is involved in full virulence. FEMS Microbiol Lett 293: 160-169. doi: 10.1111/j.1574-6968.2009.01524.x
![]() |
[213] |
Choi J, Kim Y, Kim S, et al. (2009) MoCRZ1, a gene encoding a calcineurin-responsive transcription factor, regulates fungal growth and pathogenicity of Magnaporthe oryzae. Fungal Genet Biol 46: 243-254. doi: 10.1016/j.fgb.2008.11.010
![]() |
[214] |
Adler A, Park YD, Larsen P, et al. (2011) A novel specificity protein 1 (SP1)-like gene regulating protein kinase C-1 (Pkc1)-dependent cell wall integrity and virulence factors in Cryptococcus neoformans. J Biol Chem 286: 20977-20990. doi: 10.1074/jbc.M111.230268
![]() |
[215] |
Lev S, Desmarini D, Chayakulkeeree M, et al. (2012) The Crz1/Sp1 transcription factor of Cryptococcus neoformans is activated by calcineurin and regulates cell wall integrity. PLoS One 7: e51403. doi: 10.1371/journal.pone.0051403
![]() |
[216] | Moranova Z, Virtudazo E, Hricova K, et al. (2014) The CRZ1/SP1-like gene links survival under limited aeration, cell integrity and biofilm formation in the pathogenic yeast Cryptococcus neoformans. Biomed Pap Med Fac Univ Palacky Olomouc Czech Repub 158: 212-220. |
[217] |
Santos M, de Larrinoa I (2005) Functional characterization of the Candida albicans CRZ1 gene encoding a calcineurin-regulated transcription factor. Curr Genet 48: 88-100. doi: 10.1007/s00294-005-0003-8
![]() |
[218] |
Karababa M, Valentino E, Pardini G, et al. (2006) CRZ1, a target of the calcineurin pathway in Candida albicans. Mol Microbiol 59: 1429-1451. doi: 10.1111/j.1365-2958.2005.05037.x
![]() |
[219] |
Chen YL, Konieczka JH, Springer DJ, et al. (2012) Convergent Evolution of Calcineurin Pathway Roles in Thermotolerance and Virulence in Candida glabrata. G3 (Bethesda) 2: 675-691. doi: 10.1534/g3.112.002279
![]() |
[220] |
Zhang J, Silao FG, Bigol UG, et al. (2012) Calcineurin is required for pseudohyphal growth, virulence, and drug resistance in Candida lusitaniae. PLoS One 7: e44192. doi: 10.1371/journal.pone.0044192
![]() |
[221] |
Araki Y, Wu H, Kitagaki H, et al. (2009) Ethanol stress stimulates the Ca2+-mediated calcineurin/Crz1 pathway in Saccharomyces cerevisiae. J Biosci Bioeng 107: 1-6. doi: 10.1016/j.jbiosc.2008.09.005
![]() |
[222] |
Zhang T, Xu Q, Sun X, et al. (2013) The calcineurin-responsive transcription factor Crz1 is required for conidation, full virulence and DMI resistance in Penicillium digitatum. Microbiol Res 168: 211-222. doi: 10.1016/j.micres.2012.11.006
![]() |
[223] |
Calvo IA, Gabrielli N, Iglesias-Baena I, et al. (2009) Genome-wide screen of genes required for caffeine tolerance in fission yeast. PLoS One 4: e6619. doi: 10.1371/journal.pone.0006619
![]() |
[224] |
Kafadar K, Cyert M (2004) Integration of stress responses: modulation of calcineurin signaling in Saccharomyces cerevisiae by protein kinase A. Eukaryot Cell 3: 1147-1153. doi: 10.1128/EC.3.5.1147-1153.2004
![]() |
[225] |
Kafadar K, Zhu H, Snyder M, et al. (2003) Negative regulation of calcineurin signaling by Hrr25p, a yeast homolog of casein kinase I. Genes Dev 17: 2698-2708. doi: 10.1101/gad.1140603
![]() |
[226] |
Koike A, Kato T, Sugiura R, et al. (2012) Genetic screening for regulators of Prz1, a transcriptional factor acting downstream of calcineurin in fission yeast. J Biol Chem 287: 19294-19303. doi: 10.1074/jbc.M111.310615
![]() |
[227] |
Williams K, Cyert M (2001) The eukaryotic response regulator Skn7p regulates calcineurin signaling through stabilization of Crz1p. EMBO J 20: 3473-3483. doi: 10.1093/emboj/20.13.3473
![]() |
[228] |
Hernandez-Ortiz P, Espeso EA (2013) Phospho-regulation and nucleocytoplasmic trafficking of CrzA in response to calcium and alkaline-pH stress in Aspergillus nidulans. Mol Microbiol 89: 532-551. doi: 10.1111/mmi.12294
![]() |
[229] |
da Silva Ferreira ME, Heinekamp T, Hartl A, et al. (2007) Functional characterization of the Aspergillus fumigatus calcineurin. Fungal Genet Biol 44: 219-230. doi: 10.1016/j.fgb.2006.08.004
![]() |
[230] |
Ruiz A, Serrano R, Ari?o J (2008) Direct regulation of genes involved in glucose utilization by the calcium/calcineurin pathway. J Biol Chem 283: 13923-13933. doi: 10.1074/jbc.M708683200
![]() |
[231] |
Rodriguez C, Galindo LR, Siverio JM (2013) Nitrogen-dependent calcineurin activation in the yeast Hansenula polymorpha. Fungal Genet Biol 53: 34-41. doi: 10.1016/j.fgb.2013.01.007
![]() |
[232] |
Li H, Rao A, Hogan PG (2011) Interaction of calcineurin with substrates and targeting proteins. Trends Cell Biol 21: 91-103. doi: 10.1016/j.tcb.2010.09.011
![]() |
[233] |
Gorlach J, Fox DS, Cutler NS, et al. (2000) Identification and characterization of a highly conserved calcineurin binding protein, CBP1/calcipressin in Cryptococcus neoformans. EMBO J 19: 3618-3629. doi: 10.1093/emboj/19.14.3618
![]() |
[234] |
Fuentes JJ, Pritchard MA, Estivill X (1997) Genomic organization, alternative splicing, and expression patterns of the DSCR1 (Down syndrome candidate region 1) gene. Genomics 44: 358-361. doi: 10.1006/geno.1997.4866
![]() |
[235] |
Hilioti Z, Gallagher DA, Low-Nam ST, et al. (2004) GSK-3 kinases enhance calcineurin signaling by phosphorylation of RCNs. Genes Dev 18: 35-47. doi: 10.1101/gad.1159204
![]() |
[236] |
Mehta S, Li H, Hogan P, et al. (2009) Domain architecture of the regulators of calcineurin (RCANs) and identification of a divergent RCAN in yeast. Mol Cell Biol 29: 2777-2793. doi: 10.1128/MCB.01197-08
![]() |
[237] |
Kishi T, Ikeda A, Nagao R, et al. (2007) The SCFCdc4 ubiquitin ligase regulates calcineurin signaling through degradation of phosphorylated Rcn1, an inhibitor of calcineurin. Proc Natl Acad Sci U S A 104: 17418-17423. doi: 10.1073/pnas.0704951104
![]() |
[238] | Rusnak F, Mertz P (2000) Calcineurin: form and function. Physiol Rev 80: 1483-1521. |
[239] |
Connolly S, Kingsbury T (2012) Regulatory subunit myristoylation antagonizes calcineurin phosphatase activation in yeast. J Biol Chem 287: 39361-39368. doi: 10.1074/jbc.M112.366617
![]() |
[240] |
Miranda-Saavedra D, Barton GJ (2007) Classification and functional annotation of eukaryotic protein kinases. Proteins 68: 893-914. doi: 10.1002/prot.21444
![]() |
[241] | Pausch M, Kaim D, Kunisawa R, et al. (1991) Multiple Ca2+/calmodulin-dependent protein kinase genes in a unicellular eukaryote. EMBO J 10: 1511-1522. |
[242] |
Dudgeon D, Zhang N, Ositelu O, et al. (2008) Nonapoptotic death of Saccharomyces cerevisiae cells that is stimulated by Hsp90 and inhibited by calcineurin and Cmk2 in response to endoplasmic reticulum stresses. Eukaryot Cell 7: 2037-2051. doi: 10.1128/EC.00291-08
![]() |
[243] |
Rasmussen CD (2000) Cloning of a calmodulin kinase I homologue from Schizosaccharomyces pombe. J Biol Chem 275: 685-690. doi: 10.1074/jbc.275.1.685
![]() |
[244] |
Sanchez-Piris M, Posas F, Alemany V, et al. (2002) The serine/threonine kinase Cmk2 is required for oxidative stress response in fission yeast. J Biol Chem 277: 17722-17727. doi: 10.1074/jbc.M200104200
![]() |
[245] |
Ding X, Yu Q, Zhang B, et al. (2014) The type II Ca2+/calmodulin-dependent protein kinases are involved in the regulation of cell wall integrity and oxidative stress response in Candida albicans. Biochem Biophys Res Commun 446: 1073-1078. doi: 10.1016/j.bbrc.2014.03.059
![]() |
[246] |
Yang Y, Cheng P, Zhi G, et al. (2001) Identification of a calcium/calmodulin-dependent protein kinase that phosphorylates the Neurospora circadian clock protein FREQUENCY. J Biol Chem 276: 41064-41072. doi: 10.1074/jbc.M106905200
![]() |
[247] |
Dayton JS, Means AR (1996) Ca2+/calmodulin-dependent kinase is essential for both growth and nuclear division in Aspergillus nidulans. Mol Biol Cell 7: 1511-1519. doi: 10.1091/mbc.7.10.1511
![]() |
[248] |
Liu XH, Lu JP, Dong B, et al. (2010) Disruption of MoCMK1, encoding a putative calcium/calmodulin-dependent kinase, in Magnaporthe oryzae. Microbiol Res 165: 402-410. doi: 10.1016/j.micres.2009.08.007
![]() |
[249] |
Hanyu Y, Imai KK, Kawasaki Y, et al. (2009) Schizosaccharomyces pombe cell division cycle under limited glucose requires Ssp1 kinase, the putative CaMKK, and Sds23, a PP2A-related phosphatase inhibitor. Genes Cells 14: 539-554. doi: 10.1111/j.1365-2443.2009.01290.x
![]() |
[250] |
Gomez-Hierro A, Lambea E, Gimenez-Zaragoza D, et al. (2015) Ssp1 CaMKK: A Sensor of Actin Polarization That Controls Mitotic Commitment through Srk1 in Schizosaccharomyces pombe. PLoS One 10: e0143037. doi: 10.1371/journal.pone.0143037
![]() |
[251] |
Cisneros-Barroso E, Yance-Chavez T, Kito A, et al. (2014) Negative feedback regulation of calcineurin-dependent Prz1 transcription factor by the CaMKK-CaMK1 axis in fission yeast. Nucleic Acids Res 42: 9573-9587. doi: 10.1093/nar/gku684
![]() |
[252] |
Yu Q, Wang H, Cheng X, et al. (2012) Roles of Cch1 and Mid1 in morphogenesis, oxidative stress response and virulence in Candida albicans. Mycopathologia 174: 359-369. doi: 10.1007/s11046-012-9569-0
![]() |
[253] |
Eilam Y, Othman M, Halachmi D (1990) Transient increase in Ca2+ influx in Saccharomyces cerevisiae in response to glucose: effects of intracellular acidification and cAMP levels. J Gen Microbiol 136: 2537-2543. doi: 10.1099/00221287-136-12-2537
![]() |
[254] | Bouillet LE, Cardoso AS, Perovano E, et al. (2011) The involvement of calcium carriers and of the vacuole in the glucose-induced calcium signaling and activation of the plasma membrane H+-ATPase in Saccharomyces cerevisiae cells. Cell Calcium 51: 72-81. |
[255] |
Tr��pia M, Cardoso A, Tisi R, et al. (2006) Calcium signaling and sugar-induced activation of plasma membrane H+-ATPase in Saccharomyces cerevisiae cells. Biochem Biophys Res Commun 343: 1234-1243. doi: 10.1016/j.bbrc.2006.03.078
![]() |
[256] |
Zhang Y, Rao R (2008) A spoke in the wheel: calcium spikes disrupt yeast cell cycle. Cell Cycle 7: 870-873. doi: 10.4161/cc.7.7.5616
![]() |
[257] |
Burgoyne R, Clague M (2003) Calcium and calmodulin in membrane fusion. Biochim Biophys Acta 1641: 137-143. doi: 10.1016/S0167-4889(03)00089-2
![]() |
[258] |
Garrett-Engele P, Moilanen B, Cyert M (1995) Calcineurin, the Ca2+/calmodulin-dependent protein phosphatase, is essential in yeast mutants with cell integrity defects and in mutants that lack a functional vacuolar H+-ATPase. Mol Cell Biol 15: 4103-4114. doi: 10.1128/MCB.15.8.4103
![]() |
[259] |
Deka R, Kumar R, Tamuli R (2011) Neurospora crassa homologue of Neuronal Calcium Sensor-1 has a role in growth, calcium stress tolerance, and ultraviolet survival. Genetica 139: 885-894. doi: 10.1007/s10709-011-9592-y
![]() |
[260] |
Deka R, Tamuli R (2013) Neurospora crassa ncs-1, mid-1 and nca-2 double-mutant phenotypes suggest diverse interaction among three Ca2+-regulating gene products. J Genet 92: 559-563. doi: 10.1007/s12041-013-0270-y
![]() |
[261] |
Tamuli R, Kumar R, Deka R (2011) Cellular roles of neuronal calcium sensor-1 and calcium/calmodulin-dependent kinases in fungi. J Basic Microbiol 51: 120-128. doi: 10.1002/jobm.201000184
![]() |
[262] |
Barman A, Tamuli R (2015) Multiple cellular roles of Neurospora crassa plc-1, splA2, and cpe-1 in regulation of cytosolic free calcium, carotenoid accumulation, stress responses, and acquisition of thermotolerance. J Microbiol 53: 226-235. doi: 10.1007/s12275-015-4465-1
![]() |
[263] |
Tamuli R, Deka R, Borkovich KA (2016) Calcineurin Subunits A and B Interact to Regulate Growth and Asexual and Sexual Development in Neurospora crassa. PLoS One 11: e0151867. doi: 10.1371/journal.pone.0151867
![]() |
[264] | Davenport K, Sohaskey M, Kamada Y, et al. (1995) A second osmosensing signal transduction pathway in yeast. Hypotonic shock activates the PKC1 protein kinase-regulated cell integrity pathway. J Biol Chem 270: 30157-30161. |
[265] |
Mizunuma M, Hirata D, Miyahara K, et al. (1998) Role of calcineurin and Mpk1 in regulating the onset of mitosis in budding yeast. Nature 392: 303-306. doi: 10.1038/32695
![]() |
[266] |
Levin DE (2005) Cell wall integrity signaling in Saccharomyces cerevisiae. Microbiol Mol Biol Rev 69: 262-291. doi: 10.1128/MMBR.69.2.262-291.2005
![]() |
[267] | Nakamura T, Ohmoto T, Hirata D, et al. (1996) Genetic evidence for the functional redundancy of the calcineurin- and Mpk1-mediated pathways in the regulation of cellular events important for growth in Saccharomyces cerevisiae. Mol Gen Genet 251: 211-219. |
[268] |
Mazur P, Morin N, Baginsky W, et al. (1995) Differential expression and function of two homologous subunits of yeast 1,3-beta-D-glucan synthase. Mol Cell Biol 15: 5671-5681. doi: 10.1128/MCB.15.10.5671
![]() |
[269] |
Wang X, Sheff MA, Simpson DM, et al. (2011) Ste11p MEKK signals through HOG, mating, calcineurin and PKC pathways to regulate the FKS2 gene. BMC Mol Biol 12: 51. doi: 10.1186/1471-2199-12-51
![]() |
[270] |
Serrano R, Ruiz A, Bernal D, et al. (2002) The transcriptional response to alkaline pH in Saccharomyces cerevisiae: evidence for calcium-mediated signalling. Mol Microbiol 46: 1319-1333. doi: 10.1046/j.1365-2958.2002.03246.x
![]() |
[271] |
Lavina WA, Hermansyah, Sugiyama M, et al. (2013) Functionally redundant protein phosphatase genes PTP2 and MSG5 co-regulate the calcium signaling pathway in Saccharomyces cerevisiae upon exposure to high extracellular calcium concentration. J Biosci Bioeng 115: 138-146. doi: 10.1016/j.jbiosc.2012.08.022
![]() |
[272] |
Lagorce A, Hauser NC, Labourdette D, et al. (2003) Genome-wide analysis of the response to cell wall mutations in the yeast Saccharomyces cerevisiae. J Biol Chem 278: 20345-20357. doi: 10.1074/jbc.M211604200
![]() |
[273] |
Colabardini AC, Ries LN, Brown NA, et al. (2014) Protein kinase C overexpression suppresses calcineurin-associated defects in Aspergillus nidulans and is involved in mitochondrial function. PLoS One 9: e104792. doi: 10.1371/journal.pone.0104792
![]() |
[274] |
Teepe AG, Loprete DM, He Z, et al. (2007) The protein kinase C orthologue PkcA plays a role in cell wall integrity and polarized growth in Aspergillus nidulans. Fungal Genet Biol 44: 554-562. doi: 10.1016/j.fgb.2006.10.001
![]() |
[275] |
Herrmann M, Sprote P, Brakhage AA (2006) Protein kinase C (PkcA) of Aspergillus nidulans is involved in penicillin production. Appl Environ Microbiol 72: 2957-2970. doi: 10.1128/AEM.72.4.2957-2970.2006
![]() |
[276] |
Ichinomiya M, Uchida H, Koshi Y, et al. (2007) A protein kinase C-encoding gene, pkcA, is essential to the viability of the filamentous fungus Aspergillus nidulans. Biosci Biotechnol Biochem 71: 2787-2799. doi: 10.1271/bbb.70409
![]() |
[277] |
Ronen R, Sharon H, Levdansky E, et al. (2007) The Aspergillus nidulans pkcA gene is involved in polarized growth, morphogenesis and maintenance of cell wall integrity. Curr Genet 51: 321-329. doi: 10.1007/s00294-007-0129-y
![]() |
[278] |
Colabardini AC, De Castro PA, De Gouvea PF, et al. (2010) Involvement of the Aspergillus nidulans protein kinase C with farnesol tolerance is related to the unfolded protein response. Mol Microbiol 78: 1259-1279. doi: 10.1111/j.1365-2958.2010.07403.x
![]() |
[279] |
Katayama T, Uchida H, Ohta A, et al. (2012) Involvement of protein kinase C in the suppression of apoptosis and in polarity establishment in Aspergillus nidulans under conditions of heat stress. PLoS One 7: e50503. doi: 10.1371/journal.pone.0050503
![]() |
[280] |
Schumacher J, Viaud M, Simon A, et al. (2008) The Galpha subunit BCG1, the phospholipase C (BcPLC1) and the calcineurin phosphatase co-ordinately regulate gene expression in the grey mould fungus Botrytis cinerea. Mol Microbiol 67: 1027-1050. doi: 10.1111/j.1365-2958.2008.06105.x
![]() |
[281] |
Lev S, Desmarini D, Li C, et al. (2013) Phospholipase C of Cryptococcus neoformans regulates homeostasis and virulence by providing inositol trisphosphate as a substrate for Arg1 kinase. Infect Immun 81: 1245-1255. doi: 10.1128/IAI.01421-12
![]() |
[282] |
Galagan JE, Calvo SE, Borkovich KA, et al. (2003) The genome sequence of the filamentous fungus Neurospora crassa. Nature 422: 859-868. doi: 10.1038/nature01554
![]() |
[283] |
Borkovich KA, Alex LA, Yarden O, et al. (2004) Lessons from the genome sequence of Neurospora crassa: tracing the path from genomic blueprint to multicellular organism. Microbiol Mol Biol Rev 68: 1-108. doi: 10.1128/MMBR.68.1.1-108.2004
![]() |
[284] |
Silverman-Gavrila LB, Lew RR (2002) An IP3-activated Ca2+ channel regulates fungal tip growth. J Cell Sci 115: 5013-5025. doi: 10.1242/jcs.00180
![]() |
[285] |
Silverman-Gavrila LB, Lew RR (2003) Calcium gradient dependence of Neurospora crassa hyphal growth. Microbiology 149: 2475-2485. doi: 10.1099/mic.0.26302-0
![]() |
[286] |
Silverman-Gavrila LB, Lew RR (2001) Regulation of the tip-high [Ca2+] gradient in growing hyphae of the fungus Neurospora crassa. Eur J Cell Biol 80: 379-390. doi: 10.1078/0171-9335-00175
![]() |
[287] |
Rho HS, Jeon J, Lee YH (2009) Phospholipase C-mediated calcium signalling is required for fungal development and pathogenicity in Magnaporthe oryzae. Mol Plant Pathol 10: 337-346. doi: 10.1111/j.1364-3703.2009.00536.x
![]() |
[288] |
Choi J, Kim KS, Rho HS, et al. (2011) Differential roles of the phospholipase C genes in fungal development and pathogenicity of Magnaporthe oryzae. Fungal Genet Biol 48: 445-455. doi: 10.1016/j.fgb.2011.01.001
![]() |
[289] |
Flick JS, Thorner J (1993) Genetic and biochemical characterization of a phosphatidylinositol-specific phospholipase C in Saccharomyces cerevisiae. Mol Cell Biol 13: 5861-5876. doi: 10.1128/MCB.13.9.5861
![]() |
[290] |
Payne W, Fitzgerald-Hayes M (1993) A mutation in PLC1, a candidate phosphoinositide-specific phospholipase C gene from Saccharomyces cerevisiae, causes aberrant mitotic chromosome segregation. Mol Cell Biol 13: 4351-4364. doi: 10.1128/MCB.13.7.4351
![]() |
[291] | DeLillo N, Romero C, Lin H, et al. (2003) Genetic evidence for a role of phospholipase C at the budding yeast kinetochore. Mol Genet Genomics 269: 261-270. |
[292] |
Jun Y, Fratti R, Wickner W (2004) Diacylglycerol and its formation by phospholipase C regulate Rab- and SNARE-dependent yeast vacuole fusion. J Biol Chem 279: 53186-53195. doi: 10.1074/jbc.M411363200
![]() |
[293] |
Banfic H, Bedalov A, York JD, et al. (2013) Inositol pyrophosphates modulate S phase progression after pheromone-induced arrest in Saccharomyces cerevisiae. J Biol Chem 288: 1717-1725. doi: 10.1074/jbc.M112.412288
![]() |
[294] |
Coccetti P, Tisi R, Martegani E, et al. (1998) The PLC1 encoded phospholipase C in the yeast Saccharomyces cerevisiae is essential for glucose-induced phosphatidylinositol turnover and activation of plasma membrane H+-ATPase. Biochim Biophys Acta 1405: 147-154. doi: 10.1016/S0167-4889(98)00099-8
![]() |
[295] |
Nakajima-Shimada J, Iida H, Tsuji F, et al. (1991) Monitoring of intracellular calcium in Saccharomyces cerevisiae with an apoaequorin cDNA expression system. Proc Natl Acad Sci U S A 88: 6878-6882. doi: 10.1073/pnas.88.15.6878
![]() |
[296] |
Tisi R, Belotti F, Wera S, et al. (2004) Evidence for inositol triphosphate as a second messenger for glucose-induced calcium signalling in budding yeast. Curr Genet 45: 83-89. doi: 10.1007/s00294-003-0465-5
![]() |
[297] |
Cavero S, Traba J, Del Arco A, et al. (2005) The calcium-dependent ATP-Mg/Pi mitochondrial carrier is a target of glucose-induced calcium signalling in Saccharomyces cerevisiae. Biochem J. 392: 537-544. doi: 10.1042/BJ20050806
![]() |
[298] |
Bergsma J, Kasri N, Donaton M, et al. (2001) PtdIns(4,5)P(2) and phospholipase C-independent Ins(1,4,5)P(3) signals induced by a nitrogen source in nitrogen-starved yeast cells. Biochem J 359: 517-523. doi: 10.1042/bj3590517
![]() |
[299] |
Guillas I, Vernay A, Vitagliano JJ, et al. (2013) Phosphatidylinositol 4,5-bisphosphate is required for invasive growth in Saccharomyces cerevisiae. J Cell Sci 126: 3602-3614. doi: 10.1242/jcs.122606
![]() |
[300] | Rebecchi MJ, Pentyala SN (2000) Structure, function, and control of phosphoinositide-specific phospholipase C. Physiol Rev 80: 1291-1335. |
[301] | Guiney EL, Goldman AR, Elias JE, et al. (2014) Calcineurin regulates the yeast synaptojanin Inp53/Sjl3 during membrane stress. Mol Biol Cell 26: 769-785. |
[302] |
Ron D, Walter P (2007) Signal integration in the endoplasmic reticulum unfolded protein response. Nat Rev Mol Cell Biol 8: 519-529. doi: 10.1038/nrm2199
![]() |
[303] |
Mori K (2009) Signalling pathways in the unfolded protein response: development from yeast to mammals. J Biochem 146: 743-750. doi: 10.1093/jb/mvp166
![]() |
[304] |
Chen Y, Feldman DE, Deng C, et al. (2005) Identification of mitogen-activated protein kinase signaling pathways that confer resistance to endoplasmic reticulum stress in Saccharomyces cerevisiae. Mol Cancer Res 3: 669-677. doi: 10.1158/1541-7786.MCR-05-0181
![]() |
[305] |
Nikawa J, Yamashita S (1992) IRE1 encodes a putative protein kinase containing a membrane-spanning domain and is required for inositol phototrophy in Saccharomyces cerevisiae. Mol Microbiol 6: 1441-1446. doi: 10.1111/j.1365-2958.1992.tb00864.x
![]() |
[306] |
Nikawa J, Akiyoshi M, Hirata S, et al. (1996) Saccharomyces cerevisiae IRE2/HAC1 is involved in IRE1-mediated KAR2 expression. Nucleic Acids Res 24: 4222-4226. doi: 10.1093/nar/24.21.4222
![]() |
[307] |
Kim H, Kim A, Cunningham KW (2012) Vacuolar H+-ATPase (V-ATPase) promotes vacuolar membrane permeabilization and nonapoptotic death in stressed yeast. J Biol Chem 287: 19029-19039. doi: 10.1074/jbc.M112.363390
![]() |
[308] |
Kajiwara K, Muneoka T, Watanabe Y, et al. (2012) Perturbation of sphingolipid metabolism induces endoplasmic reticulum stress-mediated mitochondrial apoptosis in budding yeast. Mol Microbiol 86: 1246-1261. doi: 10.1111/mmi.12056
![]() |
[309] |
van Meer G, Voelker DR, Feigenson GW (2008) Membrane lipids: where they are and how they behave. Nat Rev Mol Cell Biol 9: 112-124. doi: 10.1038/nrm2330
![]() |
[310] |
Hannun YA, Obeid LM (2008) Principles of bioactive lipid signalling: lessons from sphingolipids. Nat Rev Mol Cell Biol 9: 139-150. doi: 10.1038/nrm2329
![]() |
[311] |
Jayaraman T, Marks AR (2000) Calcineurin is downstream of the inositol 1,4,5-trisphosphate receptor in the apoptotic and cell growth pathways. J Biol Chem 275: 6417-6420. doi: 10.1074/jbc.275.9.6417
![]() |
[312] |
Perrone GG, Tan SX, Dawes IW (2008) Reactive oxygen species and yeast apoptosis. Biochim Biophys Acta 1783: 1354-1368. doi: 10.1016/j.bbamcr.2008.01.023
![]() |
[313] |
Schroder M (2008) Engineering eukaryotic protein factories. Biotechnol Lett 30: 187-196. doi: 10.1007/s10529-007-9524-1
![]() |
[314] |
Giorgi C, De Stefani D, Bononi A, et al. (2009) Structural and functional link between the mitochondrial network and the endoplasmic reticulum. Int J Biochem Cell Biol 41: 1817-1827. doi: 10.1016/j.biocel.2009.04.010
![]() |
[315] |
Cebulski J, Malouin J, Pinches N, et al. (2011) Yeast Bax inhibitor, Bxi1p, is an ER-localized protein that links the unfolded protein response and programmed cell death in Saccharomyces cerevisiae. PLoS One 6: e20882. doi: 10.1371/journal.pone.0020882
![]() |
[316] |
Alby K, Schaefer D, Sherwood RK, et al. (2010) Identification of a cell death pathway in Candida albicans during the response to pheromone. Eukaryot Cell 9: 1690-1701. doi: 10.1128/EC.00155-10
![]() |
[317] |
Lu H, Zhu Z, Dong L, et al. (2011) Lack of trehalose accelerates H2O2-induced Candida albicans apoptosis through regulating Ca2+ signaling pathway and caspase activity. PLoS One 6: e15808. doi: 10.1371/journal.pone.0015808
![]() |
[318] |
Hwang JH, Choi H, Kim AR, et al. (2014) Hibicuslide C-induced cell death in Candida albicans involves apoptosis mechanism. J Appl Microbiol 117: 1400-1411. doi: 10.1111/jam.12633
![]() |
[319] |
Gupta S, Ton V, Beaudry V, et al. (2003) Antifungal activity of amiodarone is mediated by disruption of calcium homeostasis. J Biol Chem 278: 28831-28839. doi: 10.1074/jbc.M303300200
![]() |
[320] |
Pozniakovsky AI, Knorre DA, Markova OV, et al. (2005) Role of mitochondria in the pheromone- and amiodarone-induced programmed death of yeast. J Cell Biol 168: 257-269. doi: 10.1083/jcb.200408145
![]() |
[321] | Zheng K, Pan J, Ye L, et al. (2007) Programmed cell death-involved aluminum toxicity in yeast alleviated by antiapoptotic members with decreased calcium signals. Plant Physiol 143: 38-49. |
[322] |
Pereira C, Silva RD, Saraiva L, et al. (2008) Mitochondria-dependent apoptosis in yeast. Biochim Biophys Acta 1783: 1286-1302. doi: 10.1016/j.bbamcr.2008.03.010
![]() |
[323] | Lauff DB, Santa-Maria GE (2010) Potassium deprivation is sufficient to induce a cell death program in Saccharomyces cerevisiae. FEMS Yeast Res 10: 497-507. |
[324] |
Gunter TE, Sheu SS (2009) Characteristics and possible functions of mitochondrial Ca2+ transport mechanisms. Biochim Biophys Acta 1787: 1291-1308. doi: 10.1016/j.bbabio.2008.12.011
![]() |
[325] |
Chinopoulos C, Adam-Vizi V (2010) Mitochondrial Ca2+ sequestration and precipitation revisited. FEBS J 277: 3637-3651. doi: 10.1111/j.1742-4658.2010.07755.x
![]() |
[326] |
Williams GS, Boyman L, Chikando AC, et al. (2013) Mitochondrial calcium uptake. Proc Natl Acad Sci U S A 110: 10479-10486. doi: 10.1073/pnas.1300410110
![]() |
[327] |
Virag A, Harris SD (2006) The Spitzenkorper: a molecular perspective. Mycol Res 110: 4-13. doi: 10.1016/j.mycres.2005.09.005
![]() |
[328] |
Muend S, Rao R (2008) Fungicidal activity of amiodarone is tightly coupled to calcium influx. FEMS Yeast Res 8: 425-431. doi: 10.1111/j.1567-1364.2008.00354.x
![]() |
[329] |
Roberts SK, McAinsh M, Widdicks L (2012) Cch1p mediates Ca2+ influx to protect Saccharomyces cerevisiae against eugenol toxicity. PLoS One 7: e43989. doi: 10.1371/journal.pone.0043989
![]() |
[330] |
Imura A, Tsuji Y, Murata M, et al. (2007) ��-Klotho as a Regulator of Calcium Homeostasis. Science 316: 1615-1618. doi: 10.1126/science.1135901
![]() |
[331] | Yokoyama H, Mizunuma M, Okamoto M, et al. (2006) Involvement of calcineurin-dependent degradation of Yap1p in Ca2+-induced G2 cell-cycle regulation in Saccharomyces cerevisiae. EMBO Rep 7: 519-524. |
[332] |
Tsubakiyama R, Mizunuma M, Gengyo A, et al. (2011) Implication of Ca2+ in the regulation of replicative life span of budding yeast. J Biol Chem 286: 28681-28687. doi: 10.1074/jbc.M111.231415
![]() |
[333] |
Maeta K, Izawa S, Inoue Y (2005) Methylglyoxal, a metabolite derived from glycolysis, functions as a signal initiator of the high osmolarity glycerol-mitogen-activated protein kinase cascade and calcineurin/Crz1-mediated pathway in Saccharomyces cerevisiae. J Biol Chem 280: 253-260. doi: 10.1074/jbc.M408061200
![]() |
[334] | Shitamukai A, Hirata D, Sonobe S, et al. (2004) Evidence for antagonistic regulation of cell growth by the calcineurin and high osmolarity glycerol pathways in Saccharomyces cerevisiae. J Biol Chem 279: 3651-3661. |
[335] |
Kullas AL, Martin SJ, Davis D (2007) Adaptation to environmental pH: integrating the Rim101 and calcineurin signal transduction pathways. Mol Microbiol 66: 858-871. doi: 10.1111/j.1365-2958.2007.05929.x
![]() |
[336] |
Lengeler KB, Davidson RC, D'Souza C, et al. (2000) Signal transduction cascades regulating fungal development and virulence. Microbiol Mol Biol Rev 64: 746-785. doi: 10.1128/MMBR.64.4.746-785.2000
![]() |
[337] |
Marchetti O, Entenza JM, Sanglard D, et al. (2000) Fluconazole plus cyclosporine: a fungicidal combination effective against experimental endocarditis due to Candida albicans. Antimicrob Agents Chemother 44: 2932-2938. doi: 10.1128/AAC.44.11.2932-2938.2000
![]() |
[338] |
Marchetti O, Moreillon P, Glauser MP, et al. (2000) Potent synergism of the combination of fluconazole and cyclosporine in Candida albicans. Antimicrob Agents Chemother 44: 2373-2381. doi: 10.1128/AAC.44.9.2373-2381.2000
![]() |
[339] |
Reedy JL, Filler SG, Heitman J (2010) Elucidating the Candida albicans calcineurin signaling cascade controlling stress response and virulence. Fungal Genet Biol 47: 107-116. doi: 10.1016/j.fgb.2009.09.002
![]() |
[340] |
Miyazaki T, Yamauchi S, Inamine T, et al. (2010) Roles of calcineurin and Crz1 in antifungal susceptibility and virulence of Candida glabrata. Antimicrob Agents Chemother 54: 1639-1643. doi: 10.1128/AAC.01364-09
![]() |
[341] |
Seider K, Gerwien F, Kasper L, et al. (2014) Immune evasion, stress resistance, and efficient nutrient acquisition are crucial for intracellular survival of Candida glabrata within macrophages. Eukaryot Cell 13: 170-183. doi: 10.1128/EC.00262-13
![]() |
[342] |
Odom A, Muir S, Lim E, et al. (1997) Calcineurin is required for virulence of Cryptococcus neoformans. EMBO J 16: 2576-2589. doi: 10.1093/emboj/16.10.2576
![]() |
[343] |
Liu S, Hou Y, Liu W, et al. (2015) Components of the calcium-calcineurin signaling pathway in fungal cells and their potential as antifungal targets. Eukaryot Cell 14: 324-334. doi: 10.1128/EC.00271-14
![]() |
[344] | Blankenship JR, Steinbach WJ, Perfect JR, et al. (2003) Teaching old drugs new tricks: reincarnating immunosuppressants as antifungal drugs. Curr Opin Investig Drugs 4: 192-199. |
[345] |
Cruz MC, Del Poeta M, Wang P, et al. (2000) Immunosuppressive and nonimmunosuppressive cyclosporine analogs are toxic to the opportunistic fungal pathogen Cryptococcus neoformans via cyclophilin-dependent inhibition of calcineurin. Antimicrob Agents Chemother 44: 143-149. doi: 10.1128/AAC.44.1.143-149.2000
![]() |
[346] |
Cruz MC, Goldstein AL, Blankenship J, et al. (2001) Rapamycin and less immunosuppressive analogs are toxic to Candida albicans and Cryptococcus neoformans via FKBP12-dependent inhibition of TOR. Antimicrob Agents Chemother 45: 3162-3170. doi: 10.1128/AAC.45.11.3162-3170.2001
![]() |
[347] |
Rodr��guez A, Roy J, Mart��nez-Mart��nez S, et al. (2009) A conserved docking surface on calcineurin mediates interaction with substrates and immunosuppressants. Mol Cell 33: 616-626. doi: 10.1016/j.molcel.2009.01.030
![]() |
[348] |
Edlind T, Smith L, Henry K, et al. (2002) Antifungal activity in Saccharomyces cerevisiae is modulated by calcium signalling. Mol Microbiol 46: 257-268. doi: 10.1046/j.1365-2958.2002.03165.x
![]() |
[349] |
Maesaki S, Marichal P, Hossain MA, et al. (1998) Synergic effects of tactolimus and azole antifungal agents against azole-resistant Candida albicans strains. J Antimicrob Chemother 42: 747-753. doi: 10.1093/jac/42.6.747
![]() |
[350] |
Steinbach WJ, Schell WA, Blankenship JR, et al. (2004) In vitro interactions between antifungals and immunosuppressants against Aspergillus fumigatus. Antimicrob Agents Chemother 48: 1664-1669. doi: 10.1128/AAC.48.5.1664-1669.2004
![]() |
[351] |
Schumacher J, de Larrinoa IF, Tudzynski B (2008) Calcineurin-responsive zinc finger transcription factor CRZ1 of Botrytis cinerea is required for growth, development, and full virulence on bean plants. Eukaryot Cell 7: 584-601. doi: 10.1128/EC.00426-07
![]() |
[352] |
Onyewu C, Wormley FL Jr, Perfect JR, et al. (2004) The calcineurin target, Crz1, functions in azole tolerance but is not required for virulence of Candida albicans. Infect Immun 72: 7330-7333. doi: 10.1128/IAI.72.12.7330-7333.2004
![]() |
[353] | Nakamura T, Takahashi H (2006) Epidemiological study of Candida infections in blood: susceptibilities of Candida spp. to antifungal agents, and clinical features associated with the candidemia. J Infect Chemother 12: 132-138. |
[354] | Rogers TR (2002) Antifungal drug resistance: does it matter? Int J Infect Dis 6: S47-53. |
[355] | Berman J, Sudbery PE (2002) Candida albicans: a molecular revolution built on lessons from budding yeast. Nat Rev Genet 3: 918-930. |
[356] |
Lopez-Ribot JL (2005) Candida albicans biofilms: more than filamentation. Curr Biol 15: R453-455. doi: 10.1016/j.cub.2005.06.020
![]() |
[357] | Lo HJ, K?hler JR, DiDomenico B, et al. (1997) Nonfilamentous C. albicans mutants are avirulent. Cell 90: 939-949. |
[358] |
Douglas LJ (2003) Candida biofilms and their role in infection. Trends Microbiol 11: 30-36. doi: 10.1016/S0966-842X(02)00002-1
![]() |
[359] | Hawser SP, Douglas LJ (1994) Biofilm formation by Candida species on the surface of catheter materials in vitro. Infect Immun 62: 915-921. |
[360] |
Liu H (2001) Transcriptional control of dimorphism in Candida albicans. Curr Opin Microbiol 4: 728-735. doi: 10.1016/S1369-5274(01)00275-2
![]() |
[361] |
Nobile CJ, Fox EP, Nett JE, et al. (2012) A recently evolved transcriptional network controls biofilm development in Candida albicans. Cell 148: 126-138. doi: 10.1016/j.cell.2011.10.048
![]() |
[362] |
Brown AJ, Gow NA (1999) Regulatory networks controlling Candida albicans morphogenesis. Trends Microbiol 7: 333-338. doi: 10.1016/S0966-842X(99)01556-5
![]() |
[363] |
Sabie FT, Gadd GM (1989) Involvement of a Ca2+-calmodulin interaction in the yeast-mycelial (Y-M) transition of Candida albicans. Mycopathologia 108: 47-54. doi: 10.1007/BF00436783
![]() |
[364] |
Blankenship JR, Wormley FL, Boyce MK, et al. (2003) Calcineurin is essential for Candida albicans survival in serum and virulence. Eukaryot Cell 2: 422-430. doi: 10.1128/EC.2.3.422-430.2003
![]() |
[365] |
Blankenship JR, Heitman J (2005) Calcineurin is required for Candida albicans to survive calcium stress in serum. Infect Immun 73: 5767-5774. doi: 10.1128/IAI.73.9.5767-5774.2005
![]() |
[366] |
Sanglard D, Ischer F, Marchetti O, et al. (2003) Calcineurin A of Candida albicans: involvement in antifungal tolerance, cell morphogenesis and virulence. Mol Microbiol 48: 959-976. doi: 10.1046/j.1365-2958.2003.03495.x
![]() |
[367] |
Onyewu C, Blankenship JR, Del Poeta M, et al. (2003) Ergosterol biosynthesis inhibitors become fungicidal when combined with calcineurin inhibitors against Candida albicans, Candida glabrata, and Candida krusei. Antimicrob Agents Chemother 47: 956-964. doi: 10.1128/AAC.47.3.956-964.2003
![]() |
[368] |
Riscili BP, Wood KL (2009) Noninvasive pulmonary Aspergillus infections. Clin Chest Med 30: 315-335, vii. doi: 10.1016/j.ccm.2009.02.008
![]() |
[369] |
Lelievre L, Groh M, Angebault C, et al. (2013) Azole resistant Aspergillus fumigatus: an emerging problem. Med Mal Infect 43: 139-145. doi: 10.1016/j.medmal.2013.02.010
![]() |
[370] |
Denning DW, Perlin DS (2011) Azole resistance in Aspergillus: a growing public health menace. Future Microbiol 6: 1229-1232. doi: 10.2217/fmb.11.118
![]() |
[371] |
Todd RB, Davis MA, Hynes MJ (2007) Genetic manipulation of Aspergillus nidulans: heterokaryons and diploids for dominance, complementation and haploidization analyses. Nat Protoc 2: 822-830. doi: 10.1038/nprot.2007.113
![]() |
[372] |
Todd RB, Davis MA, Hynes MJ (2007) Genetic manipulation of Aspergillus nidulans: meiotic progeny for genetic analysis and strain construction. Nat Protoc 2: 811-821. doi: 10.1038/nprot.2007.112
![]() |
[373] |
Srikanta D, Santiago-Tirado FH, Doering TL (2014) Cryptococcus neoformans: historical curiosity to modern pathogen. Yeast 31: 47-60. doi: 10.1002/yea.2997
![]() |
[374] |
Perfect JR, Casadevall A (2002) Cryptococcosis. Infect Dis Clin North Am 16: 837-874. doi: 10.1016/S0891-5520(02)00036-3
![]() |
[375] |
Steenbergen JN, Casadevall A (2003) The origin and maintenance of virulence for the human pathogenic fungus Cryptococcus neoformans. Microbes Infect 5: 667-675. doi: 10.1016/S1286-4579(03)00092-3
![]() |
[376] |
Brown SM, Campbell LT, Lodge JK (2007) Cryptococcus neoformans, a fungus under stress. Curr Opin Microbiol 10: 320-325. doi: 10.1016/j.mib.2007.05.014
![]() |
[377] |
Bahn YS, Jung KW (2013) Stress signaling pathways for the pathogenicity of Cryptococcus. Eukaryot Cell 12: 1564-1577. doi: 10.1128/EC.00218-13
![]() |
[378] |
Fox DS, Cruz MC, Sia RA, et al. (2001) Calcineurin regulatory subunit is essential for virulence and mediates interactions with FKBP12-FK506 in Cryptococcus neoformans. Mol Microbiol 39: 835-849. doi: 10.1046/j.1365-2958.2001.02295.x
![]() |
[379] |
Kozubowski L, Aboobakar EF, Cardenas ME, et al. (2011) Calcineurin colocalizes with P-bodies and stress granules during thermal stress in Cryptococcus neoformans. Eukaryot Cell 10: 1396-1402. doi: 10.1128/EC.05087-11
![]() |
[380] |
Cruz MC, Fox DS, Heitman J (2001) Calcineurin is required for hyphal elongation during mating and haploid fruiting in Cryptococcus neoformans. EMBO J 20: 1020-1032. doi: 10.1093/emboj/20.5.1020
![]() |
[381] |
Fox DS, Heitman J (2002) Good fungi gone bad: the corruption of calcineurin. Bioessays 24: 894-903. doi: 10.1002/bies.10157
![]() |
[382] |
Kraus PR, Fox DS, Cox GM, et al. (2003) The Cryptococcus neoformans MAP kinase Mpk1 regulates cell integrity in response to antifungal drugs and loss of calcineurin function. Mol Microbiol 48: 1377-1387. doi: 10.1046/j.1365-2958.2003.03508.x
![]() |
[383] | Thompson JR, Douglas CM, Li W, et al. (1999) A glucan synthase FKS1 homolog in Cryptococcus neoformans is single copy and encodes an essential function. J Bacteriol 181: 444-453. |
[384] |
Juvvadi PR, Gehrke C, Fortwendel JR, et al. (2013) Phosphorylation of Calcineurin at a novel serine-proline rich region orchestrates hyphal growth and virulence in Aspergillus fumigatus. PLoS Pathog 9: e1003564. doi: 10.1371/journal.ppat.1003564
![]() |
[385] |
Bates S, MacCallum DM, Bertram G, et al. (2005) Candida albicans Pmr1p, a secretory pathway P-type Ca2+/Mn2+-ATPase, is required for glycosylation and virulence. J Biol Chem 280: 23408-23415. doi: 10.1074/jbc.M502162200
![]() |
[386] |
LaFayette SL, Collins C, Zaas AK, et al. (2010) PKC signaling regulates drug resistance of the fungal pathogen Candida albicans via circuitry comprised of Mkc1, calcineurin, and Hsp90. PLoS Pathog 6: e1001069. doi: 10.1371/journal.ppat.1001069
![]() |
[387] |
Yu Q, Ding X, Zhang B, et al. (2014) Inhibitory effect of verapamil on Candida albicans hyphal development, adhesion and gastrointestinal colonization. FEMS Yeast Res 14: 633-641. doi: 10.1111/1567-1364.12150
![]() |
[388] |
Ramage G, Wickes BL, Lopez-Ribot JL (2007) Inhibition on Candida albicans biofilm formation using divalent cation chelators (EDTA). Mycopathologia 164: 301-306. doi: 10.1007/s11046-007-9068-x
![]() |
[389] |
Raad II, Hachem RY, Hanna HA, et al. (2008) Role of ethylene diamine tetra-acetic acid (EDTA) in catheter lock solutions: EDTA enhances the antifungal activity of amphotericin B lipid complex against Candida embedded in biofilm. Int J Antimicrob Agents 32: 515-518. doi: 10.1016/j.ijantimicag.2008.06.020
![]() |
[390] |
Yu Q, Ding X, Xu N, et al. (2013) In vitro activity of verapamil alone and in combination with fluconazole or tunicamycin against Candida albicans biofilms. Int J Antimicrob Agents 41: 179-182. doi: 10.1016/j.ijantimicag.2012.10.009
![]() |
[391] |
Kmetzsch L, Staats CC, Cupertino JB, et al. (2013) The calcium transporter Pmc1 provides Ca2+ tolerance and influences the progression of murine cryptococcal infection. FEBS J 280: 4853-4864. doi: 10.1111/febs.12458
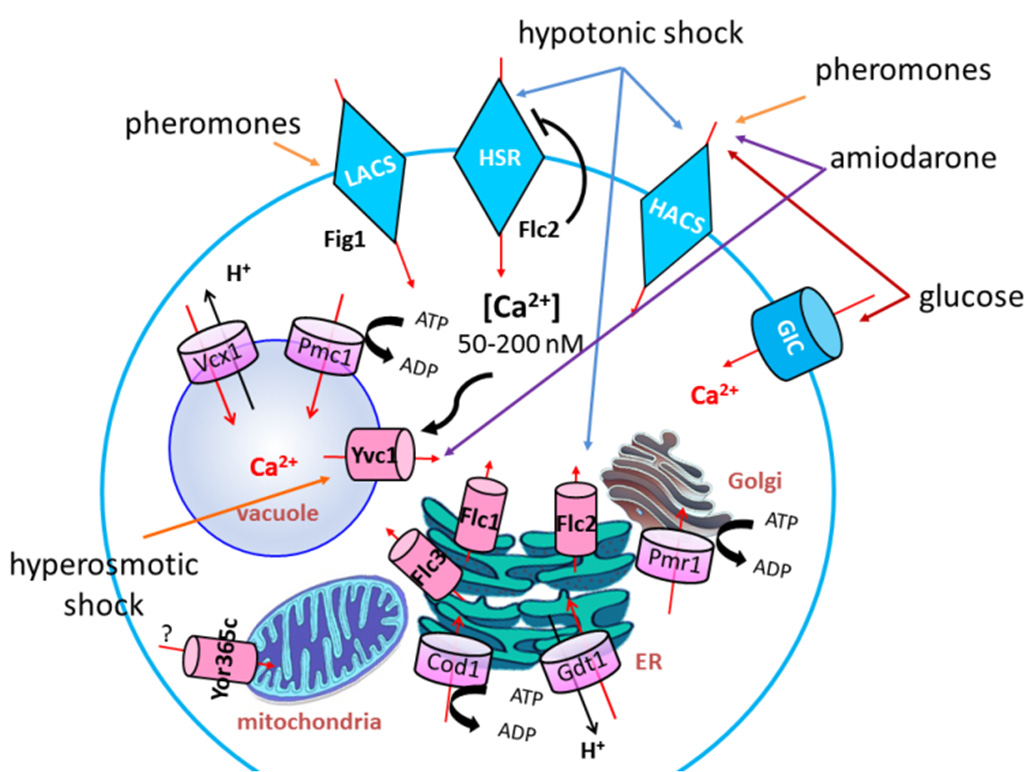
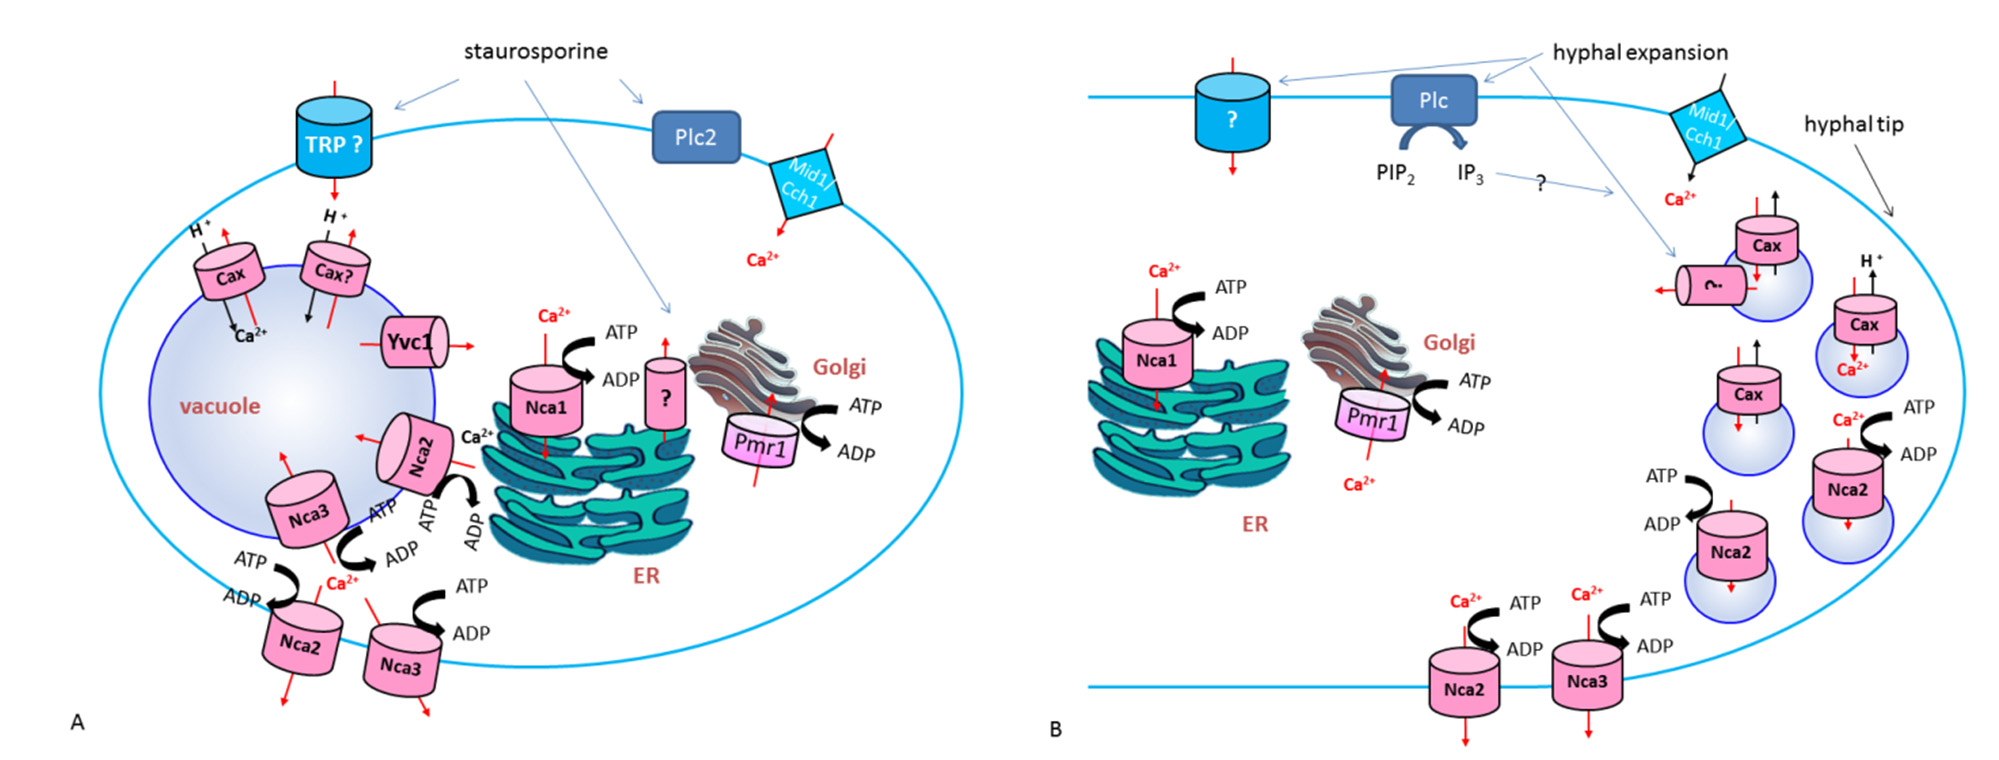
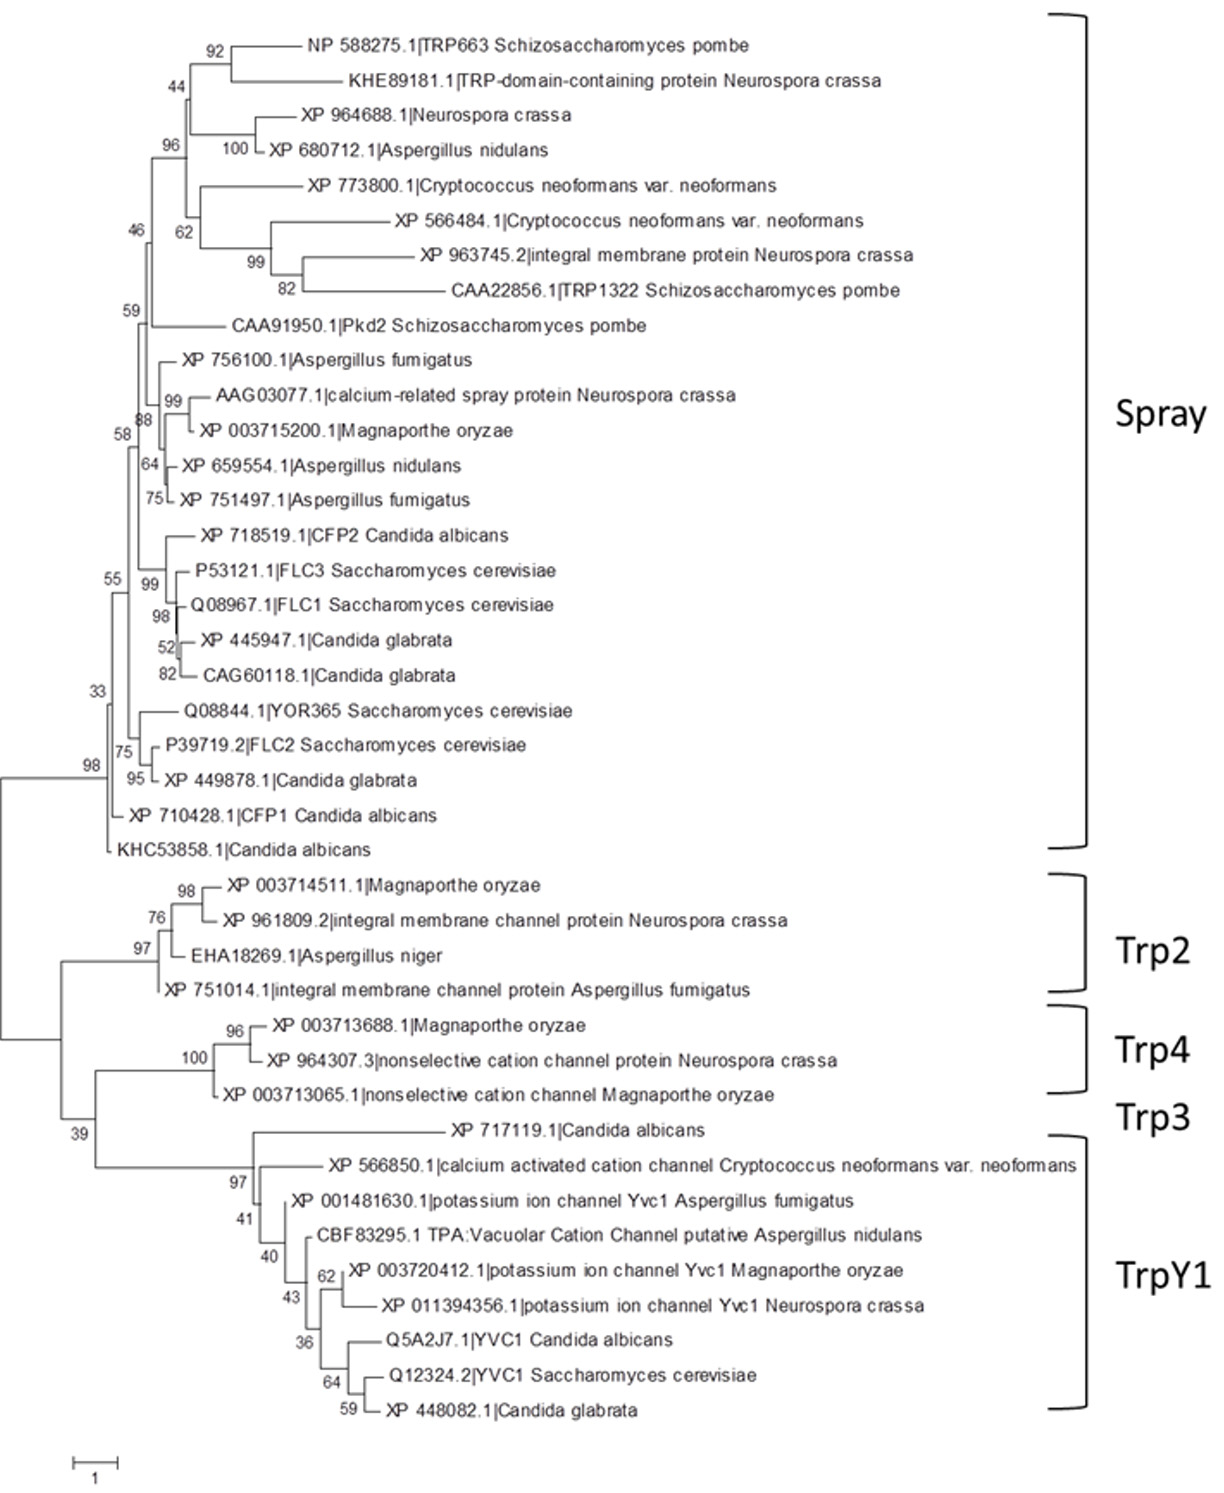
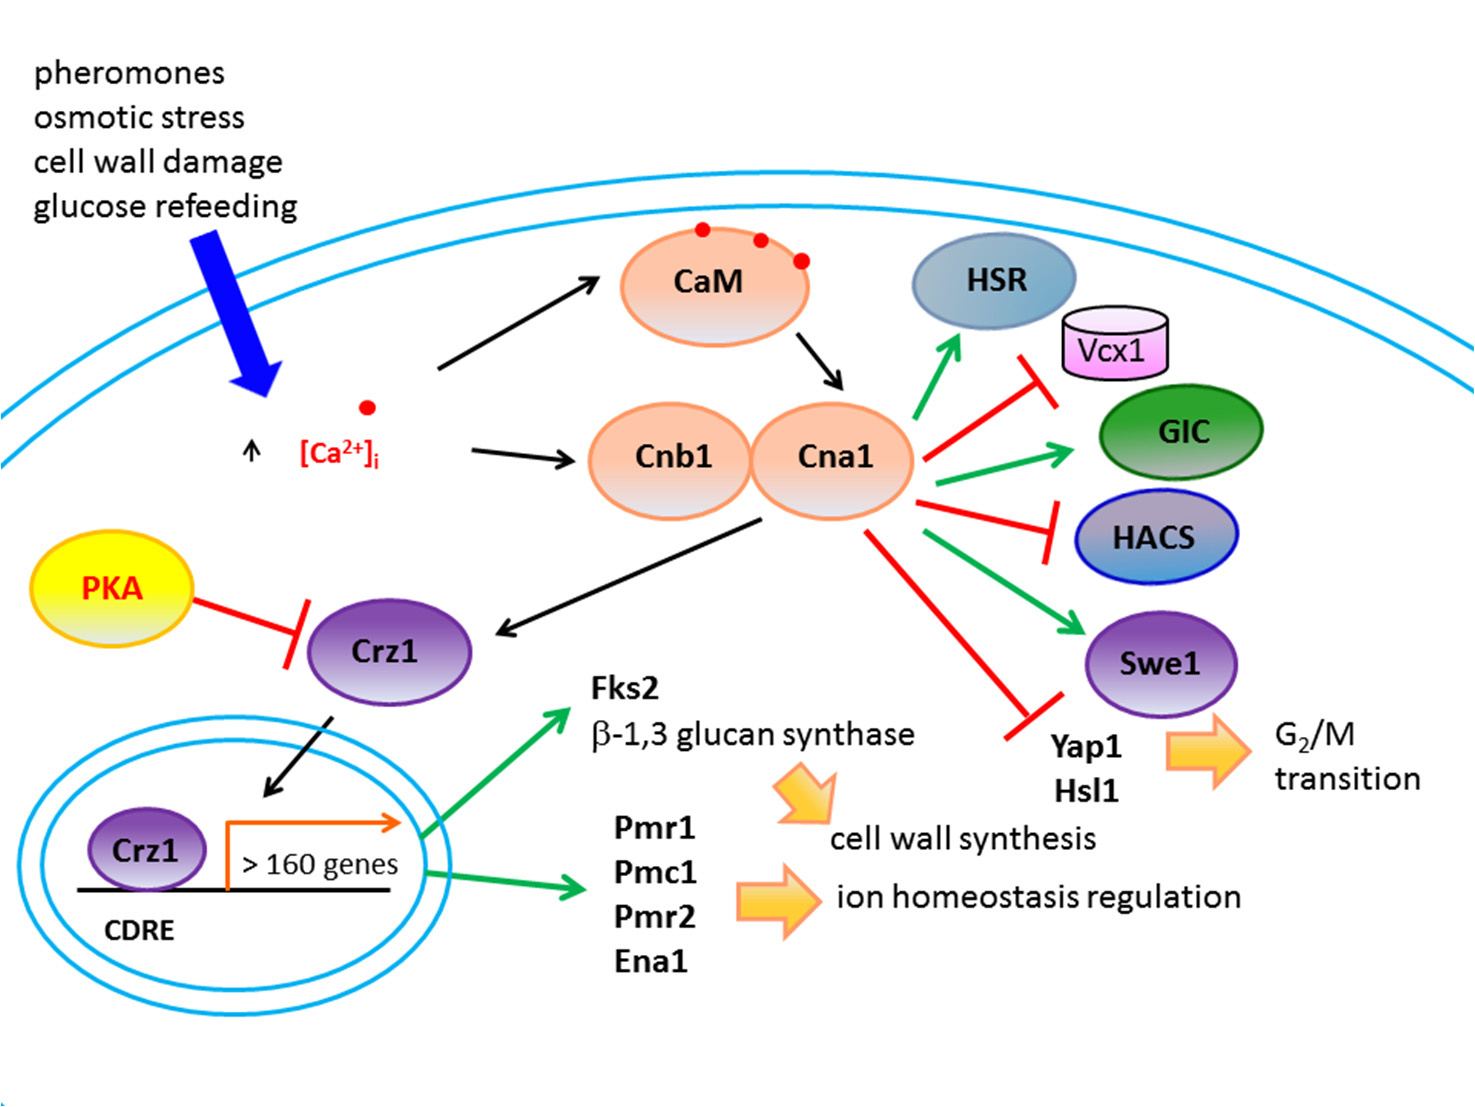
![]() |
1. | N.I. Yashina, O.I. Kashina, S.S. Petrov, N.N. Pronchatova-Rubtsova, Developing the methodology of early diagnosis of financial crises using a system of signaling economic indicators, 2020, 13, 20734484, 362, 10.24891/fa.13.4.362 | |
2. | Yue Liu, Hao Dong, Pierre Failler, The Oil Market Reactions to OPEC’s Announcements, 2019, 12, 1996-1073, 3238, 10.3390/en12173238 | |
3. | Lean Yu, Xiaowen Huang, Hang Yin, Can machine learning paradigm improve attribute noise problem in credit risk classification?, 2020, 70, 10590560, 440, 10.1016/j.iref.2020.08.016 | |
4. | Luís Almeida, Francisco Sousa, Determinants of bank profitability in Portugal: Insights from a period of sectoral transformation, 2025, 9, 2573-0134, 425, 10.3934/QFE.2025014 |
Output Variables -Loss Observation Segments | Input Variables -Macroeconomic Factors | |||||||||||||||||
Residential Real Estate | Commercial Real Estate | Consumer Credit | Commercial and Industrial | Real Gross Domestic Investment | Unemployment Rate | Commercial Real Estate Price Index | Baa 10 Year Corporate Bond Yield | CBOE Market Volatility Index | ||||||||||
Level | Change | Level | Change | Level | Change | Level | Change | Level | Change | Level | Change | Level | Change | Level | Change | Level | Change | |
Count | 60 | 59 | 60 | 59 | 60 | 59 | 60 | 59 | 60 | 59 | 60 | 59 | 60 | 59 | 60 | 59 | 60 | 59 |
Mean | 0.73 | 6.43% | 0.61 | 10.11 | 3.04 | 0.18% | 0.87 | 0.07% | 2.20 | -1.0% | 6.50 | 0.60% | 198.9 | 1.13% | 3.67 | 0.01% | 26.5 | 3.31% |
Std. Dev. | 0.794 | 40.7% | 0.82 | 70.9% | 1.22 | 11.3% | 0.686 | 20.2% | 3.65 | 6.0% | 1.70 | 6.99% | 37.57 | 4.19% | 0.97 | 9.87% | 12.2 | 31.9% |
Min. | 0.06 | -61.8% | 0.01 | -80.0% | 1.74 | -42.1% | 0.18 | -28.3% | -12.6 | -244% | 4.20 | -7.6% | 135.8 | -14.6% | 1.60 | -24.2% | 12.7 | -49.5% |
25th Prc. | 0.14 | -15% | 0.06 | -20% | 2.30 | -5.2% | 0.30 | -16% | 1.03 | -182% | 5.30 | -2.5% | 170.6 | 0.00% | 2.90 | -6.1% | 19.1 | -17.4% |
Median | 0.28 | -1.31% | 0.15 | -7.18% | 2.73 | -0.62% | 0.62 | -3.95% | 2.70 | 5.00% | 5.85 | -1.2% | 197.5 | 1.27% | 3.80 | 0.94% | 21.5 | -1.44% |
75t th Prc. | 1.38 | 11.5% | 0.95 | 17.6% | 3.17 | 7.4% | 1.34 | 13.6% | 3.40 | 263% | 7.85 | 1.07% | 233.1 | 3.85% | 4.40 | 5.41% | 30.9 | 7.36% |
Max. | 2.78 | 165% | 2.95 | 400.0% | 6.72 | 29.54% | 2.53 | 60.0% | 11.8 | 1640% | 9.90 | 38.1% | 258.9 | 9.81% | 5.40 | 35.00% | 80.9 | 111.5% |
Coef. Var. | 1.08 | 6.33 | 1.36 | 7.02 | 0.40 | 64.23 | 0.78 | 289.97 | 1.65 | 599.21 | 0.26 | 11.68 | 0.19 | 3.73 | 0.27 | 1283.59 | 0.46 | 9.64 |
Skewness | 1.04 | 2.09 | 1.45 | 3.39 | 1.52 | -0.50 | 0.92 | 0.80 | -1.20 | -1.05 | 0.71 | 3.31 | -0.04 | -1.65 | -0.4 | 0.3860 | 2.10 | 1.54 |
Kurtosis | -0.30 | 6.06 | 0.79 | 15.66 | 1.79 | 2.77 | -0.27 | 0.21 | 5.50 | 5.41 | -0.8 | 14.31 | -1.29 | 4.62 | -0.6 | 1.93 | 5.91 | 2.36 |
Real Gross Domestic Investment | Unemployment Rate | Commercial Real Estate Price Index | Baa 10 Year Corporate Bond Yield | CBOE Market Volatility Index | |||||||
Level | Change | Level | Change | Level | Change | Level | Change | Level | Change | ||
Real Gross Domestic Investment | Level | 1 | |||||||||
Change | -41.11% | 1 | |||||||||
Unemployment Rate | Level | -14.78% | -1.62% | 1 | |||||||
Change | -19.37% | -7.83% | 48.07% | 1 | |||||||
Commercial Real Estate Price Index | Level | 22.87% | 0.81% | -35.99% | -12.30% | 1 | |||||
Change | 2.20% | 8.95% | -24.43% | -43.00% | -42.18% | 1 | |||||
Baa 10 Year Corporate Bond Rate | Level | -21.46% | -1.55% | 30.03% | 67.07% | -21.74% | -6.88% | 1 | |||
Change | -1.81% | -9.31% | 31.66% | 11.13% | -38.29% | -34.33% | 18.27% | 1 | |||
CBOE Equity Market Volatility Index | Level | -17.81% | -7.71% | 36.50% | 49.28% | -64.27% | -25.93% | 20.57% | 15.35% | 1 | |
Change | -14.23% | -3.34% | -7.29% | 6.57% | -14.75% | -28.98% | 15.29% | 34.33% | 44.56% | 1 |
Residential Real Estate | Commercial Real Estate | Consumer Credit | Commercial and Industrial | ||||||
Level | Change | Level | Change | Level | Change | Level | Change | ||
Residential Real Estate | Level | 1 | |||||||
Change | 2.74% | 1 | |||||||
Commercial Real Estate | Level | 86.26% | 3.05% | 1 | |||||
Change | 6.25% | 16.51% | 2.22% | 1 | |||||
Consumer Credit | Level | 81.42% | 1.71% | 90.35% | 7.41% | 1 | |||
Change | 2.00% | 26.15% | 2.68% | 16.44% | 20.08% | 1 | |||
Commercial and Industrial | Level | 54.61% | 3.92% | 64.56% | -3.04% | 79.79% | 18.24% | 1 | |
Change | -2.81% | 15.49% | 0.37% | 19.19% | 0.1822% | 38.07% | 19.81% | 1 |
Residential Real Estate | Commercial Real Estate | Consumer Credit | Commercial and Industrial | ||||||
Level | Change | Level | Change | Level | Change | Level | Change | ||
Real Gross Domestic Investment | Level | -9.39% | -10.62% | -5.73% | -9.87% | -9.63% | -14.63% | -14.03% | -1.44% |
Change | -0.12% | 4.73% | -2.06% | -7.71% | -3.90% | 6.13% | -4.88% | -21.47% | |
Unemployment Rate | Level | 92.76% | 5.79% | 89.80% | -2.27% | 77.51% | 11.11% | 58.80% | 12.57% |
Change | 12.96% | 33.55% | -10.18% | 27.72% | 7.67% | 25.48% | 3.26% | 41.65% | |
Commercial Real Estate Price Index | Level | -26.31% | 45.18% | -33.98% | -15.42% | -54.65% | 44.23% | -79.65% | -48.00% |
Change | -4.00% | -5.50% | -0.11% | -11.47% | 2.57% | -10.03% | -5.19% | -1.24% | |
Baa 10 Year Corporate Bond Rate | Level | 31.90% | 11.26% | 25.65% | 5.62% | -8.32% | -15.36% | 19.16% | 5.36% |
Change | 23.67% | 17.36% | -27.77% | 13.18% | -28.35% | -10.77% | 31.62% | 35.73% | |
CBOE Equity Market Volatility Index | Level | 22.16% | 40.93% | 26.25% | 23.47% | 29.05% | 28.40% | 33.17% | 46.76% |
Change | 9.67% | 19.21% | 1.05% | 27.16% | 3.50% | 8.02% | 6.82% | 10.14% |
Stationarity Test | Levels | Percent Changes | |||
Test Statistic | P-Value | Test Statistic | P-Value | ||
Augmented Dickey-Fuller | Real Gross Domestic Investment | -3.8979 | 0.0202 | -3.8979 | 0.0202 |
Unemployment Rate | -2.1582 | 0.5108 | -2.3114 | 0.0224 | |
Commercial Real Estate Price Index | -2.0886 | 0.5390 | -3.0847 | 0.0455 | |
BBB 10 Year Corporate Bond Yield | -2.1872 | 0.4991 | -4.4104 | 0.0100 | |
CBOE Market Volatility Index | -2.3422 | 0.4365 | -5.1761 | 0.0100 | |
Residential Real Estate Loss Rate | -1.4057 | 0.8150 | -1.9883 | 0.0483 | |
Commercial Real Estate Loss Rate | -1.9643 | 0.5892 | -1.8584 | 0.0451 | |
Consumer Credit Loss Rate | -2.3685 | 0.4258 | -3.6123 | 0.0398 | |
Commercial and Industrial Loss Rate | -3.4832 | 0.0512 | -1.6232 | 0.0291 | |
Kwiatkowski–Phillips–Schmidt–Shin | Real Gross Domestic Investment | 0.6870 | 0.0023 | 0.0109 | 0.3166 |
Unemployment Rate | 0.4553 | 0.0091 | 0.1178 | 0.1971 | |
Commercial Real Estate Price Index | 0.3420 | 0.0014 | -0.2742 | 0.2741 | |
BBB 10 Year Corporate Bond Rate | 0.3813 | 0.0079 | -0.1303 | 0.2698 | |
CBOE Equity Market Volatility Index | 0.4507 | 0.0000 | 0.0139 | 0.1389 | |
Residential Real Estate Loss Rate | 0.4652 | 0.0014 | 0.1995 | 0.3581 | |
Commercial Real Estate Loss Rate | 0.2462 | 0.0021 | -0.1965 | 0.3374 | |
Consumer Credit Loss Rate | 0.4384 | 0.0065 | 0.0659 | 0.1207 | |
Commercial and Industrial Loss Rate | 0.4886 | 0.0098 | 0.0437 | 0.4992 |
Coefficient Estimates | P-Values | ||||||||
Statistic | Residential Real Estate | Commercial Real Estate | Consumer Credit | Commercial and Industrial | Residential Real Estate | Commercial Real Estate | Consumer Credit | Commercial and Industrial | |
Output Variables -Loss Observation Segments | Residential Real Estate | 0.6808 | 0.3765 | 0.0576 | 0.0055 | 0.00E+00 | 0.00E+00 | 0.00E+00 | 3.84E-02 |
Commercial Real Estate | 0.3510 | 0.5205 | 0.0950 | 0.0869 | 0.00E+00 | 0.00E+00 | 0.00E+00 | 1.17E-07 | |
Consumer Credit | 0.2225 | 0.5346 | 0.3772 | 0.3698 | 2.74E-11 | 0.00E+00 | 0.00E+00 | 0.00E+00 | |
Commercial and Industrial | 0.3370 | 0.2637 | 0.0054 | 0.7879 | 0.00E+00 | 0.00E+00 | 2.41E-02 | 0.00E+00 | |
Input Variables -Macroeconomic Factors | Real Gross Domestic Investment | -0.0156 | -0.0185 | -0.0339 | -0.0047 | 6.75E-04 | 1.32E-05 | 2.49E-02 | 2.14E-01 |
Unemployment Rate | 0.0215 | 0.0157 | 0.0598 | 0.0164 | 7.86E-10 | 5.19E-07 | 7.99E-04 | 7.73E-05 | |
Commercial Real Estate Price Index | -0.0006 | -0.0227 | -0.0063 | -0.0053 | 3.52E-04 | 0.00E+00 | 7.32E-11 | 0.00E+00 | |
BBB 10 Year Corporate Bond Rate | 0.0675 | 0.0226 | 0.2731 | 0.0676 | 0.00E+00 | 6.50E-13 | 0.00E+00 | 0.00E+00 | |
CBOE Equity Market Volatility Index | 0.0012 | 0.0118 | 0.0158 | 0.0118 | 5.24E-02 | 9.83E-13 | 2.07E-10 | 1.21E-11 | |
Model Performance Metrics | Log-Likelihood | -42.90 | |||||||
Root Mean Squared Error / Mean | 0.2609 | 0.3006 | 0.1016 | 0.2408 | |||||
Squared Correlation | 0.9397 | 0.9503 | 0.9352 | 0.9038 | |||||
Cumulative Percentage Error -Entire Sample | 4.126% | 4.794% | 3.913% | 5.714% | |||||
Cumulative Percentage Error -Recent Period | 5.158% | 5.565% | 6.673% | 3.995% | |||||
Cumulative Percentage Error -Downturn Period | -3.686% | -4.370% | -3.118% | -4.072% |
Coefficient Estimates | P-Values | ||||||||
Statistic | Residential Real Estate | Commercial Real Estate | Consumer Credit | Commercial and Industrial | Residential Real Estate | Commercial Real Estate | Consumer Credit | Commercial and Industrial | |
Output Variables -Loss Observation Segments | Residential Real Estate | 0.9641 | 0.0000 | ||||||
Commercial Real Estate | 0.9525 | 0.0000 | |||||||
Consumer Credit | 0.8774 | 0.0000 | |||||||
Commercial and Industrial | 0.8357 | 0.0000 | |||||||
Input Variables -Macroeconomic Factors | Real Gross Domestic Investment | -0.0085 | -0.0081 | -0.0299 | -0.0003 | 4.21E-02 | 4.57E-02 | 1.17E-02 | 4.84E-02 |
Unemployment Rate | 0.0135 | 0.0034 | 0.0318 | 0.0094 | 1.38E-03 | 2.21E-02 | 4.92E-04 | 2.82E-02 | |
Commercial Real Estate Price Index | -0.0003 | -0.0010 | -0.0028 | -0.0035 | 7.78E-08 | 9.72E-08 | 0.00E+00 | 1.11E-16 | |
BBB 10 Year Corporate Bond Rate | 0.0433 | 0.0130 | 0.1385 | 0.0468 | 0.00E+00 | 1.53E-09 | 0.00E+00 | 0.00E+00 | |
CBOE Equity Market Volatility Index | 0.0012 | 0.0035 | 0.0071 | 0.0068 | 4.35E-02 | 4.22E-05 | 3.34E-02 | 5.09E-12 | |
Model Performance Metric | Log-Likelihood | -11.00 | -11.91 | -34.81 | -5.33 | ||||
Log-Likelihood Ratio Statistic -VARMAX Null | 2.72 | 2.56 | 0.42 | 4.17 | 2.18E-11 | 9.55E-12 | 0.00E+00 | 6.69E-09 | |
Root Mean Squared Error / Mean | 0.3293 | 0.3923 | 0.2161 | 0.3100 | |||||
Squared Correlation | 0.8399 | 0.8470 | 0.7858 | 0.8037 | |||||
Cumulative Percentage Error -Entire Sample | 8.17% | 7.60% | -11.55% | -11.30% | |||||
Cumulative Percentage Error -Recent Period | 9.25% | 10.29% | -22.52% | -6.86% | |||||
Cumulative Percentage Error -Downturn Period | -10.33% | -8.46% | -27.76% | -8.34% |
Scenario | Statistic | Modeling Segment | Scenario | Modeling Segment | ||||||
Residential Real Estate | Commercial Real Estate | Consumer Credit | Commercial and Industrial | Residential Real Estate | Commercial Real Estate | Consumer Credit | Commercial and Industrial | |||
Fed Base | Mean | 0.2587 | 0.0930 | 1.8571 | 0.3512 | Fed Severely Adverse | 0.2743 | 0.2173 | 2.1794 | 0.5909 |
Standard Deviation | 0.0384 | 0.0455 | 0.0442 | 0.0286 | 0.0406 | 0.1185 | 0.4207 | 0.1650 | ||
Minimum | 0.2046 | 0.0170 | 1.8067 | 0.3046 | 0.2252 | -0.0217 | 1.2789 | 0.2893 | ||
25th Percentile | 0.2272 | 0.0595 | 1.8244 | 0.3297 | 0.2341 | 0.1685 | 1.8839 | 0.4739 | ||
Median | 0.2595 | 0.0967 | 1.8448 | 0.3563 | 0.2723 | 0.2281 | 2.2580 | 0.5967 | ||
75th Percentile | 0.2889 | 0.1291 | 1.8785 | 0.3744 | 0.2945 | 0.3253 | 2.5021 | 0.7324 | ||
Maximum | 0.3174 | 0.1573 | 1.9484 | 0.3888 | 0.3511 | 0.3445 | 2.6334 | 0.7953 | ||
Cumulative Loss | 3.3627 | 1.2089 | 24.1426 | 4.5661 | 3.5657 | 2.8243 | 28.3327 | 7.6811 | ||
Cumulative Loss Relative to Recent Period | 1.2933 | 2.4178 | 1.4286 | 2.2830 | 1.3714 | 5.6486 | 1.6765 | 3.8406 | ||
Cumulative Loss Relative to Downturn Period | 0.1308 | 0.0460 | 0.3755 | 0.2195 | 0.1387 | 0.1074 | 0.4406 | 0.3693 | ||
VAR Model Base | Mean | 0.2923 | 0.1208 | 1.9015 | 0.3877 | VAR Model Severely Adverse | 0.2594 | 0.2218 | 2.9533 | 1.3755 |
Standard Deviation | 0.0574 | 0.0599 | 0.0641 | 0.0457 | 0.1006 | 0.1072 | 0.4598 | 0.4527 | ||
Minimum | 0.2019 | 0.0209 | 1.8115 | 0.3020 | 0.0844 | 0.0382 | 1.6095 | 0.4136 | ||
25th Percentile | 0.2487 | 0.0767 | 1.8499 | 0.3580 | 0.2161 | 0.1709 | 2.9414 | 1.1734 | ||
Median | 0.2952 | 0.1248 | 1.8943 | 0.3979 | 0.2446 | 0.1901 | 3.0590 | 1.4404 | ||
75th Percentile | 0.3379 | 0.1686 | 1.9440 | 0.4257 | 0.2938 | 0.2934 | 3.2333 | 1.6629 | ||
Maximum | 0.3754 | 0.2052 | 2.0077 | 0.4392 | 0.5067 | 0.4302 | 3.4646 | 2.0801 | ||
Cumulative Loss | 3.8005 | 1.5700 | 24.7199 | 5.0399 | 3.3722 | 2.8828 | 38.3931 | 17.8817 | ||
Cumulative Loss Relative to Recent Period | 1.4617 | 3.1400 | 1.4627 | 2.5200 | 1.2970 | 5.7655 | 2.2718 | 8.9408 | ||
Cumulative Loss Relative to Downturn Period | 0.1479 | 0.0597 | 0.3844 | 0.2423 | 0.1312 | 0.1096 | 0.5971 | 0.8597 | ||
Regime Switching Model Base | Mean | 0.3360 | 0.1821 | 2.0186 | 0.4142 | Regime Switching Model Severely Adverse | 0.9249 | 1.2696 | 4.6953 | 1.6844 |
Standard Deviation | 0.0822 | 0.0811 | 0.1973 | 0.0559 | 0.5048 | 0.7820 | 2.4530 | 1.0219 | ||
Minimum | 0.2071 | 0.0382 | 1.8380 | 0.3102 | 0.2363 | -0.0547 | 1.4164 | 0.1437 | ||
25th Percentile | 0.2742 | 0.1246 | 1.8820 | 0.3785 | 0.5456 | 0.6673 | 2.3354 | 0.6546 | ||
Median | 0.3417 | 0.1917 | 1.9375 | 0.4314 | 0.6909 | 1.4276 | 5.0869 | 2.2355 | ||
75th Percentile | 0.4019 | 0.2491 | 2.1084 | 0.4600 | 1.3450 | 1.9156 | 7.2006 | 2.5118 | ||
Maximum | 0.4489 | 0.2861 | 2.4608 | 0.4718 | 1.7271 | 2.2146 | 7.3885 | 2.6254 | ||
Cumulative Loss | 4.3675 | 2.3669 | 26.2423 | 5.3849 | 12.0235 | 16.5051 | 61.0384 | 21.8977 | ||
Cumulative Loss Relative to Recent Period | 1.6798 | 4.7338 | 1.5528 | 2.6924 | 4.6244 | 33.0102 | 3.6117 | 10.9488 | ||
Cumulative Loss Relative to Downturn Period | 0.1699 | 0.0900 | 0.4081 | 0.2589 | 0.4678 | 0.6276 | 0.9493 | 1.0528 |
Scenario | Statistic | Modeling Segment | Scenario | Modeling Segment | ||||||
Residential Real Estate | Commercial Real Estate | Consumer Credit | Commercial and Industrial | Residential Real Estate | Commercial Real Estate | Consumer Credit | Commercial and Industrial | |||
Fed Base | Mean | 0.2062 | 0.0588 | 0.8989 | 0.2422 | Fed Severely Adverse | 0.1884 | 0.1406 | 1.9620 | 0.4649 |
Standard Deviation | 0.0704 | 0.0310 | 0.3462 | 0.0758 | 0.0573 | 0.0515 | 0.1279 | 0.0943 | ||
Minimum | 0.0907 | 0.0092 | 0.5308 | 0.1250 | 0.0633 | 0.0260 | 1.7759 | 0.2962 | ||
25th Percentile | 0.1663 | 0.0351 | 0.6120 | 0.1933 | 0.1709 | 0.1305 | 1.8680 | 0.4179 | ||
Median | 0.2009 | 0.0604 | 0.7984 | 0.2511 | 0.2110 | 0.1562 | 1.9857 | 0.4927 | ||
75th Percentile | 0.2529 | 0.0835 | 1.1134 | 0.3111 | 0.2311 | 0.1743 | 2.0854 | 0.5514 | ||
Maximum | 0.3275 | 0.1036 | 1.5795 | 0.3512 | 0.2417 | 0.1979 | 2.1230 | 0.5674 | ||
Cumulative Loss | 2.6805 | 0.7639 | 11.6863 | 3.1491 | 2.4491 | 1.8279 | 25.5062 | 6.0443 | ||
Cumulative Loss Relative to Recent Period | 0.4622 | 1.5277 | 0.6183 | 1.5746 | 0.3401 | 0.9140 | 1.5092 | 3.0221 | ||
Cumulative Loss Relative to Downturn Period | 0.1136 | 0.0290 | 0.1817 | 0.1514 | 0.0878 | 0.0695 | 0.2997 | 0.2906 | ||
VAR Model Base | Mean | 0.2105 | 0.0076 | 0.7330 | 0.2422 | VAR Model Severely Adverse | 0.2396 | 0.2323 | 2.6082 | 1.1489 |
Standard Deviation | 0.1315 | 0.0037 | 0.5570 | 0.0758 | 0.1727 | 0.0837 | 0.3808 | 0.2650 | ||
Minimum | 0.0095 | 0.0013 | 0.1246 | 0.1250 | 0.0220 | 0.0433 | 1.7796 | 0.5654 | ||
25th Percentile | 0.1083 | 0.0049 | 0.2747 | 0.1933 | 0.1111 | 0.2176 | 2.4853 | 1.0446 | ||
Median | 0.2177 | 0.0079 | 0.6006 | 0.2511 | 0.2158 | 0.2603 | 2.7857 | 1.2318 | ||
75th Percentile | 0.3172 | 0.0106 | 1.0737 | 0.3111 | 0.3643 | 0.2904 | 2.8854 | 1.3786 | ||
Maximum | 0.3983 | 0.0124 | 1.8310 | 0.3512 | 0.5431 | 0.3030 | 2.9230 | 1.4185 | ||
Cumulative Loss | 2.7360 | 0.0983 | 9.5293 | 3.1491 | 3.1149 | 3.0197 | 33.9062 | 14.9357 | ||
Cumulative Loss Relative to Recent Period | 0.4717 | 0.1966 | 0.5042 | 1.5746 | 0.5371 | 6.0393 | 2.0063 | 7.4678 | ||
Cumulative Loss Relative to Downturn Period | 0.1159 | 0.0037 | 0.1482 | 0.1514 | 0.1303 | 0.1148 | 0.3984 | 0.7181 | ||
Regime Switching Model Base | Mean | 0.3126 | 0.1380 | 1.2556 | 0.2422 | Regime Switching Model Severely Adverse | 0.8319 | 1.1002 | 3.7624 | 1.1576 |
Standard Deviation | 0.1912 | 0.0598 | 0.2199 | 0.0758 | 0.3556 | 0.6910 | 1.4307 | 0.6079 | ||
Minimum | 0.0259 | 0.0289 | 1.0623 | 0.1250 | 0.0861 | 0.0322 | 1.8287 | 0.2345 | ||
25th Percentile | 0.1641 | 0.0963 | 1.0996 | 0.1933 | 0.6731 | 0.4644 | 2.2674 | 0.5267 | ||
Median | 0.3258 | 0.1489 | 1.1895 | 0.2511 | 0.7692 | 1.4092 | 4.1468 | 1.5085 | ||
75th Percentile | 0.4684 | 0.1906 | 1.3244 | 0.3111 | 1.0180 | 1.6879 | 5.1048 | 1.6317 | ||
Maximum | 0.5754 | 0.2063 | 1.7838 | 0.3512 | 1.4150 | 1.7707 | 5.3215 | 1.6693 | ||
Cumulative Loss | 4.0640 | 1.7942 | 16.3224 | 3.1491 | 10.8147 | 14.3029 | 48.9108 | 15.0490 | ||
Cumulative Loss Relative to Recent Period | 0.6395 | 3.5885 | 0.8636 | 1.5746 | 1.8646 | 28.6058 | 2.8941 | 7.5245 | ||
Cumulative Loss Relative to Downturn Period | 0.1034 | 0.0682 | 0.2538 | 0.1514 | 0.4583 | 0.5438 | 0.5747 | 0.7235 |
Forecast Horizon | 1-Step Ahead | 8 Quarter Out-of-Sample/Time | ||
Modeling Segment | Test Statistic | P-Value | Test Statistic | P-Value |
Residential Real Estate | 2.5675829 | 0.0106 | 0.7492074 | 0.2838 |
Commercial Real Estate | 2.8342814 | 0.0096 | 0.5472589 | 0.2522 |
Consumer Credit | 3.8153666 | 0.0028 | 0.3536867 | 0.1341 |
Commercial and Industrial | 2.102496 | 0.0071 | 1.9498362 | 0.1565 |