As an effort in aligning with the United Nations Decade of Healthy Ageing, this paper reflects the methods and population characteristics from a comprehensive health and nutrition study among older Filipino adults.
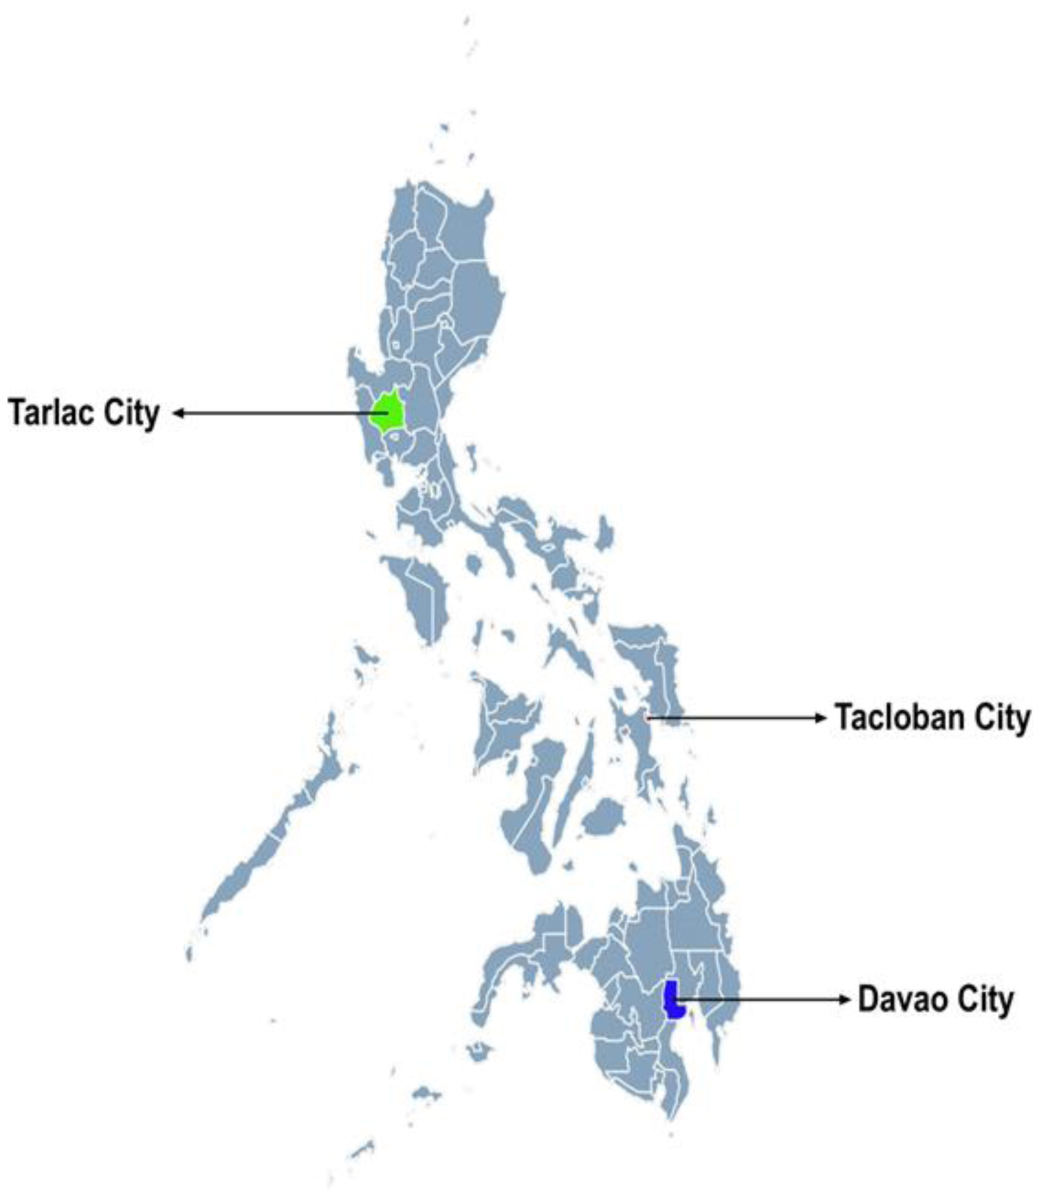
A cross-sectional study was conducted among older adults aged ≥60 years (n = 562) across the country. Descriptive statistics, chi-square, and t-tests were performed by sex and age.
The overall mean age was (69.4 ± 6.3) years. The Body Mass Index was significantly higher among those 60–69 years old compared to those >70. The lifestyle and health information varied in terms of significance between the sex and age groups.
This comprehensive study presented the profile of participants and a detailed methodology. Utilizing the data is highly encouraged to develop evidence-based policies relevant to the country driven by the demographic shift.
Citation: Robby Carlo A. Tan, Kyler Kenn M. Castilla, Angely P. Garcia, Kristine D. Macatangay, Shelley Ann F. de la Vega, Michael E. Serafico, Marco Mensink, Lisette de Groot. An overview of the healthy aging program for PinoY (HAPPY) senior citizens research: A cross-sectional study among community-dwelling older Filipinos[J]. AIMS Public Health, 2025, 12(2): 536-556. doi: 10.3934/publichealth.2025029
As an effort in aligning with the United Nations Decade of Healthy Ageing, this paper reflects the methods and population characteristics from a comprehensive health and nutrition study among older Filipino adults.
A cross-sectional study was conducted among older adults aged ≥60 years (n = 562) across the country. Descriptive statistics, chi-square, and t-tests were performed by sex and age.
The overall mean age was (69.4 ± 6.3) years. The Body Mass Index was significantly higher among those 60–69 years old compared to those >70. The lifestyle and health information varied in terms of significance between the sex and age groups.
This comprehensive study presented the profile of participants and a detailed methodology. Utilizing the data is highly encouraged to develop evidence-based policies relevant to the country driven by the demographic shift.
Activities of daily living
Appendicular skeletal muscle mass
Bioelectrical impedance analyzer
Body mass index
Comprehensive geriatric assessment
Department of science and technology-Food and nutrition research institute
Focused Interventions for frail older adults research and development project
Global positioning system
Healthy aging program for pinoy
Instrumental activities of daily living
Interquartile range
Longitudinal study of ageing and health in the Philippines
Metabolic equivalent of task
National nutrition survey
Philippine statistics authority
Strength, assistance with walking, rise from a chair, climb stairs, and falls
Service laboratory group
Short physical performance battery
Standard deviation
Timed up-and-go
University of the Philippines National Institutes of Health
University of the Philippines Los Baños
World Health Organization
World Health Organization Quality of Life Brief Version

| [1] | (2015) World Health OrganizationWorld report on ageing and health. Geneva, Switzerland: World Health Organization. [cited 2023 August 08]. Available from: https://apps.who.int/iris/handle/10665/186463. |
| [2] | Mapa DS (2022) Age and sex distribution in the Philippine population (2020 Census of Population and Housing). Philippine Statistics Authority. [cited 2024 October 29]. Available from: https://psa.gov.ph/content/age-and-sex-distribution-philippine-population-2020-census-population-and-housing. |
| [3] | (2005) National Statistics Office2000 census of population and housing. A special report on senior citizens. Philippine Statistics Authority. [cited 2024 October 29]. Available from: https://psa.gov.ph/system/files/main-publication/Philippines.pdf. |
| [4] |
Bautista EN, Tanchoco CC, Tajan MG, et al. (2013) Effect of flavor enhancers on the nutritional status of older persons. J Nutr Health Aging 17: 390-392. https://doi.org/10.1007/s12603-012-0438-9 
|
| [5] | Pungutan RS, Ramos MA (2006) The yield of utilization of comprehensive geriatric assessment (CGA) among older patients admitted at St. Luke's Medical Center. Phil J Intern Med 44: 1-5. |
| [6] |
Hays NP, Roberts SB (2006) The anorexia of aging in humans. Physiol Behav 88: 257-266. https://doi.org/10.1016/j.physbeh.2006.05.029
|
| [7] |
Chapman IM (2006) Nutritional disorders in the elderly. Med Clin North Am 90: 887-907. https://doi.org/10.1016/j.mcna.2006.05.010
|
| [8] |
Hui L (2017) Assessment of the role of ageing and non-ageing factors in death from non-communicable diseases based on a cumulative frequency model. Sci Rep 7: 8159. https://doi.org/10.1038/s41598-017-08539-0
|
| [9] |
Subramanian S, Gakunga R, Kibachio J, et al. (2018) Cost and affordability of non-communicable disease screening, diagnosis, and treatment in Kenya: Patient payments in the private and public sectors. PLoS One 13: e0190113. https://doi.org/10.1371/journal.pone.0190113
|
| [10] | Sullivan DH, Morley JE, Johnson LE, et al. (2002) The GAIN (Geriatric Anorexia Nutrition) registry: The impact of appetite and weight on mortality in the long-term care population. J Nutr Health Aging 6: 275-281. |
| [11] |
Ghimire S, Baral BK, Callahan K (2017) Nutritional assessment of community-dwelling older adults in rural Nepal. PLoS One 12: e0172052. https://doi.org/10.1371/journal.pone.0172052
|
| [12] | Ward KT, Reuben DB Comprehensive geriatric assessment (2022). [cited 2023 August 22]. Available from: https://www.uptodate.com/contents/comprehensive-geriatric-assessment#H8 |
| [13] | National Institutes of Health.Consensus development conference statement: Geriatric assessment methods for clinical decision-making. J Am Geriatr Soc (1988) 36: 342-347. https://doi.org/10.1111/j.1532-5415.1988.tb02362 |
| [14] | Garcia MCU, de la Vega SAF, Yanga-Mabunga MST (2024) Periodontal status of Filipino older adults in the focused interventions for FRAIL Older Adults Research and Development Program (FITforFRAIL): A cross-sectional study. Acta Med Philipp 58: 64. https://doi.org/10.47895/amp.v58i19.7630 |
| [15] | Pungutan RS, Ramos MA (2006) The yield of utilization of comprehensive geriatric assessment among older patients admitted at St. Luke's Medical Center. Phil J Intern Med 44: 1-5. |
| [16] | Laude TMP, Merca EE, Torres RV, et al. (2021) A descriptive study of the nutritional and frailty status of working and retired employees within an academic community in the Philippines. Acta Med Philipp 55: 728-737. https://doi.org/10.47895/amp.vi0.2830 |
| [17] | Beliran SP, Legaspi MS (2014) Health-promoting behaviors and quality of life of Filipino older persons. Asia Pac J Educ Arts Sci 1: 11-20. |
| [18] | (2020) Department of Science and Technology - Food and Nutrition Research Institute (DOST-FNRI)Philippine Nutrition Facts and Figures: 2018 Expanded National Nutrition Survey (ENNS). Taguig City, Philippines: . |
| [19] | Cruz GT, Cruz CJP, Saito Y, et al. (2019) Ageing and Health in the Philippines. Jakarta: Economic Research Institute for ASEAN and East Asia (ERIA). [cited 2024 October 29]. Available from: https://www.eria.org/publications/ageing-and-health-in-the-philippines. |
| [20] | Geneva: World Health OrganizationDecade of healthy ageing: Baseline report (2020). [cited 2024 October 29]. Available from: https://www.who.int/publications/i/item/9789240017900. |
| [21] | Mapa DS (2021) Highlights of the Population Density of the Philippines 2020 Census of Population and Housing (2020 CPH). Philippine statistics authority. [cited 2023 December 06]. Available from: https://psa.gov.ph/content/highlights-population-density-philippines-2020-census-population-and-housing-2020-cph. |
| [22] | Official Gazette of the Republic of the PhilippinesProclamation No. 940, s. 2005 (2005). [cited 2023 August 22]. Available from: https://www.officialgazette.gov.ph/2005/10/27/proclamation-no-940-s-2005-2/. |
| [23] | Official Gazette of the Republic of the PhilippinesProclamation No. 1637, s. 2008 (2008). [cited 2023 December 18]. Available from: https://www.officialgazette.gov.ph/2008/10/04/proclamation-no-1637-s-2008/. |
| [24] | City Government of Davao (n.d.) Socio-economic profile. Available from: https://www.davaocity.gov.ph/know-davao-city/socio-economic-profile/ |
| [25] | Bersales L (2016) Highlights of the Philippine population 2015 census of population. Philippine Statistics Authority. [cited 2023 December 06]. Available from: https://psa.gov.ph/content/highlights-philippine-population-2015-census-population |
| [26] |
Sazlina SG, Lee PY, Chan YM, et al. (2020) The prevalence and factors associated with sarcopenia among community-living elderly with type 2 diabetes mellitus in Malaysia. PLoS One 15: e0233299. https://doi.org/10.1371/journal.pone.0233299
|
| [27] |
Kim S, Kim M, Lee Y, et al. (2018) Calf circumference as a simple screening marker for diagnosing sarcopenia in older Korean adults: The Korean Frailty and Aging Cohort Study (KFACS). J Korean Med Sci 33: e151. https://doi.org/10.3346/jkms.2018.33.e151
|
| [28] |
Perissinotto E, Pisent C, Sergi G, et al. (2002) Anthropometric measurements in the elderly: Age and gender differences. Br J Nutr 87: 177-186. https://doi.org/10.1079/BJN2001487
|
| [29] | Elia M (2003) The ‘MUST’ report: Nutritional screening of adults–A multidisciplinary responsibility. British Association for Parenteral and Enteral Nutrition. [cited 2023 December 06]. Available from: https://www.bapen.org.uk/pdfs/must/must-report.pdf |
| [30] | (2016) Department of Science and Technology - Food and Nutrition Research Institute (DOST-FNRI)The Philippine nutrition facts and figures 2015: Dietary survey. Taguig City, Philippines: DOST-FNRI. |
| [31] | (2019) Department of Science and Technology - Food and Nutrition Research Institute (DOST-FNRI)The Philippine food composition tables 2019. Taguig City, Philippines: DOST-FNRI. |
| [32] | World Health Organization. (n.d.). Global physical activity questionnaire analysis guide. [cited 2023 January 31]. Available from: https://www.who.int/docs/default-source/ncds/ncd-surveillance/gpaq-analysis-guide.pdf |
| [33] |
Chen LK, Woo J, Assantachai P, et al. (2020) Asian working group for Sarcopenia: 2019 consensus update on sarcopenia diagnosis and treatment. J Am Med Dir Assoc 21: 300-307. https://doi.org/10.1016/j.jamda.2019.12.012
|
| [34] |
Pettersson B, Nordin E, Ramnemark A, et al. (2020) Neither timed up and go test nor short physical performance battery predict future falls among independent adults aged ≥75 years living in the community. J Frailty Sarcopenia Falls 5: 24. https://doi.org/10.22540/JFSF-05-024
|
| [35] |
Shumway-Cook A, Brauer S, Woollacott M (2000) Predicting the probability for falls in community-dwelling older adults using the Timed Up & Go Test. Phys Ther 80: 896-903. https://doi.org/10.1093/ptj/80.9.896
|
| [36] |
Malmstrom TK, Morley JE (2013) SARC-F: A simple questionnaire to rapidly diagnose sarcopenia. J Am Med Dir Assoc 14: 531-532. https://doi.org/10.1016/j.jamda.2013.05.018
|
| [37] |
Fried LP, Tangen CM, Walston J, et al. (2001) Frailty in older adults: Evidence for a phenotype. J Gerontol A Biol Sci Med Sci 56: M146-M156. https://doi.org/10.1093/gerona/56.3.m146
|
| [38] | De la Vega S (2023) Chapter 10: The comprehensive geriatric assessment. The PCP Textbook of Internal Medicine . Pasig City: Philippine College of Physicians 283-317. |
| [39] | WHOQOL Group.Development of the World Health Organization WHOQOL-BREF quality of life assessment. Psychol Med (1998) 28: 551-558. https://doi.org/10.1017/S0033291798006667 |
| [40] | Dela Vega SA (2015) Cultural validation of the WHOQOL-BREF in ambulatory community-dwelling Filipino older persons. J Health Res 17: 20. |
| [41] |
JafariNasabian P, Inglis JE, Reilly W, et al. (2017) Aging human body: Changes in bone, muscle, and body fat with consequent changes in nutrient intake. J Endocrinol 234: R37-R51. https://doi.org/10.1530/JOE-16-0603
|
| [42] |
McPhee JS, French DP, Jackson D, et al. (2016) Physical activity in older age: Perspectives for healthy ageing and frailty. Biogerontology 17: 567-580. https://doi.org/10.1007/s10522-016-9641-0
|
| [43] |
Shlisky J, Bloom DE, Beaudreault AR, et al. (2017) Nutritional considerations for healthy aging and reduction in age-related chronic disease. Adv Nutr 8: 17-26. https://doi.org/10.3945/an.116.013474
|
| [44] | Republic of the Philippines (2020 Quarantine guidelines - COVID-19 dashboard. [cited 2023 August 08]. Available from: https://www.covid19.gov.ph/security/mgcq |
| [45] | Cruz C, Cruz G (2019) Chapter 3: Filipino Older Persons. Ageing and Health in the Philippines . Jakarta: Economic Research Institute for ASEAN and East Asia (ERIA) 27-46. |
| [46] |
Carandang RR, Asis E, Shibanuma A, et al. (2019) Unmet needs and coping mechanisms among community-dwelling senior citizens in the Philippines: A qualitative study. Int J Environ Res Public Health 16: 3745. https://doi.org/10.3390/ijerph16193745
|
| [47] |
Kim S, Won CW (2022) Sex-different changes of body composition in aging: A systemic review. Arch Gerontol Geriatr 102: 104711. https://doi.org/10.1016/j.archger.2022.104711
|
| [48] |
Oduro JK, Okyere J, Nyador JKMT (2023) Risky health behaviours and chronic conditions among aged persons: Analysis of SAGE selected countries. BMC Geriatr 23: 145. https://doi.org/10.1186/s12877-023-03836-y
|
| [49] | Lusica PMM, Jimeno CA (2023) Prevalence of metabolic syndrome and specific cardiovascular risk factors among older persons in the Philippines: Results from the 8th Philippine National Nutrition Survey. Acta Med Philipp 57: 5-11. https://doi.org/10.47895/amp.vi0.5719 |
| [50] |
Knodel J, Pothisiri W (2021) Smoking and drinking behaviors among older adults: A comparative analysis of three Southeast Asian countries. J Cross Cult Gerontol 36: 369-386. https://doi.org/10.1007/s10823-021-09438-8
|
| [51] |
Cristina NM, Lucia D (2021) Nutrition and healthy aging: Prevention and treatment of gastrointestinal diseases. Nutrients 13: 4337. https://doi.org/10.3390/nu13124337
|
| [52] |
Bojang KP, Manchana V (2023) Nutrition and healthy aging: A review. Curr Nutr Rep 12: 369-375. https://doi.org/10.1007/s13668-023-00473-0
|
 publichealth-12-02-029-s001.pdf publichealth-12-02-029-s001.pdf |
 |

Figures(2) / Tables(6)

Robby Carlo A. Tan, Kyler Kenn M. Castilla, Angely P. Garcia, Kristine D. Macatangay, Shelley Ann F. de la Vega, Michael E. Serafico, Marco Mensink, Lisette de Groot. An overview of the healthy aging program for PinoY (HAPPY) senior citizens research: A cross-sectional study among community-dwelling older Filipinos[J]. AIMS Public Health, 2025, 12(2): 536-556. doi: 10.3934/publichealth.2025029


 DownLoad: