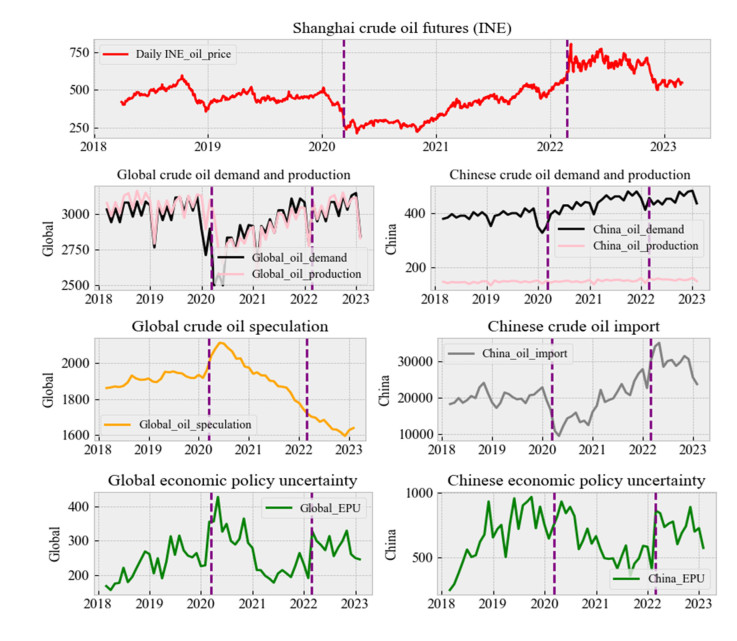
Using the GARCH-MIDAS model, we investigated the impact of Chinese and global macro-level determinants on the return volatility of Shanghai crude oil futures, covering Chinese and global economic policy uncertainty, Chinese and global crude oil demand as well as production, Chinese crude oil import, and global crude oil speculation. The in-sample empirical results showed that Chinese crude oil demand, Chinese crude oil production, Chinese economic policy uncertainty, and global crude oil speculation have significant impact on the long-term volatility component of Shanghai crude oil futures. The out-of-sample prediction results show that Chinese current crude oil production and previous crude oil import have the relatively best predictive power for the return volatility of Shanghai crude oil futures. As a whole, Chinese domestic macro-factors have a stronger impact and higher predictive power on the return volatility of Shanghai crude oil futures compared with corresponding global macro-factors. Besides, the global crude oil speculation is the global macro-level determinant, which deserves most attention.
Citation: Xiaoling Yu, Kaitian Xiao, Javier Cifuentes-Faura. Closer is more important: The impact of Chinese and global macro-level determinants on Shanghai crude oil futures volatility[J]. Quantitative Finance and Economics, 2024, 8(3): 573-609. doi: 10.3934/QFE.2024022
Using the GARCH-MIDAS model, we investigated the impact of Chinese and global macro-level determinants on the return volatility of Shanghai crude oil futures, covering Chinese and global economic policy uncertainty, Chinese and global crude oil demand as well as production, Chinese crude oil import, and global crude oil speculation. The in-sample empirical results showed that Chinese crude oil demand, Chinese crude oil production, Chinese economic policy uncertainty, and global crude oil speculation have significant impact on the long-term volatility component of Shanghai crude oil futures. The out-of-sample prediction results show that Chinese current crude oil production and previous crude oil import have the relatively best predictive power for the return volatility of Shanghai crude oil futures. As a whole, Chinese domestic macro-factors have a stronger impact and higher predictive power on the return volatility of Shanghai crude oil futures compared with corresponding global macro-factors. Besides, the global crude oil speculation is the global macro-level determinant, which deserves most attention.

| [1] |
Bei S, Yang A, Pei H, et al. (2023) Price Risk Analysis using GARCH Family Models: Evidence from Shanghai Crude Oil Futures Market. Econ Model 125: 106367. http://doi.org/10.1016/j.econmod.2023.106367 doi: 10.1016/j.econmod.2023.106367

|
| [2] |
Bu H (2014) Effect of inventory announcements on crude oil price volatility. Energy Econ 46: 485–494. http://doi.org/10.1016/j.eneco.2014.05.015 doi: 10.1016/j.eneco.2014.05.015
|
| [3] |
Corbet S, Hou YG, Hu Y, et al. (2022) The growth of oil futures in China: Evidence of market maturity through global crises. Energy Econ 114: 106243. http://doi.org/10.1016/j.eneco.2022.106243 doi: 10.1016/j.eneco.2022.106243
|
| [4] |
Dai P, Xiong X, Zhang J, et al. (2022) The role of global economic policy uncertainty in predicting crude oil futures volatility: Evidence from a two-factor GARCH-MIDAS model. Resour Policy 78: 102849. http://doi.org/10.1016/j.resourpol.2022.102849 doi: 10.1016/j.resourpol.2022.102849
|
| [5] |
Dai Z, Zhu J, Zhang X (2022) Time-frequency connectedness and cross-quantile dependence between crude oil, Chinese commodity market, stock market and investor sentiment. Energy Econ 114: 106226. http://doi.org/10.1016/j.eneco.2022.106226 doi: 10.1016/j.eneco.2022.106226
|
| [6] |
Diaz-Rainey I, Roberts H, Lont DH (2017) Crude inventory accounting and speculation in the physical oil market. Energy Econ 66: 508–522. http://doi.org/10.1016/j.eneco.2017.03.029 doi: 10.1016/j.eneco.2017.03.029
|
| [7] |
Diebold FX, Mariano RS (1995) Comparing Predictive Accuracy. J Bus Econ Stat 13: 253–263. https://doi.org/10.1080/07350015.1995.10524599 doi: 10.1080/07350015.1995.10524599
|
| [8] |
Engle RF, Ghysels E, Sohn B (2013) Stock market volatility and macroeconomic fundamentals. Rev Econ Stat 3: 776–797. https://doi.org/10.1162/REST_a_00300 doi: 10.1162/REST_a_00300
|
| [9] |
Fu J, Qiao H (2022) The Time-Varying Connectedness Between China's Crude Oil Futures and International Oil Markets: A Return and Volatility Spillover Analysis. Lett Spat Resour Sci 15: 341–376. http://doi.org/10.1007/s12076-021-00288-z doi: 10.1007/s12076-021-00288-z
|
| [10] |
Giacomini R, Rossi B (2010) Forecast comparisons in unstable environments. J Appl Econom 25: 595–620. https://doi.org/10.1002/jae.1177 doi: 10.1002/jae.1177
|
| [11] |
Gong W, Li Y, Wang C, et al. (2022) The Catastrophe Analysis of Shanghai Crude Oil Futures Price from the Perspective of Volatility Factors. Complexity 2022: 1–12. http://doi.org/10.1155/2022/5367693 doi: 10.1155/2022/5367693
|
| [12] |
Guo Y, Li P, Wu H (2023) Jumps in the Chinese crude oil futures volatility forecasting: New evidence. Energy Econ 126: 106955. http://doi.org/10.1016/j.eneco.2023.106955 doi: 10.1016/j.eneco.2023.106955
|
| [13] |
He C, Li G, Fan H, et al. (2021) Correlation between Shanghai crude oil futures, stock, foreign exchange, and gold markets: a GARCH-vine-copula method. Appl Econ 53: 1249–1263. http://doi.org/10.1080/00036846.2020.1828566 doi: 10.1080/00036846.2020.1828566
|
| [14] |
Hu G, Jiang H (2023) Time-varying jumps in China crude oil futures market impacted by COVID-19 pandemic. Resour Policy 82: 103510. http://doi.org/10.1016/j.resourpol.2023.103510 doi: 10.1016/j.resourpol.2023.103510
|
| [15] |
Huang Y, Xu W, Huang D, et al. (2023) Chinese crude oil futures volatility and sustainability: An uncertainty indices perspective. Resour Policy 80: 103227. http://doi.org/10.1016/j.resourpol.2022.103227 doi: 10.1016/j.resourpol.2022.103227
|
| [16] |
Jiang W, Tang W, Liu X (2023) Forecasting realized volatility of Chinese crude oil futures with a new secondary decomposition ensemble learning approach. Financ Res Lett 57: 104254. http://doi.org/10.1016/j.frl.2023.104254 doi: 10.1016/j.frl.2023.104254
|
| [17] |
Jin D, He M, Xing L, et al. (2022) Forecasting China's crude oil futures volatility: How to dig out the information of other energy futures volatilities? Resour Policy 78: 102852. http://doi.org/10.1016/j.resourpol.2022.102852 doi: 10.1016/j.resourpol.2022.102852
|
| [18] |
Joo K, Jeong M, Seo Y, et al. (2021) Shanghai crude oil futures: Flagship or burst? Energy Rep 7: 4197–4204. http://doi.org/10.1016/j.egyr.2021.06.098 doi: 10.1016/j.egyr.2021.06.098
|
| [19] |
Kang B, Nikitopoulos CS, Prokopczuk M (2020) Economic determinants of oil futures volatility: A term structure perspective. Energy Econ 88: 104743. http://doi.org/10.1016/j.eneco.2020.104743 doi: 10.1016/j.eneco.2020.104743
|
| [20] |
Kilian L, Murphy DP (2014) The role of inventories and speculative trading in the global market for crude oil. J Appl Econ 29: 454–478. https://doi.org/10.1002/jae.2322 doi: 10.1002/jae.2322
|
| [21] |
Li J, Umar M, Huo J (2023) The spillover effect between Chinese crude oil futures market and Chinese green energy stock market. Energy Econ 119: 106568. http://doi.org/10.1016/j.eneco.2023.106568 doi: 10.1016/j.eneco.2023.106568
|
| [22] |
Lin B, Su T (2021) Do China's macro-financial factors determine the Shanghai crude oil futures market? Int Rev Financ Anal 78: 101953. http://doi.org/10.1016/j.irfa.2021.101953 doi: 10.1016/j.irfa.2021.101953
|
| [23] |
Liu M, Lee C (2021) Capturing the dynamics of the China crude oil futures: Markov switching, co-movement, and volatility forecasting. Energy Econ 103: 105622. http://doi.org/10.1016/j.eneco.2021.105622 doi: 10.1016/j.eneco.2021.105622
|
| [24] |
Lu X, Ma F, Wang J, et al. (2022) Forecasting oil futures realized range‐based volatility with jumps, leverage effect, and regime switching: New evidence from MIDAS models. J Forecast 41: 853–868. http://doi.org/10.1002/for.2837 doi: 10.1002/for.2837
|
| [25] |
Luo J, Ji Q (2018) High-frequency volatility connectedness between the US crude oil market and China's agricultural commodity markets. Energy Econ 76: 424–438. http://doi.org/10.1016/j.eneco.2018.10.031 doi: 10.1016/j.eneco.2018.10.031
|
| [26] |
Lv F, Yang C, Fang L (2020) Do the crude oil futures of the Shanghai International Energy Exchange improve asset allocation of Chinese petrochemical-related stocks? Int Rev Financ Anal 71: 101537. http://doi.org/10.1016/j.irfa.2020.101537 doi: 10.1016/j.irfa.2020.101537
|
| [27] |
Ma R, Zhou C, Cai H, et al. (2019) The forecasting power of EPU for crude oil return volatility. Energy Rep 5: 866–873. http://doi.org/10.1016/j.egyr.2019.07.002 doi: 10.1016/j.egyr.2019.07.002
|
| [28] |
Niu J, Ma C, Chang C (2023) The arbitrage strategy in the crude oil futures market of shanghai international energy exchange. Econ Chang Restruct 56: 1201–1223. http://doi.org/10.1007/s10644-022-09468-3 doi: 10.1007/s10644-022-09468-3
|
| [29] |
Shao M, Hua Y (2022) Price discovery efficiency of China's crude oil futures: Evidence from the Shanghai crude oil futures market. Energy Econ 112: 106172. http://doi.org/10.1016/j.eneco.2022.106172 doi: 10.1016/j.eneco.2022.106172
|
| [30] |
Sun C, Min J, Sun J, et al. (2023) The role of China's crude oil futures in world oil futures market and China's financial market. Energy Econ 120: 106619. http://doi.org/10.1016/j.eneco.2023.106619 doi: 10.1016/j.eneco.2023.106619
|
| [31] |
Sun C, Peng Y, Zhan Y (2023) How does China's crude oil futures affect the crude oil prices at home and abroad? Evidence from the cross-market exchange rate spillovers. Int Rev Econ Financ 88: 204–222. http://doi.org/10.1016/j.iref.2023.06.013 doi: 10.1016/j.iref.2023.06.013
|
| [32] |
Sun C, Zhan Y, Peng Y, et al. (2022) Crude oil price and exchange rate: Evidence from the period before and after the launch of China's crude oil futures. Energy Econ 105: 105707. http://doi.org/10.1016/j.eneco.2021.105707 doi: 10.1016/j.eneco.2021.105707
|
| [33] |
Stock JH, Watson MW (2002) Forecasting Using Principal Components From a Large Number of Predictors. J Am Stat Assoc 97: 1167–1179. https://doi.org/10.1198/016214502388618960 doi: 10.1198/016214502388618960
|
| [34] |
Wang H, Qiu S, Yick HY, et al. (2022) A Study on the Oil Price Cointegration Dynamic Process: Evidence From the Shanghai Crude Oil Futures. Front Environ Sci 10: 901236. http://doi.org/10.3389/fenvs.2022.901236 doi: 10.3389/fenvs.2022.901236
|
| [35] |
Wang J, Qiu S, Yick HY (2022) The influence of the Shanghai crude oil futures on the global and domestic oil markets. Energy 245: 123271. http://doi.org/10.1016/j.energy.2022.123271 doi: 10.1016/j.energy.2022.123271
|
| [36] |
Wang X, Wang Y (2019) Volatility spillovers between crude oil and Chinese sectoral equity markets: Evidence from a frequency dynamics perspective. Energy Econ 80: 995–1009. http://doi.org/10.1016/j.eneco.2019.02.019 doi: 10.1016/j.eneco.2019.02.019
|
| [37] |
Wang Z, Liu B, Fan Y (2023) Network connectedness between China's crude oil futures and sector stock indices. Energy Econ 125: 106848. http://doi.org/10.1016/j.eneco.2023.106848 doi: 10.1016/j.eneco.2023.106848
|
| [38] |
Wei Y, Liu J, Lai X, et al. (2017) Which determinant is the most informative in forecasting crude oil market volatility: Fundamental, speculation, or uncertainty? Energy Econ 68: 141–150. http://doi.org/10.1016/j.eneco.2017.09.016 doi: 10.1016/j.eneco.2017.09.016
|
| [39] |
Wei Y, Zhang Y, Wang Y (2022) Information connectedness of international crude oil futures: Evidence from SC, WTI, and Brent. Int Rev Financ Anal 81: 102100. http://doi.org/10.1016/j.irfa.2022.102100 doi: 10.1016/j.irfa.2022.102100
|
| [40] |
Wu X, Cui H, Wang L (2023) Forecasting oil futures price volatility with economic policy uncertainty: a CARR-MIDAS model. Appl Econ Lett 30: 120–125. http://doi.org/10.1080/13504851.2021.1977232 doi: 10.1080/13504851.2021.1977232
|
| [41] |
Yang C, Lv F, Fang L, et al. (2020) The pricing efficiency of crude oil futures in the Shanghai International Exchange. Financ Res Lett 36: 101329. http://doi.org/10.1016/j.frl.2019.101329 doi: 10.1016/j.frl.2019.101329
|
| [42] |
Yang K, Wei Y, Li S, et al. (2021) Global financial uncertainties and China's crude oil futures market: Evidence from interday and intraday price dynamics. Energy Econ 96: 105149. http://doi.org/10.1016/j.eneco.2021.105149 doi: 10.1016/j.eneco.2021.105149
|
| [43] |
Yang Y, Ma Y, Hu M, et al. (2021) Extreme risk spillover between chinese and global crude oil futures. Financ Res Lett 40: 101743. http://doi.org/10.1016/j.frl.2020.101743 doi: 10.1016/j.frl.2020.101743
|
| [44] |
Yu X, Xiao K (2022) Dependencies and Volatility Spillovers among Chinese Stock and Crude Oil Future Markets: Evidence from Time-Varying Copula and BEKK-GARCH Models. J Risk Financ Manag 15: 491. http://doi.org/10.3390/jrfm15110491 doi: 10.3390/jrfm15110491
|
| [45] |
Yu X, Huang Y, Xiao K (2021) Global economic policy uncertainty and stock volatility: evidence from emerging economies. J Appl Econ 24: 416–440. http://doi.org/10.1080/15140326.2021.1953913 doi: 10.1080/15140326.2021.1953913
|
| [46] |
Yu Z, Yang J, Webb RI (2023) Price discovery in China's crude oil futures markets: An emerging Asian benchmark? J Futures Mark 43: 297–324. http://doi.org/10.1002/fut.22384 doi: 10.1002/fut.22384
|
| [47] |
Zagaglia P (2010) Macroeconomic factors and oil futures prices: A data-rich model. Energy Econ 32: 409–417. http://doi.org/10.1016/j.eneco.2009.11.003 doi: 10.1016/j.eneco.2009.11.003
|
| [48] |
Zhang D, Farnoosh A, Ma Z (2022) Does the Launch of Shanghai Crude Oil Futures Stabilize the Spot Market? A Financial Cycle Perspective. Int Econ J 36: 39–58. http://doi.org/10.1080/10168737.2021.2001027 doi: 10.1080/10168737.2021.2001027
|
| [49] |
Zhang Q, Di P, Farnoosh A (2021) Study on the impacts of Shanghai crude oil futures on global oil market and oil industry based on VECM and DAG models. Energy 223: 120050. http://doi.org/10.1016/j.energy.2021.120050 doi: 10.1016/j.energy.2021.120050
|
| [50] |
Zhu P, Lu T, Chen S (2022) How do crude oil futures hedge crude oil spot risk after the COVID-19 outbreak? A wavelet denoising-GARCHSK-SJC Copula hedge ratio estimation method. Physica A 607: 128217. http://doi.org/10.1016/j.physa.2022.128217 doi: 10.1016/j.physa.2022.128217
|
 QFE-08-03-022-s001.pdf QFE-08-03-022-s001.pdf |
 |


Figures(4) / Tables(11)

Xiaoling Yu, Kaitian Xiao, Javier Cifuentes-Faura. Closer is more important: The impact of Chinese and global macro-level determinants on Shanghai crude oil futures volatility[J]. Quantitative Finance and Economics, 2024, 8(3): 573-609. doi: 10.3934/QFE.2024022


 DownLoad: