We investigated the variations in the corporate financial performance (CFP) of firms that integrate ESG factors into their business practices, focusing on the mediating role of corporate efficiency (CE). Using 909 company-level data, we applied Data Envelopment Analysis (DEA) to measure CE. We examined how these efficiency scores and CFP viz., Return on Assets (ROA), market value, and profit after tax (PAT) are influenced at different levels of ESG. To provide variational and distributional aspects, we employed quantile regression to estimate the relationship between ESG, CE, and CFP across different quantiles. The findings indicated that the impact of ESG integration on efficiency and CFP positively varies across quantiles. Further, a non-linear U-shaped relationship is established between the overall ESG score, environmental score, and social score with the CE. The efficiency initially dips at a lower disclosure score and surges to its highest at a higher disclosure score. Finally, our results revealed that ESG integration brings CE, which in turn channeled into financial outcomes, suggesting that CE plays a crucial mediating role. These results contribute to the understanding of how ESG practices can be leveraged for better financial outcomes through CE. These findings provide companies and policymakers with vital direction, encouraging a focus on robust ESG disclosure in establishing the path toward long-term corporate sustainability and profitability, guided by improved CE.
Citation: Abhisek Mahanta, Naresh Chandra Sahu, Pradeep Kumar Behera, Pushp Kumar. Variations in financial performance of firms with ESG integration in business: The mediating role of corporate efficiency using DEA[J]. Green Finance, 2024, 6(3): 518-562. doi: 10.3934/GF.2024020
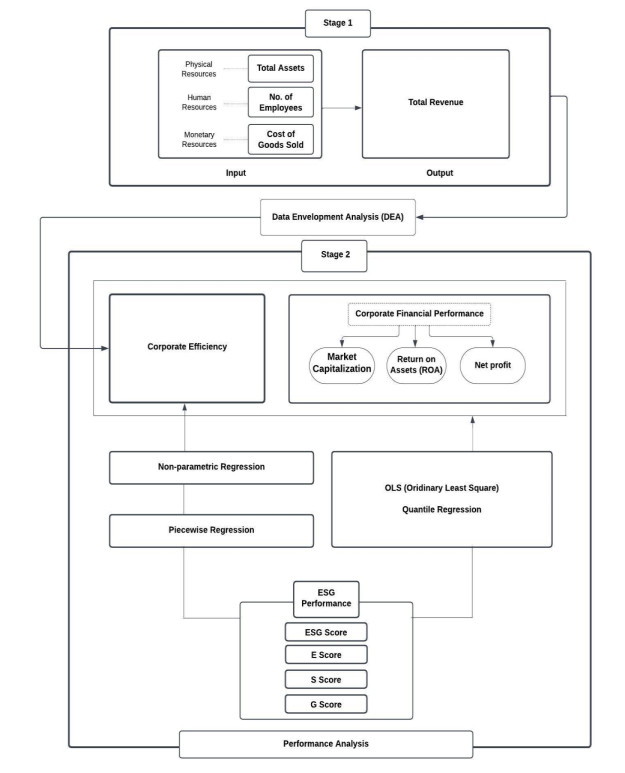
We investigated the variations in the corporate financial performance (CFP) of firms that integrate ESG factors into their business practices, focusing on the mediating role of corporate efficiency (CE). Using 909 company-level data, we applied Data Envelopment Analysis (DEA) to measure CE. We examined how these efficiency scores and CFP viz., Return on Assets (ROA), market value, and profit after tax (PAT) are influenced at different levels of ESG. To provide variational and distributional aspects, we employed quantile regression to estimate the relationship between ESG, CE, and CFP across different quantiles. The findings indicated that the impact of ESG integration on efficiency and CFP positively varies across quantiles. Further, a non-linear U-shaped relationship is established between the overall ESG score, environmental score, and social score with the CE. The efficiency initially dips at a lower disclosure score and surges to its highest at a higher disclosure score. Finally, our results revealed that ESG integration brings CE, which in turn channeled into financial outcomes, suggesting that CE plays a crucial mediating role. These results contribute to the understanding of how ESG practices can be leveraged for better financial outcomes through CE. These findings provide companies and policymakers with vital direction, encouraging a focus on robust ESG disclosure in establishing the path toward long-term corporate sustainability and profitability, guided by improved CE.

| [1] | Achim MV, Nicolae Borlea S (2014) Environmental performances way to boost up financial performances of companies. Environ Eng Manag J 13: 991–1004. http://omicron.ch.tuiasi.ro/EEMJ/ |
| [2] |
Abdulla Y, Jawad A (2024) Do MENA firms consider climate risks? Evidence from the relationship between ESG and firm performance. J Sustainable Financ Investment, 1–19. https://doi.org/10.1080/20430795.2024.2334256 doi: 10.1080/20430795.2024.2334256

|
| [3] |
Aevoae GM, Andrieș AM, Ongena S, et al. (2022) ESG and systemic risk. Appl Econ 55: 3085–3109. https://doi.org/10.1080/00036846.2022.2108752 doi: 10.1080/00036846.2022.2108752
|
| [4] |
Agarwala N, Jana S, Sahu T N (2024) ESG disclosures and corporate performance: A non-linear and disaggregated approach. J Cleaner Prod 437: 140517. https://doi.org/10.1016/j.jclepro.2023.140517 doi: 10.1016/j.jclepro.2023.140517
|
| [5] |
Alam AW, Banna H, Hassan MK (2022) ESG ACTIVITIES AND BANK EFFICIENCY: ARE ISLAMIC BANKS BETTER? J Islamic Monetary Econ Financ 8: 65–88. https://doi.org/10.21098/JIMF.V8I1.1428 doi: 10.21098/JIMF.V8I1.1428
|
| [6] |
Alkaraan F (2023a) Editorial: Current issues in business innovation, governance structure and business performance. Bus Perform Rev 1: 4–6. https://doi.org/10.22495/bprv1i2editorial doi: 10.22495/bprv1i2editorial
|
| [7] |
Alkaraan F (2023b) Editorial: Corporate governance and sustainability issues. Corp Gov Sustain Rev 7: 4–6. https://doi.org/10.22495/cgsrv7i1editorial doi: 10.22495/cgsrv7i1editorial
|
| [8] |
Alkaraan F, Elmarzouky M, Hussainey K, et al. (2024) Reinforcing green business strategies with Industry 4.0 and governance towards sustainability: Natural-resource-based view and dynamic capability. Bus Strateg Environ 33: 3588–3606. https://doi.org/10.1002/bse.3665 doi: 10.1002/bse.3665
|
| [9] |
Alkaraan F, Elmarzouky M, Hussainey K, et al. (2023) Sustainable strategic investment decision-making practices in UK companies: the influence of governance mechanisms on synergy between Industry 4.0 and circular economy. Technol Forecast Soc 187: 122187. https://doi.org/10.1016/j.techfore.2022.122187 doi: 10.1016/j.techfore.2022.122187
|
| [10] |
Alkaraan F, Albitar K, Hussainey K, et al. (2022) Corporate transformation towards Industry 4.0 and financial performance: The influence of environmental, social and governance (ESG). Technol Forecast Soc 175: 121423. https://doi.org/10.1016/j.techfore.2021.121423. doi: 10.1016/j.techfore.2021.121423
|
| [11] |
Arora A, Sharma C (2016) Corporate governance and firm performance in developing countries: evidence from India. Corp Gov 16: 420–436. https://doi.org/10.1108/CG-01-2016-0018 doi: 10.1108/CG-01-2016-0018
|
| [12] |
Aroul RR, Sabherwal S, Villupuram SV (2022) ESG, operational efficiency and operational performance: evidence from Real Estate Investment Trusts. Manag Financ 48: 1206–1220. https://doi.org/10.1108/MF-12-2021-0593 doi: 10.1108/MF-12-2021-0593
|
| [13] |
Arvidsson S, Dumay J (2022) Corporate ESG reporting quantity, quality and performance: Where to now for environmental policy and practice? Bus Strateg Environ 31: 1091–1110. https://doi.org/10.1002/BSE.2937 doi: 10.1002/BSE.2937
|
| [14] |
Ata B, Lee D, Tongarlak MH (2012) Optimizing Organic Waste to Energy Operations. Manuf Serv Oper Manag 14: 231–244. https://doi.org/10.1287/MSOM.1110.0359 doi: 10.1287/MSOM.1110.0359
|
| [15] |
Aydoğmuş M, Gülay G, Ergun K (2022) Impact of ESG performance on firm value and profitability. Borsa Istanb Rev 22: S119–S127. https://doi.org/10.1016/J.BIR.2022.11.006 doi: 10.1016/J.BIR.2022.11.006
|
| [16] |
Bai CE, Liu Q, Lu J, et al. (2004) Corporate governance and market valuation in China. J Comp Econ 32: 599–616. https://doi.org/10.1016/J.JCE.2004.07.002 doi: 10.1016/J.JCE.2004.07.002
|
| [17] |
Barnet K, Ferris SP (2016) Brand Loyalty and Online Brand Communities: Is Brand Loyalty Being Strengthened Through Social Media? Int J Online Market 6: 50–61. https://doi.org/10.4018/IJOM.2016070104 doi: 10.4018/IJOM.2016070104
|
| [18] |
Baron RM, Kenny DA (1986) The moderator–mediator variable distinction in social psychological research: Conceptual, strategic, and statistical considerations. J Pers Soc Psychol 51: 1173–1182. https://doi.org/10.1037/0022-3514.51.6.1173 doi: 10.1037/0022-3514.51.6.1173
|
| [19] |
Bhagat S, Bolton B (2008) Corporate governance and firm performance. J Corp Financ 14: 257–273. https://doi.org/10.1016/J.JCORPFIN.2008.03.006 doi: 10.1016/J.JCORPFIN.2008.03.006
|
| [20] |
Bhagat S, Bolton B (2019) Corporate governance and firm performance: The sequel. J Corp Financ 58: 142–168. https://doi.org/10.1016/J.JCORPFIN.2019.04.006 doi: 10.1016/J.JCORPFIN.2019.04.006
|
| [21] |
Bissoondoyal-Bheenick E, Brooks R, Do HX (2023) ESG and firm performance: The role of size and media channels. Econ Model 121: 106203. https://doi.org/10.1016/j.econmod.2023.106203 doi: 10.1016/j.econmod.2023.106203
|
| [22] |
Boulhaga M, Bouri A, Elamer AA, et al. (2023) Environmental, social and governance ratings and firm performance: The moderating role of internal control quality. Corp Soc Resp Env Manag 30: 134–145. https://doi.org/10.1002/csr.2343 doi: 10.1002/csr.2343
|
| [23] |
Buallay A (2019) Is sustainability reporting (ESG) associated with performance? Evidence from the European banking sector. Manag Environ Qual Int J 30: 98–115. https://doi.org/10.1108/MEQ-12-2017-0149 doi: 10.1108/MEQ-12-2017-0149
|
| [24] |
Cagli ECC, Mandaci PE, Taşkın D (2022) Environmental, social, and governance (ESG) investing and commodities: dynamic connectedness and risk management strategies. Sustain Account Manag Policy J 14: 1052–1074. https://doi.org/10.1108/SAMPJ-01-2022-0014 doi: 10.1108/SAMPJ-01-2022-0014
|
| [25] |
Cao X, Mei T, Li S (2024) Research on the relationship between ESG disclosure quality and stock liquidity of Chinese listed companies. Green Financ 6: 24–51. https://doi.org/10.3934/GF.2024002 doi: 10.3934/GF.2024002
|
| [26] |
Chang CH, Lin HW, Tsai WH, et al. (2021a) Employee Satisfaction, Corporate Social Responsibility and Financial Performance. Sustainability 13: 9996. https://doi.org/10.3390/SU13189996 doi: 10.3390/SU13189996
|
| [27] |
Chang K, Cheng X, Wang Y, et al. (2021) The impacts of ESG performance and digital finance on corporate financing efficiency in China. Appl Econ Lett 30: 516–523. https://doi.org/10.1080/13504851.2021.1996527 doi: 10.1080/13504851.2021.1996527
|
| [28] |
Chen S, Song Y, Gao P (2023) Environmental, social, and governance (ESG) performance and financial outcomes: Analyzing the impact of ESG on financial performance. J Environ Manage 345: 118829. https://doi.org/10.1016/J.JENVMAN.2023.118829 doi: 10.1016/J.JENVMAN.2023.118829
|
| [29] |
Cheng LTW, Sharma P, Broadstock DC (2023) Interactive effects of brand reputation and ESG on green bond issues: A sustainable development perspective. Bus Strateg Environ 32: 570–586. https://doi.org/10.1002/BSE.3161 doi: 10.1002/BSE.3161
|
| [30] |
Cho SY, Lee C (2019) Managerial efficiency, corporate social performance, and corporate financial performance. J Bus Ethics 158: 467–486. https://doi.org/10.1007/s10551-017-3760-7 doi: 10.1007/s10551-017-3760-7
|
| [31] |
Chouaibi S, Chouaibi J, Rossi M (2022) ESG and corporate financial performance: the mediating role of green innovation: UK common law versus Germany civil law. Euromed J Bus 17: 46–71. https://doi.org/10.1108/EMJB-09-2020-0101 doi: 10.1108/EMJB-09-2020-0101
|
| [32] |
Chung K, Nguyen LTM, Nguyen DTT (2023) Improving Hotels' operational efficiency through ESG Investment: A Risk Management Perspective. Serv Sci. https://doi.org/10.1287/serv.2023.0080 doi: 10.1287/serv.2023.0080
|
| [33] |
Darmawan D, Mardikaningsih R, Sinambela EA, et al. (2020) The Quality of Human Resources, Job Performance and Employee Loyalty. Int J Psychosoc Rehabil 24: 2580–2592. https://doi.org/10.37200/IJPR/V24I3/PR201903 doi: 10.37200/IJPR/V24I3/PR201903
|
| [34] |
Dowling J, Pfeffer J (1975) Organizational legitimacy: Social values and organizational behavior. Sociol Perspect 18: 122–136. https://doi.org/10.2307/1388226/ASSET/1388226.FP.PNG_V03 doi: 10.2307/1388226/ASSET/1388226.FP.PNG_V03
|
| [35] | Edwards D (2014) The link between company environmental and financial performance. In: The Link Between Company Environmental and Financial Performance, 1–73. https://doi.org/10.4324/9781315738864 |
| [36] |
El Khoury R, Nasrallah N, Alareeni B (2021) ESG and financial performance of banks in the MENAT region: concavity–convexity patterns. J Sustain Financ Inv 13: 406–430. https://doi.org/10.1080/20430795.2021.1929807 doi: 10.1080/20430795.2021.1929807
|
| [37] |
El-Wahed MHA, Ali EA (2013) Effect of irrigation systems, amounts of irrigation water and mulching on corn yield, water use efficiency and net profit. Agr Water Manage 120: 64–71. https://doi.org/10.1016/J.AGWAT.2012.06.017 doi: 10.1016/J.AGWAT.2012.06.017
|
| [38] |
Erol I, Unal U, Coskun Y (2023) ESG investing and the financial performance: a panel data analysis of developed REIT markets. Environ Sci Pollut Res 30: 85154–85169. https://doi.org/10.1007/s11356-023-28376-1 doi: 10.1007/s11356-023-28376-1
|
| [39] |
Fandella P, Sergi BS, Sironi E (2023) Corporate social responsibility performance and the cost of capital in BRICS countries. The problem of selectivity using environmental, social and governance scores. Corp Soc Resp Env Manag 30: 1712–1722. https://doi.org/10.1002/csr.2447 doi: 10.1002/csr.2447
|
| [40] |
Feng X (2021) The role of ESG in acquirers' performance change after M & A deals. Green Financ 3: 287–318. https://doi.org/10.3934/GF.2021015 doi: 10.3934/GF.2021015
|
| [41] |
Fernández Y, López MF, Olmedillas Blanco B (2018) Innovation for sustainability: The impact of R & D spending on CO2 emissions. J Clean Prod 172: 3459–3467. https://doi.org/10.1016/J.JCLEPRO.2017.11.001 doi: 10.1016/J.JCLEPRO.2017.11.001
|
| [42] |
Fosu E, Fosu F, Akyina N, et al. (2024) Do environmental CSR practices promote corporate social performance? The mediating role of green innovation and corporate image. Clean Respons Consum 12: 100155. https://doi.org/10.1016/j.clrc.2023.100155 doi: 10.1016/j.clrc.2023.100155
|
| [43] | Freeman RE (1984) Strategic management: a stakeholder approach. In Pitman. |
| [44] | Friedman M (1970) A Friedman doctrine‐ The Social Responsibility of Business Is to Increase Its Profits. The New York Times Magazine, 32–33. Available from: https://www.nytimes.com/1970/09/13/archives/a-friedman-doctrine-the-social-responsibility-of-business-is-to.html. |
| [45] |
Gatzert N (2015) The impact of corporate reputation and reputation damaging events on financial performance: Empirical evidence from the literature. Eur Manag J 33: 485–499. https://doi.org/10.1016/J.EMJ.2015.10.001 doi: 10.1016/J.EMJ.2015.10.001
|
| [46] |
Gupta MC (1995) Environmental management and its impact on the operations function. Int J Oper Prod Manag 15: 34–51. https://doi.org/10.1108/01443579510094071 doi: 10.1108/01443579510094071
|
| [47] |
Habib AM (2023a) Do business strategies and environmental, social, and governance (ESG) performance mitigate the likelihood of financial distress? A multiple mediation model. Heliyon 9: e17847. https://doi.org/10.1016/J.HELIYON.2023.E17847 doi: 10.1016/J.HELIYON.2023.E17847
|
| [48] |
Habib AM (2023b) Does real earnings management affect a firm's environmental, social, and governance (ESG), financial performance, and total value? A moderated mediation analysis. Environ Dev Sustain, 1–30. https://doi.org/10.1007/s10668-023-03809-6 doi: 10.1007/s10668-023-03809-6
|
| [49] | Habib AM (2024) Financial Development and Corporate Governance Efficiency: An Overview of MENA. In: Transformations in banking, finance and regulation, 147–169. https://doi.org/10.1142/9781800614734_0006 |
| [50] |
Habib AM, Mourad N (2023b) Analyzing the efficiency of intellectual capital: a new approach based on DEA-MPI technology. Benchmarking. https://doi.org/10.1108/BIJ-06-2022-0384 doi: 10.1108/BIJ-06-2022-0384
|
| [51] |
Habib AM, Mourad N (2023a) The Influence of Environmental, Social, and Governance (ESG) Practices on US Firms' Performance: Evidence from the Coronavirus Crisis. J Knowl Econ 15: 2549–2570. https://doi.org/10.1007/s13132-023-01278-w doi: 10.1007/s13132-023-01278-w
|
| [52] |
Habib AM, Yang Gl, Cui Y (2024) Do competitive strategies affect working capital management efficiency? Bus Process Manag J. https://doi.org/10.1108/BPMJ-12-2023-0953 doi: 10.1108/BPMJ-12-2023-0953
|
| [53] |
Hainmueller J, Hazlett C (2014) Kernel regularized least squares: Reducing misspecification bias with a flexible and interpretable machine learning approach. Polit Anal 22: 143–168. https://doi.org/10.1093/pan/mpt019 doi: 10.1093/pan/mpt019
|
| [54] |
Hamdan AMM, Al Mubarak MMS (2017) The impact of board independence on accounting-based performance: Evidence from Saudi Arabia and Bahrain. J Econo Admin Sci 33: 114–130. https://doi.org/10.1108/JEAS-03-2017-0012 doi: 10.1108/JEAS-03-2017-0012
|
| [55] |
Handoyo S, Anas S (2024) The effect of environmental, social, and governance (ESG) on firm performance: the moderating role of country regulatory quality and government effectiveness in ASEAN. Cogent Bus Manag 11: 2371071. https://doi.org/10.1080/23311975.2024.2371071 doi: 10.1080/23311975.2024.2371071
|
| [56] |
Hanousek J, Kočenda E, Shamshur A (2015) Corporate efficiency in Europe. J Corp Financ 32: 24–40. https://doi.org/10.1016/J.JCORPFIN.2015.03.003 doi: 10.1016/J.JCORPFIN.2015.03.003
|
| [57] |
Hanson D, Usa JF, Koller T, et al. (2013) Responsible Investors: Who They Are, What They Want. J Appl Corp Financ 25: 44–49. https://doi.org/10.1111/JACF.12027 doi: 10.1111/JACF.12027
|
| [58] |
Hasan I, Kobeissi N, Liu L, et al. (2016) Corporate Social Responsibility and Firm Financial Performance: The Mediating Role of Productivity. J Bus Ethics 149: 671–688. https://doi.org/10.1007/S10551-016-3066-1 doi: 10.1007/S10551-016-3066-1
|
| [59] |
Hong M, Drakeford B, Zhang K (2020) The impact of mandatory CSR disclosure on green innovation: evidence from China. Green Financ 2: 302–322. https://doi.org/10.3934/GF.2020017 doi: 10.3934/GF.2020017
|
| [60] |
Hua L (2023) Financial stability influence on climate risk, GHG emission, and green economic recovery of China. Environ Sci Pollut Res 30: 67839–67853. https://doi.org/10.1007/S11356-023-26947-W/TABLES/8 doi: 10.1007/S11356-023-26947-W/TABLES/8
|
| [61] |
Jamali H, Sutrisno T, Subekti I, et al. (2017) The influence of corporate governance and corporate social responsibility on financial performance with efficiency as mediating variable. Int J Bus Manag Invent 4: 1–10. https://doi.org/10.31227/osf.io/t796p doi: 10.31227/osf.io/t796p
|
| [62] |
Javed M, Rashid MA, Hussain G, et al. (2020) The effects of corporate social responsibility on corporate reputation and firm financial performance: Moderating role of responsible leadership. Corp Soc Resp Env Manag 27: 1395–1409. https://doi.org/10.1002/CSR.1892 doi: 10.1002/CSR.1892
|
| [63] |
Jing Z, Hossain GMS, Rahman MS, et al. (2023) Does corporate reputation play a mediating role in the association between manufacturing companies' corporate social responsibility (CSR) and financial performance? Green Financ 5: 240–264. https://doi.org/10.3934/GF.2023010 doi: 10.3934/GF.2023010
|
| [64] |
Joseph A, Shrivastava M (2024) Measuring The Return On Investment (ROI) Of Employee Retention Efforts At SG Pvt Ltd. Educ Admin Theory Pract 30: 3451–3457. https://doi.org/10.53555/kuey.v30i4.2055 doi: 10.53555/kuey.v30i4.2055
|
| [65] |
Junaid M, Xue Y, Syed MW, et al. (2020) Corporate governance mechanism and performance of insurers in Pakistan. Green Financ 2: 243–262. https://doi.org/10.3934/GF.2020014 doi: 10.3934/GF.2020014
|
| [66] |
Kalia D, Aggarwal D (2023) Examining impact of ESG score on financial performance of healthcare companies. J Glob Responsib 14: 155–176. https://doi.org/10.1108/JGR-05-2022-0045 doi: 10.1108/JGR-05-2022-0045
|
| [67] |
Kartal MT, Kılıç Depren S, Pata UK, et al. (2024) Modeling the link between environmental, social, and governance disclosures and scores: the case of publicly traded companies in the Borsa Istanbul Sustainability Index. Financ Innov 10: 80. https://doi.org/10.1186/s40854-024-00619-1 doi: 10.1186/s40854-024-00619-1
|
| [68] |
Karwowski M, Raulinajtys-Grzybek M (2021) The application of corporate social responsibility (CSR) actions for mitigation of environmental, social, corporate governance (ESG) and reputational risk in integrated reports. Corp Soc Resp Env Manag 28: 1270–1284. https://doi.org/10.1002/CSR.2137 doi: 10.1002/CSR.2137
|
| [69] |
Khan RU, Arif H, Sahar NE, et al. (2022) The role of financial resources in SMEs' financial and environmental performance; the mediating role of green innovation. Green Financ 4: 36-53. https://doi.org/10.3934/GF.2022002 doi: 10.3934/GF.2022002
|
| [70] |
Khan U, Liu W (2023) The link between green innovations, corporate performance, ESG activities, and sharing economy. Environ Sci Pollut Res 30: 78763–78775. https://doi.org/10.1007/s11356-023-27722-7 doi: 10.1007/s11356-023-27722-7
|
| [71] |
Khoury REL, Naimy V, Iskandar S (2021) ESG Versus Corporate Financial Performance: Evidence from East Asian Firms in the Industrials Sector. Stud Appl Econ 39. https://doi.org/10.25115/EEA.V39I3.4457 doi: 10.25115/EEA.V39I3.4457
|
| [72] |
King AA, Lenox MJ (2001) Does It Really Pay to Be Green? An Empirical Study of Firm Environmental and Financial Performance: An Empirical Study of Firm Environmental and Financial Performance. J Ind Ecol 5: 105–116. https://doi.org/10.1162/108819801753358526 doi: 10.1162/108819801753358526
|
| [73] |
Kuo KC, Lu WM, Ganbaatar O (2023) Sustainability and profitability efficiencies: the moderating role of corporate social responsibility. Int T Oper Res 30: 2506–2527. https://doi.org/10.1111/ITOR.13152 doi: 10.1111/ITOR.13152
|
| [74] |
Kurt H, Peng X (2021) Does corporate social performance lead to better financial performance? Evidence from Turkey. Green Financ 3: 464–482. https://doi.org/10.3934/GF.2021021 doi: 10.3934/GF.2021021
|
| [75] |
Lee MT, Raschke RL, Krishen AS (2022) Signaling green! firm ESG signals in an interconnected environment that promote brand valuation. J Bus Res 138: 1–11. https://doi.org/10.1016/J.JBUSRES.2021.08.061 doi: 10.1016/J.JBUSRES.2021.08.061
|
| [76] |
Lee SP, Isa M (2020) Environmental, social and governance (ESG) practices and performance in Shariah firms: Agency or stakeholder theory? Asian Acad Manag J A 16: 1–34. https://doi.org/10.21315/aamjaf2020.16.1.1 doi: 10.21315/aamjaf2020.16.1.1
|
| [77] |
Li Z, Liao G, Albitar K (2020) Does corporate environmental responsibility engagement affect firm value? The mediating role of corporate innovation. Bus Strateg Environ 29: 1045–1055. https://doi.org/10.1002/bse.2416 doi: 10.1002/bse.2416
|
| [78] |
Lin C, Ma Y, Su D (2009) Corporate governance and firm efficiency: evidence from China's publicly listed firms. Manag Decis Econ 30: 193–209. https://doi.org/10.1002/MDE.1447 doi: 10.1002/MDE.1447
|
| [79] |
Lin Y, Wu LY (2014) Exploring the role of dynamic capabilities in firm performance under the resource-based view framework. J Bus Res 67: 407–413. https://doi.org/10.1016/j.jbusres.2012.12.019 doi: 10.1016/j.jbusres.2012.12.019
|
| [80] | Litvinova TN, Saipidinov IM, Toshpulatov AS, et al. (2023) The contribution of ESG management to the improvement of energy efficiency of green business in Russia and Central Asia. In: Environmental footprints and eco-design of products and processes, 429–437. Cham: Springer International Publishing. https://doi.org/10.1007/978-3-031-46525-3_45 |
| [81] |
Liu H, Wu K, Zhou Q (2022) Whether and How ESG Impacts on Corporate Financial Performance in the Yangtze River Delta of China. Sustainability 14: 16584. https://doi.org/10.3390/SU142416584 doi: 10.3390/SU142416584
|
| [82] |
Liu M, Guo T, Ping W, et al. (2023) Sustainability and stability: Will ESG investment reduce the return and volatility spillover effects across the Chinese financial market? Energ Econ 121: 106674. https://doi.org/10.1016/j.eneco.2023.106674 doi: 10.1016/j.eneco.2023.106674
|
| [83] |
Liu Y, Miletkov MK, Wei Z, et al. (2015) Board independence and firm performance in China. J Corp Financ 30: 223–244. https://doi.org/10.1016/J.JCORPFIN.2014.12.004 doi: 10.1016/J.JCORPFIN.2014.12.004
|
| [84] |
Liu Z (2020) Unraveling the complex relationship between environmental and financial performance ─── A multilevel longitudinal analysis. Int J Product Econ 219: 328–340. https://doi.org/10.1016/J.IJPE.2019.07.005 doi: 10.1016/J.IJPE.2019.07.005
|
| [85] |
Long H, Feng GF, Gong Q, et al. (2023) ESG performance and green innovation: An investigation based on quantile regression. Bus Strateg Environ 32: 5102–5118. https://doi.org/10.1002/BSE.3410 doi: 10.1002/BSE.3410
|
| [86] |
Lu H, Liu X, Falkenberg L (2022) Investigating the Impact of Corporate Social Responsibility (CSR) on Risk Management Practices. Bus Soc 61: 496–534. https://doi.org/10.1177/0007650320928981 doi: 10.1177/0007650320928981
|
| [87] |
Lu WM, Kweh QL, Ting IWK, et al. (2023) How does stakeholder engagement through environmental, social, and governance affect eco-efficiency and profitability efficiency? Zooming into Apple Inc.'s counterparts. Bus Strateg Environ 32: 587–601. https://doi.org/10.1002/BSE.3162 doi: 10.1002/BSE.3162
|
| [88] |
Ma D, Zhai P, Zhang D, et al. (2024) Excess stock returns and corporate environmental performance in China. Financ Innovat 10: 41. https://doi.org/10.1186/s40854-023-00569-0 doi: 10.1186/s40854-023-00569-0
|
| [89] |
Maji SG, Lohia P (2023) Environmental, social and governance (ESG) performance and firm performance in India. Soc Bus Rev 18: 175–194. https://doi.org/10.1108/SBR-06-2022-0162 doi: 10.1108/SBR-06-2022-0162
|
| [90] |
Makridou G, Doumpos M, Lemonakis C (2023) Relationship between ESG and corporate financial performance in the energy sector: empirical evidence from European companies. Int J Energ Sect Manag 18: 873–895. https://doi.org/10.1108/IJESM-01-2023-0012 doi: 10.1108/IJESM-01-2023-0012
|
| [91] |
Malik N, Kashiramka S (2024) Impact of ESG disclosure on firm performance and cost of debt: Empirical evidence from India. J Clean Prod 448: 141582. https://doi.org/10.1016/j.jclepro.2024.141582 doi: 10.1016/j.jclepro.2024.141582
|
| [92] |
Mangalagiri J, Bhasa MP (2022) Corporate social responsibility and firm performance: evidence from India's national stock exchange listed companies. Int J Discl Gov 19: 144–152. https://doi.org/10.1057/S41310-021-00138-W/METRICS doi: 10.1057/S41310-021-00138-W/METRICS
|
| [93] |
Masongweni VV, Simo-Kengne BD (2024) The impact of sustainable investment on firm performance in South Africa. S Afr J Account Res 38: 146–173. https://doi.org/10.1080/10291954.2024.2306701 doi: 10.1080/10291954.2024.2306701
|
| [94] |
Mohieldin M, Wahba S, Gonzalez-Perez MA, et al. (2023) How Businesses Can Accelerate and Scale-Up SDG Implementation by Incorporating ESG into Their Strategies. Business, Government and the SDGs, 65–104. https://doi.org/10.1007/978-3-031-11196-9_3 doi: 10.1007/978-3-031-11196-9_3
|
| [95] |
Molina-Azorín JF, Claver-Cortés E, López-Gamero MD, et al. (2009) Green management and financial performance: A literature review. Manag Decis 47: 1080–1100. https://doi.org/10.1108/00251740910978313 doi: 10.1108/00251740910978313
|
| [96] |
Moskovics P, Wanke P, Tan Y, et al. (2024) Market structure, ESG performance, and corporate efficiency: Insights from Brazilian publicly traded companies. Bus Strateg Environ 33: 241–262. https://doi.org/10.1002/BSE.3492 doi: 10.1002/BSE.3492
|
| [97] |
Mumtaz MZ, Yoshino N (2023) Aftermarket performance of green IPOs and portfolio allocation. Green Financ 5: 321–342. https://doi.org/10.3934/GF.2023013 doi: 10.3934/GF.2023013
|
| [98] |
Nair PB, Wahh RWB (2017) Strategic CSR, reputational advantage and financial performance: A framework and case example. World J Sci Technol Sustain Dev 13: 37–55. https://doi.org/10.1504/WRSTSD.2017.083700 doi: 10.1504/WRSTSD.2017.083700
|
| [99] |
Narula R, Rao P, Kumar S, et al. (2024) ESG scores and firm performance- evidence from emerging market. Int Rev Econ Financ 89: 1170–1184. https://doi.org/10.1016/j.iref.2023.08.024 doi: 10.1016/j.iref.2023.08.024
|
| [100] |
Orlitzky M, Benjamin JD (2001) Corporate Social Performance and Firm Risk: A Meta-Analytic Review. Bus Soc 40: 369–396. https://doi.org/10.1177/000765030104000402 doi: 10.1177/000765030104000402
|
| [101] |
Paul K (2024) Why corporate social responsibility should be recognized as an integral stream of international corporate governance. Green Financ 6: 348–362. https://doi.org/10.3934/GF.2024013 doi: 10.3934/GF.2024013
|
| [102] |
Rahman HU, Zahid M, Al-Faryan MAS (2023) ESG and firm performance: The rarely explored moderation of sustainability strategy and top management commitment. J Clean Prod 404: 136859. https://doi.org/10.1016/j.jclepro.2023.136859 doi: 10.1016/j.jclepro.2023.136859
|
| [103] |
Ramirez AG. Monsalve J, González-Ruiz JD, et al. (2022) Relationship between the cost of capital and environmental, social, and governance scores: Evidence from latin america. Sustainability 14: 5012. https://doi.org/10.3390/su14095012 doi: 10.3390/su14095012
|
| [104] |
Saha S, Hasan AR, Islam KR, et al. (2024) Sustainable Development Goals (SDGs) practices and firms' financial performance: Moderating role of country governance. Green Financ 6: 162–198. https://doi.org/10.3934/GF.2024007 doi: 10.3934/GF.2024007
|
| [105] |
Sarkar S (2022) Performance Evaluation Of ESG Funds In India – A Study. Manag Account J 57: 40. https://doi.org/10.33516/maj.v57i3.40-47p doi: 10.33516/maj.v57i3.40-47p
|
| [106] |
Șerban RA, Mihaiu DM, Țichindelean M (2022) Environment, Social, and Governance Score and Value Added Impacts on Market Capitalization: A Sectoral‐Based Approach. Sustainability 14: 2069. https://doi.org/10.3390/SU14042069/S1 doi: 10.3390/SU14042069/S1
|
| [107] |
Shaikh I (2022) Environmental, social, and governance (ESG) practice and firm performance: international evidence. J Bus Econ Manag 23: 218–237. https://doi.org/10.3846/jbem.2022.16202 doi: 10.3846/jbem.2022.16202
|
| [108] |
Shan YG (2019) Managerial ownership, board independence and firm performance. Account Res J 32: 203–220. https://doi.org/10.1108/ARJ-09-2017-0149 doi: 10.1108/ARJ-09-2017-0149
|
| [109] |
Shi Y, Li X, Asal M (2023) Impact of sustainability on financial distress in the air transport industry: the moderating effect of Asia–Pacific. Financ Innovat 9: 97. https://doi.org/10.1186/s40854-023-00506-1 doi: 10.1186/s40854-023-00506-1
|
| [110] |
Smith PAC, Sharicz C (2011) The shift needed for sustainability. Learn Organ 18: 73–86. https://doi.org/10.1108/09696471111096019 doi: 10.1108/09696471111096019
|
| [111] |
Shobhwani K, Lodha S (2023) Impact of ESG risk scores on firm performance: An empirical analysis of NSE-100 companies. Asia Pac J Manag Res Innovat 19: 7–18. https://doi.org/10.1177/2319510X231170910 doi: 10.1177/2319510X231170910
|
| [112] |
Subramaniam PL, Iranmanesh M, Kumar KM, et al. (2020) The impact of multinational corporations' socially responsible supplier development practices on their corporate reputation and financial performance. Int J Phys Distr Log Manag 50: 3–25. https://doi.org/10.1108/IJPDLM-01-2019-0002 doi: 10.1108/IJPDLM-01-2019-0002
|
| [113] |
Suchman MC (1995) Managing Legitimacy: Strategic and Institutional Approaches. Acad Manag Rev 20: 571-610. https://doi.org/10.5465/amr.1995.9508080331 doi: 10.5465/amr.1995.9508080331
|
| [114] |
Tang Z, Hull CE, Rothenberg S (2012) How Corporate Social Responsibility Engagement Strategy Moderates the CSR–Financial Performance Relationship. J Manag Stud 49: 1274–1303. https://doi.org/10.1111/J.1467-6486.2012.01068.X doi: 10.1111/J.1467-6486.2012.01068.X
|
| [115] |
Tetrault Sirsly CA, Lamertz K (2007) When Does a Corporate Social Responsibility Initiative Provide a First-Mover Advantage? Bus Soc 47: 343–369. https://doi.org/10.1177/0007650307299221 doi: 10.1177/0007650307299221
|
| [116] |
Uribe-Bohorquez MV, Martínez-Ferrero J, García-Sánchez IM (2019) Women on boards and efficiency in a business-orientated environment. Corp Soc Resp Env Manag 26: 82–96. https://doi.org/10.1002/CSR.1659 doi: 10.1002/CSR.1659
|
| [117] |
Veeravel V, Sadharma EKS, Kamaiah B (2024) Do ESG disclosures lead to superior firm performance? A method of moments panel quantile regression approach. Corp Soc Resp Env Manag 31: 741–754. https://doi.org/10.1002/csr.2598 doi: 10.1002/csr.2598
|
| [118] |
Veltri S, Bruni ME, Iazzolino G, et al. (2023) Do ESG factors improve utilities corporate efficiency and reduce the risk perceived by credit lending institutions? An empirical analysis. Util Policy 81: 101520. https://doi.org/10.1016/J.JUP.2023.101520 doi: 10.1016/J.JUP.2023.101520
|
| [119] |
Wang L, Zhang Y, Qi C (2023) Does the CEOs' hometown identity matter for firms' environmental, social, and governance (ESG) performance? Environ Sci Pollut Res 30: 69054–69063. https://doi.org/10.1007/s11356-023-27349-8 doi: 10.1007/s11356-023-27349-8
|
| [120] |
Wasiuzzaman S, Ibrahim SA, Kawi F (2023) Environmental, social and governance (ESG) disclosure and firm performance: does national culture matter? Meditari Account Res 31: 1239–1265. https://doi.org/10.1108/MEDAR-06-2021-1356 doi: 10.1108/MEDAR-06-2021-1356
|
| [121] |
Wu KS, Chang BG (2022) The concave–convex effects of environmental, social and governance on high-tech firm value: Quantile regression approach. Corp Soc Resp Env Manag 29: 1527–1545. https://doi.org/10.1002/CSR.2289 doi: 10.1002/CSR.2289
|
| [122] |
Wu M, Xie D (2024) The impact of ESG performance on the credit risk of listed companies in Shanghai and Shenzhen stock exchanges. Green Financ 6: 199–218. https://doi.org/10.3934/GF.2024008 doi: 10.3934/GF.2024008
|
| [123] |
Wu W, Alkaraan F, Le C (2023) The moderating effects of corporate governance and investment efficiency on the nexus between financial flexibility and firm performance. J Financ Report Account. https://doi.org/10.1108/JFRA-05-2023-0234 doi: 10.1108/JFRA-05-2023-0234
|
| [124] |
Wu W, Le C, Shi Y, et al. (2024) The influence of financial flexibility on firm performance: the moderating effects of investment efficiency and investment scale. J Appl Account Res. https://doi.org/10.1108/JAAR-07- 2023-0192 doi: 10.1108/JAAR-07-2023-0192
|
| [125] |
Wu Z, Gao J, Luo C, et al. (2024) How does boardroom diversity influence the relationship between ESG and firm financial performance? Int Rev Econ Financ 89: 713–730. https://doi.org/10.1016/j.iref.2023.10.045 doi: 10.1016/j.iref.2023.10.045
|
| [126] |
Xie J, Nozawa W, Yagi M, et al. (2019) Do environmental, social, and governance activities improve corporate financial performance? Bus Strateg Environ 28: 286–300. https://doi.org/10.1002/BSE.2224 doi: 10.1002/BSE.2224
|
| [127] |
Yeh TT, Yuanzhang X, Shirley JD (2024) Stakeholder influences on management control systems for ESG governance and reporting in the global automotive industry. J Corp Account Financ 35: 103–120. https://doi.org/10.1002/jcaf.22671 doi: 10.1002/jcaf.22671
|
| [128] |
Zheka V (2005) Corporate governance, ownership structure and corporate efficiency: the case of Ukraine. Manag Decis Econ 26: 451–460. https://doi.org/10.1002/MDE.1258 doi: 10.1002/MDE.1258
|
| [129] |
Zhou R, Hou J, Ding F (2023). Understanding the nexus between environmental, social, and governance (ESG) and financial performance: Evidence from Chinese-listed companies. Environ Sci Pollut Res 30: 73231–73253. https://doi.org/10.1007/s11356-023-27449-5 doi: 10.1007/s11356-023-27449-5
|


Figures(7) / Tables(12)

Abhisek Mahanta, Naresh Chandra Sahu, Pradeep Kumar Behera, Pushp Kumar. Variations in financial performance of firms with ESG integration in business: The mediating role of corporate efficiency using DEA[J]. Green Finance, 2024, 6(3): 518-562. doi: 10.3934/GF.2024020


 DownLoad: