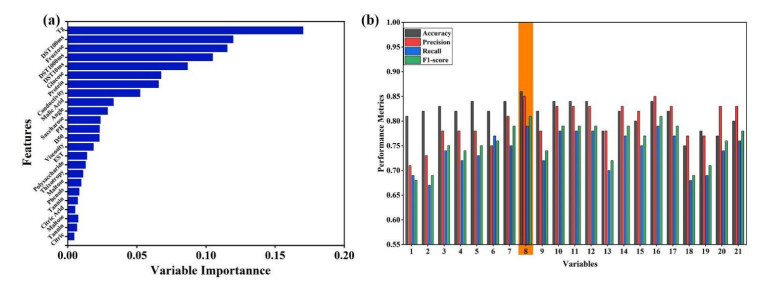
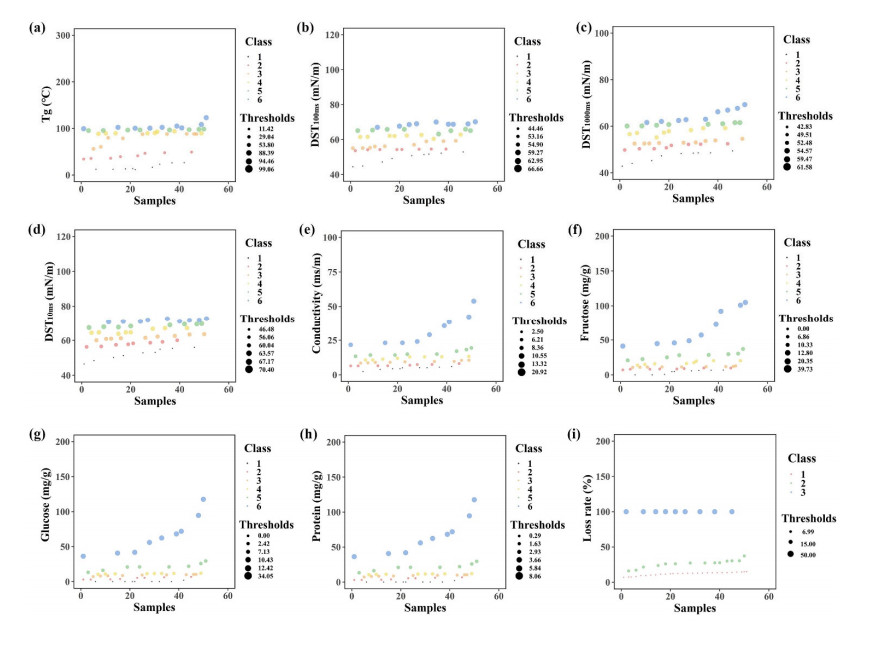
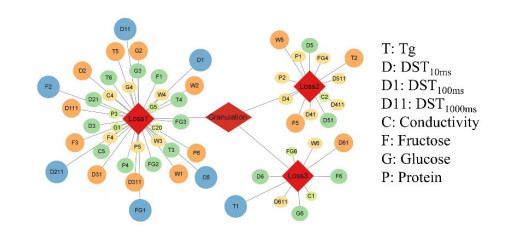
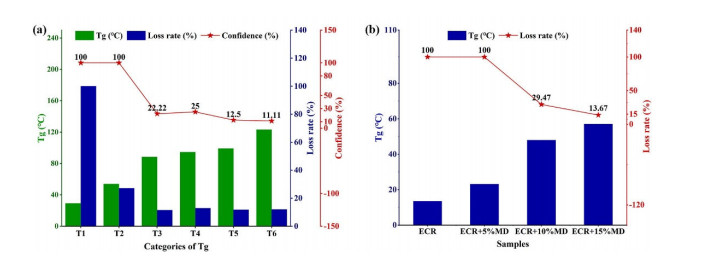
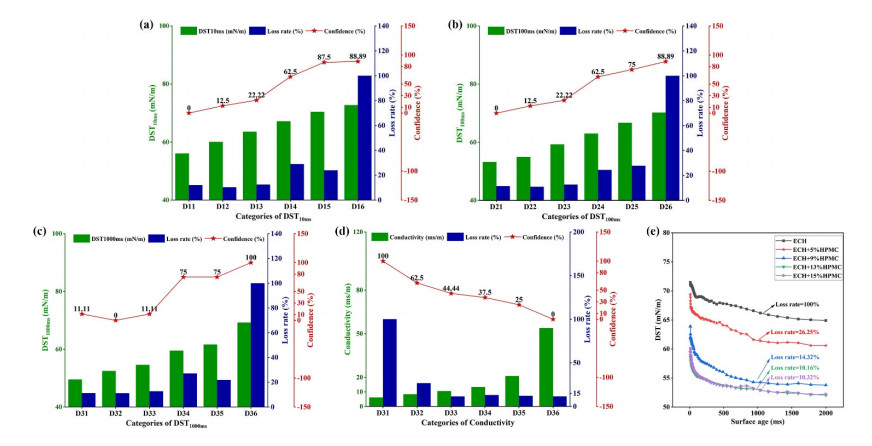
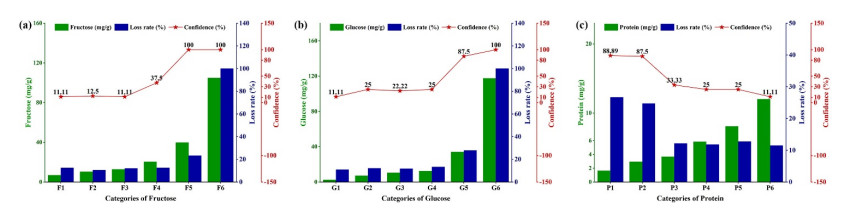
Fluidized bed granulation (FBG) is a widely used granulation technology in the pharmaceutical industry. However, defluidization caused by the formation of large aggregates poses a challenge to FBG, particularly in traditional Chinese medicine (TCM) due to its complex physicochemical properties of aqueous extracts. Therefore, this study aims to identify the complex relationships between physicochemical characteristics and defluidization using data mining methods. Initially, 50 types of TCM were decocted and assessed for their potential influence on defluidization using a set of 11 physical properties and 10 chemical components, utilizing the loss rate as an evaluation index. Subsequently, the random forest (RF) and Apriori algorithms were utilized to uncover intricate association rules among physicochemical characteristics and defluidization. The RF algorithm analysis revealed the top 8 critical factors associated with defluidization. These factors include physical properties like glass transition temperature (Tg) and dynamic surface tension (DST) of DST100ms, DST1000ms, DST10ms and conductivity, in addition to chemical components such as fructose, glucose and protein contents. The results from Apriori algorithm demonstrated that lower Tg and conductivity were associated with an increased risk of defluidization, resulting in a higher loss rate. Moreover, DST100ms, DST1000ms and DST10ms exhibited a contrasting trend in the physical properties Specifically, defluidization probability increases when Tg and conductivity dip below 29.04℃ and 6.21 ms/m respectively, coupled with DST10ms, DST100ms and DST1000ms values exceeding 70.40 mN/m, 66.66 mN/m and 61.58 mN/m, respectively. Moreover, an elevated content of low molecular weight saccharides was associated with a higher occurrence of defluidization, accompanied by an increased loss rate. In contrast, protein content displayed an opposite trend regarding chemical properties. Precisely, the defluidization likelihood amplifies when fructose and glucose contents surpass 20.35 mg/g and 34.05 mg/g respectively, and protein concentration is less than 1.63 mg/g. Finally, evaluation criteria for defluidization were proposed based on these results, which could be used to avoid this situation during the granulation process. This study demonstrated that the RF and Apriori algorithms are effective data mining methods capable of uncovering key factors affecting defluidization.
Citation: Sai Fu, Yuting Luo, Yuling Liu, Qian Liao, Shasha Kong, Anhui Yang, Longfei Lin, Hui Li. Mining association rules between the granulation feasibility and physicochemical properties of aqueous extracts from Chinese herbal medicine in fluidized bed granulation[J]. Mathematical Biosciences and Engineering, 2023, 20(11): 19065-19085. doi: 10.3934/mbe.2023843
Fluidized bed granulation (FBG) is a widely used granulation technology in the pharmaceutical industry. However, defluidization caused by the formation of large aggregates poses a challenge to FBG, particularly in traditional Chinese medicine (TCM) due to its complex physicochemical properties of aqueous extracts. Therefore, this study aims to identify the complex relationships between physicochemical characteristics and defluidization using data mining methods. Initially, 50 types of TCM were decocted and assessed for their potential influence on defluidization using a set of 11 physical properties and 10 chemical components, utilizing the loss rate as an evaluation index. Subsequently, the random forest (RF) and Apriori algorithms were utilized to uncover intricate association rules among physicochemical characteristics and defluidization. The RF algorithm analysis revealed the top 8 critical factors associated with defluidization. These factors include physical properties like glass transition temperature (Tg) and dynamic surface tension (DST) of DST100ms, DST1000ms, DST10ms and conductivity, in addition to chemical components such as fructose, glucose and protein contents. The results from Apriori algorithm demonstrated that lower Tg and conductivity were associated with an increased risk of defluidization, resulting in a higher loss rate. Moreover, DST100ms, DST1000ms and DST10ms exhibited a contrasting trend in the physical properties Specifically, defluidization probability increases when Tg and conductivity dip below 29.04℃ and 6.21 ms/m respectively, coupled with DST10ms, DST100ms and DST1000ms values exceeding 70.40 mN/m, 66.66 mN/m and 61.58 mN/m, respectively. Moreover, an elevated content of low molecular weight saccharides was associated with a higher occurrence of defluidization, accompanied by an increased loss rate. In contrast, protein content displayed an opposite trend regarding chemical properties. Precisely, the defluidization likelihood amplifies when fructose and glucose contents surpass 20.35 mg/g and 34.05 mg/g respectively, and protein concentration is less than 1.63 mg/g. Finally, evaluation criteria for defluidization were proposed based on these results, which could be used to avoid this situation during the granulation process. This study demonstrated that the RF and Apriori algorithms are effective data mining methods capable of uncovering key factors affecting defluidization.

| [1] |
S. M. Iveson, J. D. Litster, K. Hapgood, B. J. Ennis, Nucleation, growth and breakage phenomena in agitated wet granulation processes: A review, Powder Technol., 117 (2001), 3–39. https://doi.org/10.1016/S0032-5910(01)00313-8 doi: 10.1016/S0032-5910(01)00313-8

|
| [2] |
S. V. Moraga, M. P. Villa, D. E. Bertín, I. M. Cotabarren, J. Piña, M. Pedernera, et al., Fluidized-bed melt granulation: The effect of operating variables on process performance and granule properties, Powder Technol., 286 (2015), 654–667. https://doi.org/10.1016/j.powtec.2015.09.006 doi: 10.1016/j.powtec.2015.09.006
|
| [3] |
G. Strenzke, R. Dürr, A. Bück, E. Tsotsas, Influence of operating parameters on process behavior and product quality in continuous spray fluidized bed agglomeration, Powder Technol., 375 (2020), 210–220. https://doi.org/10.1016/j.powtec.2020.07.083 doi: 10.1016/j.powtec.2020.07.083
|
| [4] |
H. Aziz, S. N. Ahsan, G. De Simone, Y. J. Gao, B. Chaudhuri, Computational modeling of drying of pharmaceutical wet granules in a fluidized bed dryer using coupled CFD-DEM approach, AAPS PharmSciTech, 59 (2022). https://doi.org/10.1208/s12249-021-02180-x doi: 10.1208/s12249-021-02180-x
|
| [5] |
K. Vorlander, L. Bahlmann, A. Kwade, J. H. Finke, I. Kampen, Effect of process parameters, protectants and carrier materials on the survival of yeast cells during fluidized bed granulation for tableting, Pharmaceutics, 15 (2023), 884. https://doi.org/10.3390/pharmaceutics15030884 doi: 10.3390/pharmaceutics15030884
|
| [6] | ICH Harmonised Tripartite Guideline Pharmaceutical Development Q8 R2 Guideline; ICH: Geneva, Switzerland, 2009, 1–24. |
| [7] |
F. Sun, B. Xu, S. Dai, Y. Zhang, Z. Lin, Y. Qiao, A novel framework to aid the development of design space across multi-unit operation pharmaceutical processes—A case study of panax notoginseng saponins immediate release tablet, Pharmaceutics, 11 (2019), 474. https://doi.org/10.3390/pharmaceutics11090474 doi: 10.3390/pharmaceutics11090474
|
| [8] |
L. S. Ming, Z. Li, F. Wu, R. F. Du, Y. Feng, A two-step approach for fluidized bed granulation in pharmaceutical processing: Assessing different models for design and control, PloS One, 12 (2017). https://doi.org/10.1371/journal.pone.0180209 doi: 10.1371/journal.pone.0180209
|
| [9] |
J. Krzywanski, D. Urbaniak, H. Otwinowski, T. Wylecial, M. Sosnowski, Fluidized bed jet milling process optimized for mass and particle size with a fuzzy logic approach, Materials, 13 (2020), 3303. https://doi.org/10.3390/ma13153303 doi: 10.3390/ma13153303
|
| [10] |
M. Sen, D. Barrasso, R. Singh, R. Ramachandran, A multi-scale hybrid CFD-DEM-PBM description of a fluid-bed granulation process, Processes, 2 (2014), 89–111. https://doi.org/10.3390/pr2010089 doi: 10.3390/pr2010089
|
| [11] |
H. Aoki, Y. Hattori, T. Sasaki, M. Otsuka, Comparative study on the real-time monitoring of a fluid bed drying process of extruded granules using near-infrared spectroscopy and audible acoustic emission, Int. J. Pharm., 619 (2022), 121689. https://doi.org/10.1016/j.ijpharm.2022.121689 doi: 10.1016/j.ijpharm.2022.121689
|
| [12] |
M. Nadda, S. K. Shah, S. Roy, A. Yadav, CFD-based deep neural networks (DNN) model for predicting the hydrodynamics of fluidized beds, Digit. Chem. Eng., 8 (2023), 100113. https://doi.org/10.1016/j.dche.2023.100113 doi: 10.1016/j.dche.2023.100113
|
| [13] |
A. Tamrakar, R. Ramachandran, CFD-DEM-PBM coupled model development and validation of a 3D top-spray fluidized bed wet granulation process, Chem. Eng. Sci., 125 (2019), 249–270. https://doi.org/10.1016/j.compchemeng.2019.01.023 doi: 10.1016/j.compchemeng.2019.01.023
|
| [14] |
S. V. Muddu, A. Tamrakar, P. Pandey, R. Ramachandran, Model development and validation of fluid bed wet granulation with dry binder addition using a population balance model methodology, Processes, 6 (2018), 154. https://doi.org/10.3390/pr6090154 doi: 10.3390/pr6090154
|
| [15] |
K. K. Win, W. Nowak, H. Matsuda, M. Hasatani, Z. Bis, J. Krzywanski, et al., Transport velocity of coarse particles in multi-solid fluidized bed, JCEJ, 28 (1995), 535–540. https://doi.org/10.1252/jcej.28.535 doi: 10.1252/jcej.28.535
|
| [16] |
J. Liu, T. Liu, G. Mu, J. Chen, Wavelet based calibration model building of NIR spectroscopy for in-situ measurement of granule moisture content during fluidized bed drying, Chem. Eng. Sci., 226 (2020), 115867. https://doi.org/10.1016/j.ces.2020.115867 doi: 10.1016/j.ces.2020.115867
|
| [17] |
R. F. Nascimento, M. F. Ávila, A. G. P. da Silva, O. P. Taranto, L. E. Kurozawa, The formation of solid bridges during agglomeration in a fluidized bed: Investigation by Raman spectroscopy and image analyses, Powder Technol., 420 (2023), 118377. https://doi.org/10.1016/j.powtec.2023.118377 doi: 10.1016/j.powtec.2023.118377
|
| [18] |
H. Otwinowski, J. Krzywanski, D. Urbaniak, T. Wylecial, M. Sosnowski, Comprehensive knowledge-driven ai system for air classification process, Materials, 15 (2021), 45. https://doi.org/10.3390/ma15010045 doi: 10.3390/ma15010045
|
| [19] |
V. Todaro, A. M, Healy Development and characterization of ibuprofen co-crystals granules prepared via fluidized bed granulation in a one-step process–A design of experiment approach, Drug Dev. Ind. Pharm., 47 (2021), 292–301. https://doi.org/10.1080/03639045.2021.1879836 doi: 10.1080/03639045.2021.1879836
|
| [20] |
K. Kramm, M. Orth, A. Teiwes, J. C. Kammerhofer, V. Meunier, S. Pietsch‐Braune, et al., Influence of nozzle parameters on spray pattern and droplet characteristics for a two‐fluid nozzle, Chem. Ing. Tech., 95 (2023), 151–159. https://doi.org/10.1002/cite.202200152 doi: 10.1002/cite.202200152
|
| [21] |
R. Xue, Y. Ruan, X. Liu, L. Chen, X. Zhang, Y. Hou, et al., Experimental study of liquid nitrogen spray characteristics in atmospheric environment, Appl. Therm. Eng., 142 (2018), 717–722. https://doi.org/10.1016/j.applthermaleng.2018.07.056 doi: 10.1016/j.applthermaleng.2018.07.056
|
| [22] |
P. D. Hede, P. Bach, A. D. Jensen Two-fluid spray atomisation and pneumatic nozzles for fluid bed coating/agglomeration purposes: A review, Chem. Eng. Sci., 63 (2008), 3821–3842. https://doi.org/10.1016/j.ces.2008.04.014 doi: 10.1016/j.ces.2008.04.014
|
| [23] | C. Vesvey, J. Cronlein, A. Breuer, S. Gerstner, Fluid bed nozzle spray characterization of an aqueous ethylcellulose dispersion for particle taste-masking applications, AAPS Poster Reprint, (2014), 3–6. |
| [24] |
R. Zhang, T. Hoffmann, E. Tsotsas, Novel technique for coating of fine particles using fluidized bed and aerosol atomizer, Processes, 8 (2020), 1525. https://doi.org/10.3390/pr8121525 doi: 10.3390/pr8121525
|
| [25] |
M. Orth, P. Kieckhefen, S. Pietsch, S. Heinrich, Correlating granule surface structure morphology and process conditions in fluidized bed layering spray granulation, KONA Powder Part. J., 39 (2022), 230–239. https://doi.org/10.14356/kona.2022016 doi: 10.14356/kona.2022016
|
| [26] |
R. Maharjan, S. H. Jeong Application of different models to evaluate the key factors of fluidized bed layering granulation and their influence on granule characteristics, Powder Technol., 408 (2022), 117737. https://doi.org/10.1016/j.powtec.2022.117737 doi: 10.1016/j.powtec.2022.117737
|
| [27] |
B. Düsenberg, A. K. Singh, J. Schmidt, A. Bück, Spray agglomeration of polymer particles: Influence of spray parameters on shape factors, Powder Technol., 422 (2023), 118491. https://doi.org/10.1016/j.powtec.2023.118491 doi: 10.1016/j.powtec.2023.118491
|
| [28] |
J. Tang, D. Chen, R. Wang, Study on the bed collapse in the shaping process of Shenmai granules, Pharm. Care Res., 21 (2020), 23–25. https://doi.org/10.5428/pcar20210105 doi: 10.5428/pcar20210105
|
| [29] |
P. Stähle, V. Gaukel, H. P. Schuchmann, Influence of feed viscosity on the two-phase flow inside the exit orifice of an effervescent atomizer and on resulting spray characteristics, Food Res. Int., 77 (2015), 55–62. https://doi.org/10.1016/j.foodres.2015.04.047 doi: 10.1016/j.foodres.2015.04.047
|
| [30] |
I. M. Andersson, M. Glantz, M. Alexander, A. Millqvist-Fureby, M. Paulsson, B. Bergenståhl, Impact of surface properties on morphology of spray-dried milk serum protein/lactose systems, Int. Dairy J., 85 (2018), 86–95. https://doi.org/10.1016/j.idairyj.2018.04.011 doi: 10.1016/j.idairyj.2018.04.011
|
| [31] |
M. Hemati, R. Cherif, K. Saleh, V. Pont. Fluidized bed coating and granulation: influence of process-related variables and physicochemical properties on the growth kinetics, Powder Technol., 130 (2003), 18–34. https://doi.org/10.1016/S0032-5910(02)00221-8 doi: 10.1016/S0032-5910(02)00221-8
|
| [32] |
T. Y. Du, J. C. Xu, S. N. Zhu, X. J. Yao, J. Guo, W. Q. Lv, Effects of spray drying, freeze drying, and vacuum drying on physicochemical and nutritional properties of protein peptide powder from salted duck egg white, Front. Nutr., 9 (2022). https://doi.org/10.3389/fnut.2022.1026903 doi: 10.3389/fnut.2022.1026903
|
| [33] |
Q. L. Shi, Z. X. Fang, B. Bhandari, Effect of addition of whey protein isolate on spray-drying behavior of honey with maltodextrin as a carrier material, Dry. Technol., 31 (2013), 1681–1692. https://doi.org/10.1080/07373937.2013.783593 doi: 10.1080/07373937.2013.783593
|
| [34] |
A. C. Karaca, O. Guzel, M. M. Ak, Effects of processing conditions and formulation on spray drying of sour cherry juice concentrate, J. Sci. Food Agric., 96 (2016), 449–455. https://doi.org/10.1002/jsfa.7110 doi: 10.1002/jsfa.7110
|
| [35] |
H. Cheng, C. H. Lu, G. F. Xu, L. J. Zhao, M. Lu, Y. J. Wang, Optimization of spray-drying process parameters to study anti-sticking effect of hydroxypropyl methyl cellulose-VLV on corni fructus extracts, AAPS PharmSciTech, 23 (2022). https://doi.org/10.1208/s12249-022-02215-x doi: 10.1208/s12249-022-02215-x
|
| [36] |
J. Zeng, L. S. Ming, J. M. Wang, T. Huang, B. B. Liu, L. L. Feng, et al., Empirical prediction model-based process optimization for droplet size and spraying angle during pharmaceutical fluidized bed granulation, Pharm. Devt. Technol., 25 (2020), 720–728. https://doi.org/10.1080/10837450.2020.1738461 doi: 10.1080/10837450.2020.1738461
|
| [37] | H. Liu, Q. Zhang, J. Wang, J. Wu, H. Cui, Determination of six main components of organic acids in eight medicines by HPLC, J. Chin. Med. Mater., 40 (2017), 1130–1133. |
| [38] | H. Qu, C. Feng, M. Xie, J. Zhu, Y. Sun, P. Cui, et al., Effect of different processing methods on the content of polygahatous polysaccharides, J. Hunan Univ. CM, 35 (2015), 53–55. |
| [39] |
G. Shanmugasundar, M. Vanitha, R. Čep, V. Kumar, K. Kalita, M. Ramachandran, A comparative study of linear, random forest and adaboost regressions for modeling non-traditional machining, Processes, 9 (2021), 2015. https://doi.org/10.3390/pr9112015 doi: 10.3390/pr9112015
|
| [40] |
R. García-Carretero, R. Holgado-Cuadrado, Ó. Barquero-Pérez, Assessment of classification models and relevant features on nonalcoholic steatohepatitis using random forest, Entropy, 23 (2021), 763. https://doi.org/10.3390/e23060763 doi: 10.3390/e23060763
|
| [41] |
L. W. Li, Y. P. Wu, Y. P. Huang, B. Li, M. F. S.Miao, Z. Q. Deng, Optimized apriori algorithm for deformation response analysis of landslide hazards, Comput. Geosci., 170 (2023), 105261. https://doi.org/10.1016/j.cageo.2022.105261 doi: 10.1016/j.cageo.2022.105261
|
| [42] |
Y. J. Wang, Y. L. Xie, D. S. Xu, X. Lin, Y. Feng, Y. L. Hong, Hydroxypropyl methylcellulose reduces particle adhesion and improves recovery of herbal extracts during spray drying of Chinese herbal medicines, Dry. Technol., 32 (2014), 557–566. https://doi.org/10.1080/07373937.2013.843543 doi: 10.1080/07373937.2013.843543
|
| [43] |
C. Avilés-Avilés, E. Dumoulin, C. Turchiuli, Fluidised bed agglomeration of particles with different glass transition temperatures, Powder Technol., 270 (2015), 445–452. https://doi.org/10.1016/j.powtec.2014.03.026 doi: 10.1016/j.powtec.2014.03.026
|
| [44] |
M. B. Braga, S. C. D. Rocha, M. D. Hubinger, Spray-Drying of milk-blackberry pulp mixture: Effect of carrier agent on the physical properties of powder, water sorption, and glass transition temperature, J. Food Sci., 83 (2018), 1650–1659. https://doi.org/10.1111/1750-3841.14187 doi: 10.1111/1750-3841.14187
|
| [45] |
P. D. Liu, J. X. Li, C. H. Lu, L. J. Zhao, X. Lin, Y. J. Wang, et al., Data mining-based detection of the physical and chemical characteristics of Chinese medical herbs aqueous decoction in spray drying yield, Dry. Technol., 39 (2021), 896–904. https://doi.org/10.1080/07373937.2020.1728304 doi: 10.1080/07373937.2020.1728304
|
| [46] |
S. Jafari, S. M. Jafari, M. Ebrahimi, I. Kijpatanasilp, K. Assatarakul, A decade overview and prospect of spray drying encapsulation of bioactives from fruit products: Characterization, food application and in vitro gastrointestinal digestion, Food Hydrocoll, 134 (2023). https://doi.org/10.1016/j.foodhyd.2022.108068 doi: 10.1016/j.foodhyd.2022.108068
|
| [47] |
Z. X. Fang, B. Bhandari, Comparing the efficiency of protein and maltodextrin on spray drying of bayberry juice, Food Res. Int., 48(2012), 478–483. https://doi.org/10.1016/j.foodres.2012.05.025 doi: 10.1016/j.foodres.2012.05.025
|
| [48] |
R. T. Hoskin, M. H. Grace, J. Xiong, M. A. Lila, Spray-drying microencapsulation of blackcurrant and cocoa polyphenols using underexplored plant-based protein sources, J. Food Sci., 88 (2023), 2665–2678. https://doi.org/10.1111/1750-3841.16590 doi: 10.1111/1750-3841.16590
|
Figures(8) / Tables(5)

Sai Fu, Yuting Luo, Yuling Liu, Qian Liao, Shasha Kong, Anhui Yang, Longfei Lin, Hui Li. Mining association rules between the granulation feasibility and physicochemical properties of aqueous extracts from Chinese herbal medicine in fluidized bed granulation[J]. Mathematical Biosciences and Engineering, 2023, 20(11): 19065-19085. doi: 10.3934/mbe.2023843


 DownLoad: