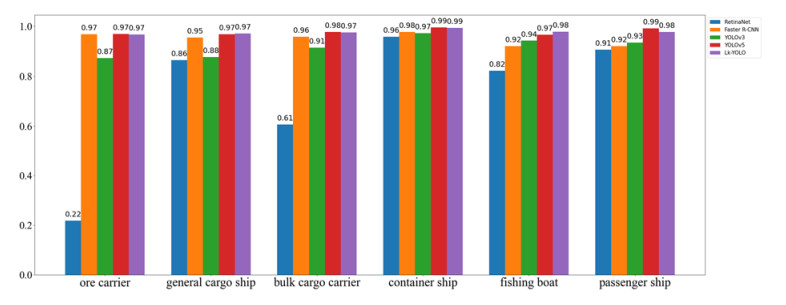
At present, ship detectors have many problems, such as too many hyperparameter, poor recognition accuracy and imprecise regression boundary. In this article, we designed a large kernel convolutional YOLO (Lk-YOLO) detection model based on Anchor free for one-stage ship detection. First, we discuss the introduction of large size convolution kernel in the residual module of the backbone network, so that the backbone network has a stronger feature extraction capability. Second, in order to solve the problem of conflict regression and classification fusion under the coupling of detection heads, we split the detection head into two branches, so that the detection head has better representation ability for different branches of the task and improves the accuracy of the model in regression tasks. Finally, in order to solve the problem of complex and computationally intensive anchor hyperparameter design of ship data sets, we use anchor free algorithm to predict ships. Moreover, the model adopts an improved sampling matching strategy for both positive and negative samples to expand the number of positive samples in GT (Ground Truth) while achieving high-quality sample data and reducing the imbalance between positive and negative samples caused by anchor. We used NVIDIA 1080Ti GPU as the experimental environment, and the results showed that the mAP@50 Reaching 97.7%, mAP@.5:.95 achieved 78.4%, achieving the best accuracy among all models. Therefore, the proposed method does not need to design the parameters of the anchor, and achieves better detection efficiency and robustness without hyperparameter input.
Citation: Shuaiwen Sun, Zhijing Xu. Large kernel convolution YOLO for ship detection in surveillance video[J]. Mathematical Biosciences and Engineering, 2023, 20(8): 15018-15043. doi: 10.3934/mbe.2023673
At present, ship detectors have many problems, such as too many hyperparameter, poor recognition accuracy and imprecise regression boundary. In this article, we designed a large kernel convolutional YOLO (Lk-YOLO) detection model based on Anchor free for one-stage ship detection. First, we discuss the introduction of large size convolution kernel in the residual module of the backbone network, so that the backbone network has a stronger feature extraction capability. Second, in order to solve the problem of conflict regression and classification fusion under the coupling of detection heads, we split the detection head into two branches, so that the detection head has better representation ability for different branches of the task and improves the accuracy of the model in regression tasks. Finally, in order to solve the problem of complex and computationally intensive anchor hyperparameter design of ship data sets, we use anchor free algorithm to predict ships. Moreover, the model adopts an improved sampling matching strategy for both positive and negative samples to expand the number of positive samples in GT (Ground Truth) while achieving high-quality sample data and reducing the imbalance between positive and negative samples caused by anchor. We used NVIDIA 1080Ti GPU as the experimental environment, and the results showed that the mAP@50 Reaching 97.7%, mAP@.5:.95 achieved 78.4%, achieving the best accuracy among all models. Therefore, the proposed method does not need to design the parameters of the anchor, and achieves better detection efficiency and robustness without hyperparameter input.

| [1] |
X. Xing, K. Ji, H. Zou, W. Chen, J. Sun, Ship classification in TerraSAR-X images with feature space based sparse representation, IEEE Geosci. Remote Sens. Lett., 10 (2013), 1562–1566. https://doi.org/10.1109/LGRS.2013.2262073 doi: 10.1109/LGRS.2013.2262073

|
| [2] |
J. Wei, P. Li, J. Yang, J. Zhang, F. Lang, A new automatic ship detection method using L-band polarimetric SAR imagery, IEEE J. Sel. Top. Appl. Earth Obs. Remote Sens., 7 (2017), 1383–1393. https://doi.org/10.1109/JSTARS.2013.2269996 doi: 10.1109/JSTARS.2013.2269996
|
| [3] |
M. Kang, K. Ji, X. Leng, Z. Lin, Contextual region-based convolutional neural network with multilayer fusion for SAR ship detection, Remote Sens., 9 (2017), 860. https://doi.org/10.3390/rs9080860 doi: 10.3390/rs9080860
|
| [4] |
T. Zhang, X. Zhang, A mask attention interaction and scale enhancement network for SAR ship instance segmentation, IEEE Geosci. Remote Sens. Lett., 19 (2022), 1–5. https://doi.org/10.1109/LGRS.2022.3189961 doi: 10.1109/LGRS.2022.3189961
|
| [5] |
Y. Feng, L. Wang, M. Zhang, A multi-scale target detection method for optical remote sensing images, Multimedia Tools Appl., 78 (2019), 8751–8766. https://doi.org/10.1007/s11042-018-6325-6 doi: 10.1007/s11042-018-6325-6
|
| [6] | Z. Li, D. Yang, Z. Chen, Multi-layer sparse coding based ship detection for remote sensing images, in IEEE International Conference on Information Reuse & Integration, (2015), 122–125. https://doi.org/10.1109/IRI.2015.28 |
| [7] |
X. Yang, H. Sun, K. Fu, J. Yang, X. Sun, M. Yan, et al., Automatic ship detection of remote sensing images from Google Earth in complex scenes based on multi-scale rotation dense feature pyramid networks, Remote Sens., 10 (2018), 132. https://doi.org/10.3390/rs10010132 doi: 10.3390/rs10010132
|
| [8] |
L. Ma, W. Xie, H. Huang, Convolutional neural network based obstacle detection for unmanned surface vehicle, Math. Biosci. Eng., 17 (2019), 845–861. https://doi.org/10.3934/mbe.2020045 doi: 10.3934/mbe.2020045
|
| [9] |
D. D. Bloisi, F. Previtali, A. Pennisi, D. Nardi, M. Fiorini, Enhancing automatic maritime surveillance systems with visual information, IEEE Trans. Intell. Transp. Syst., 18 (2017), 824–833. https://doi.org/10.1109/TITS.2016.2591321 doi: 10.1109/TITS.2016.2591321
|
| [10] | N. Dalal, B. Triggs, Histograms of oriented gradients for human detection, in IEEE Computer Society Conference on Computer Vision and Pattern Recognition, 1 (2005), 886–893. https://doi.org/10.1109/CVPR.2005.177 |
| [11] | P. F. Felzenszwalb, R. B. Girshick, D. McAllester, Cascade object detection with deformable part models, in IEEE Computer Society Conference on Computer Vision and Pattern Recognition (CVPR), (2010), 2241–2248. https://doi.org/10.1109/CVPR.2010.5539906 |
| [12] |
Z. Q. Zhao, P. Zheng, S. T. Xu, X. D. Wu, Object detection with deep learning: a review, IEEE Trans. Neural Networks Learn. Syst., 30 (2019) 3212–3232. https://doi.org/10.1109/TNNLS.2018.2876865 doi: 10.1109/TNNLS.2018.2876865
|
| [13] | A. Krizhevsky, I. Sutskever, G. E. Hinton, ImageNet classification with deep convolutional neural networks, in Proceedings of the Advances in Neural Information Processing Systems (NIPS), Lake Tahoe, NV, USA, 30 (2017), 1097–1105. https://doi.org/10.1145/3065386 |
| [14] | K. Simonyan, A. Zisserman, Very deep convolutional networks for large-scale image recognition, preprint, arXiv: 1409.1556. |
| [15] | R. Girshick, J. Donahue, T. Darrell, J. Malik, Rich feature hierarchies for accurate object detection and semantic segmentation, in Proceedings of the 2014 IEEE Conference on Computer Vision and Pattern Recognition, (2014), 580–587. https://doi.org/10.1109/CVPR.2014.81 |
| [16] | W. Liu, D. Anguelov, D. Erhan, C. Szegedy, S. Reed, C. Y. Fu, et al., SSD: single shot multibox detector, in Proceedings of the European Conference on Computer Vision, 9905 (2016), 21–37. https://doi.org/10.1007/978-3-319-46448-0_2 |
| [17] | J. Redmon, S. Divvala, R. Girshick, You only look once: unified, real-time object detection, in IEEE Conference on Computer Vision and Pattern Recognition (CVPR), (2016), 779–788. https://doi.org/10.1109/CVPR.2016.91 |
| [18] | R. Girshick, Fast R-CNN, in Proceedings of the International Conference on Computer Vision, (2015), 1440–1448. https://doi.org/10.1109/ICCV.2015.169 |
| [19] |
S. Ren, K. He, R. Girshick, J. Sun, Faster R-CNN: towards real-time object detection with region proposal networks, IEEE Trans. Pattern Anal. Mach. Intell., 39 (2017), 1137–1149. https://doi.org/10.1109/TPAMI.2016.2577031 doi: 10.1109/TPAMI.2016.2577031
|
| [20] | T. Lin, P. Goyal, R. Girshick, K. He, P. Dollar, Focal loss for dense object detection, in Proceedings of the IEEE International Conference on Computer Vision, 42 (2017), 2999–3007. https://doi.org/10.1109/TPAMI.2018.2858826 |
| [21] | T. Y. Lin, P. Dollár, R. Girshick, K. He, B. Hariharan, S. Belongie, Feature pyramid networks for object detection, in Proceedings of the IEEE Conference on Computer Vision and Pattern Recognition, (2017), 2117–2125. https://doi.org/10.1109/CVPR.2017.106 |
| [22] | S. Liu, L. Qi, H. Qin, J. Shi, J. Jia, Path aggregation network for instance segmentation, in Proceedings of the IEEE Conference on Computer Vision and Pattern Recognition, (2018), 8759–8768. https://doi.org/10.1109/CVPR.2018.00913 |
| [23] | G. Ghiasi, T. Lin, R. Pang, Q. Le, NAS-FPN: Learning scalable feature pyramid architecture for object detection, in Proceedings of the IEEE/CVF Conference on Computer Vision and Pattern Recognition, (2019), 7029–7038. https://doi.org/10.1109/CVPR.2017.106 |
| [24] | M. Tan, R. Pang, Q. V. Le, EfficientDet: Scalable and efficient object detection, in Proceedings of the IEEE/CVF Conference on Computer Vision and Pattern Recognition, (2020), 10778–10787. https://doi.org/10.1109/CVPR42600.2020.01079 |
| [25] | K. He, X. Zhang, S. Ren, J. Sun, Deep residual learning for image recognition, in 2016 IEEE Conference on Computer Vision and Pattern Recognition (CVPR), (2016), 770–778. https://doi.org/10.1109/CVPR.2016.90 |
| [26] | S. Xie, R. Girshick, P. Dollár, Z. Tu, K. He, Aggregated residual transformations for deep neural networks, in Proceedings of the IEEE Conference on Computer Vision and Pattern Recognition, (2017), 1492–1500. https://doi.org/10.1109/CVPR.2017.634 |
| [27] | L. Huang, Y. Yang, Y. Deng, Y. Yu, DenseBox: Unifying landmark localization with end to end object detection, preprint, arXiv: 1509.04874. |
| [28] | H. Law, J. Deng, CornerNet: Detecting objects as paired keypoints, in Proceedings of the European Conference on Computer Vision, (2020), 734–750. https://doi.org/10.1007/s11263-019-01204-1 |
| [29] | X. Zhou, D. Wang, P. Krähenbühl, Objects as points, preprint, arXiv: 1904.07850. |
| [30] | J. Redmon, A. Farhadi, YOLO9000: Better, faster, stronger, in 2017 IEEE Conference on Computer Vision and Pattern Recognition (CVPR), (2017), 6517–6525. https://doi.org/10.1109/CVPR.2017.690 |
| [31] | J. Redmon, A. Farhadi, YOLOv3: An incremental improvement, preprint, arXiv: 1804.02767. |
| [32] | J. Hu, L. Shen, G. Sun, Squeeze-and-excitation networks, in IEEE Conference on Computer Vision and Pattern Recognition, (2018), 7132–7141. https://doi.org/10.1109/CVPR.2018.00745 |
| [33] | S. Woo, J. Park, J. Y. Lee, I. S. Kweon, CBAM: convolutional block attention module, preprint, arXiv: 1807.06521. |
| [34] | A. Vaswani, N. Shazeer, N. Parmar, J. Uszkoreit, L. Jones, A. N. Gomez, et al., Attention is all you need, preprint, arXiv: 1706.03762. |
| [35] | A. Dosovitskiy, L. Beyer, A. Kolesnikov, D. Weissenborn, X. Zhai, T. Unterthiner, et al., An image is worth 16x16 words: Transformers for image recognition at scale, preprint, arXiv: 2010.11929. |
| [36] |
Z. Shao, W. Wu, Z. Wang, W. Du, C. Li, Seaships: a large-scale precisely annotated dataset for ship detection, IEEE Trans. Multimedia, 20 (2018), 2593–2604. https://doi.org/10.1109/TMM.2018.2865686 doi: 10.1109/TMM.2018.2865686
|
| [37] |
Z. Shao, L. Wang, Z. Wang, W. Du, W. Wu, Saliency-aware convolution neural network for ship detection in surveillance video, IEEE Trans. Circuits Syst. Video Technol., 30 (2020), 781–794. https://doi.org/10.1109/TCSVT.2019.2897980 doi: 10.1109/TCSVT.2019.2897980
|
| [38] |
H. Li, L. Deng, C. Yang, J. Liu, Z. Gu, Enhanced YOLOv3 tiny network for real-time ship detection from visual image, IEEE Access, 9 (2021), 16692–16706. https://doi.org/10.1109/ACCESS.2021.3053956 doi: 10.1109/ACCESS.2021.3053956
|
| [39] |
X. Han, L. N. Zhao, Y. Ning, J. F. Hu, ShipYOLO: An enhanced model for ship detection, J. Adv. Transp., 2021 (2021), 11. https://doi.org/10.1155/2021/1060182 doi: 10.1155/2021/1060182
|
| [40] |
J. H. Kim, N. Kim, Y. W. Park, C. S. Won, Object detection and classification based on YOLO-V5 with improved maritime dataset, J. Mar. Sci. Eng., 10 (2022), 377. https://doi.org/10.3390/jmse10030377 doi: 10.3390/jmse10030377
|
| [41] |
Z. Chen, D. Chen, Y. Zhang, X. Cheng, M. Zhang, C. Wu, Deep learning for autonomous ship-oriented small ship detection, Safety Sci., 130 (2020). https://doi.org/10.1016/j.ssci.2020.104812. doi: 10.1016/j.ssci.2020.104812
|
| [42] | Z. Tian, C. Shen, H. Chen, T. He, FCOS: Fully convolutional one-stage object detection, in 2019 IEEE/CVF International Conference on Computer Vision (ICCV), (2019), 9626–9635. https://doi.org/10.1109/ICCV.2019.00972 |
| [43] | S. Zhang, C. Chi, Y. Yao, Z. Lei, S. Z. Li, Bridging the gap between anchor-based and anchor-free detection via adaptive training sample selection, in 2020 IEEE/CVF Conference on Computer Vision and Pattern Recognition (CVPR), (2020), 9756–9765. https://doi.org/10.1109/CVPR42600.2020.00978 |
| [44] | Z. Ge, S. Liu, Z. Li, O. Yoshie, J. Sun, OTA: Optimal transport assignment for object detection, in IEEE/CVF Conference on Computer Vision and Pattern Recognition (CVPR), (2021), 303–312. https://doi.org/10.1109/CVPR46437.2021.00037 |


Figures(15) / Tables(4)

Shuaiwen Sun, Zhijing Xu. Large kernel convolution YOLO for ship detection in surveillance video[J]. Mathematical Biosciences and Engineering, 2023, 20(8): 15018-15043. doi: 10.3934/mbe.2023673


 DownLoad: