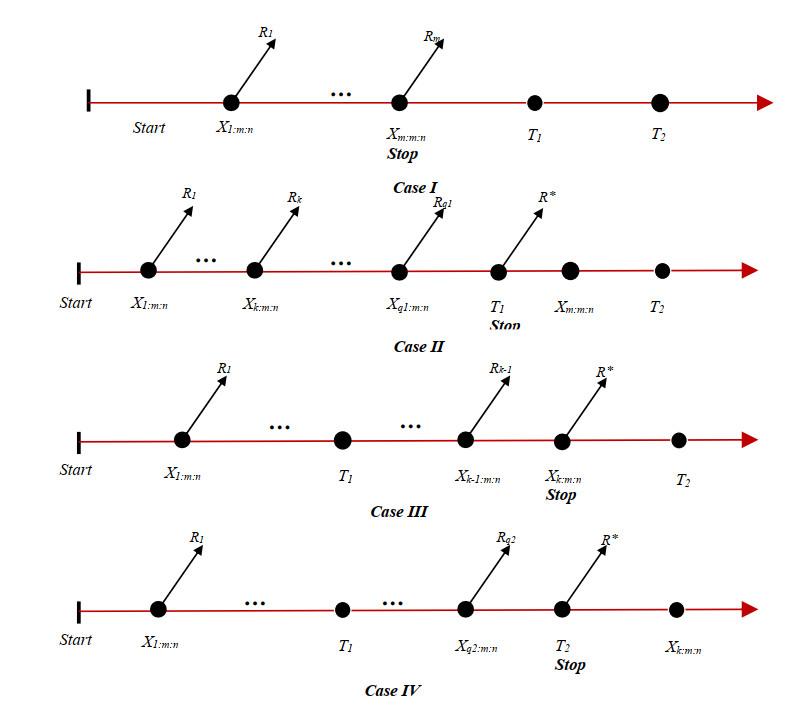
In this paper, we studied the estimation of a stress-strength reliability model ($R = P(X>Y)$) based on inverted exponentiated Rayleigh distribution under the unified progressive hybrid censoring scheme (unified PHCS). The maximum likelihood estimates of the unknown parameters were obtained using the stochastic expectation-maximization algorithm (stochastic EMA). The asymptotic confidence intervals were also created. Under squared error and Linex and generalized entropy loss functions, the Gibbs sampler together with Metropolis-Hastings algorithm was provided to compute the Bayes estimates and the credible intervals. Extensive simulations were performed to see the effectiveness of the proposed estimation methods. Also, parallel to the development of reliability studies, it is necessary to study its application in different sciences such as engineering. Therefore, droplet splashing data under two nozzle pressures were proposed to exemplify the theoretical outcomes.
Citation: Sadia Anwar, Showkat Ahmad Lone, Aysha Khan, Salmeh Almutlak. Stress-strength reliability estimation for the inverted exponentiated Rayleigh distribution under unified progressive hybrid censoring with application[J]. Electronic Research Archive, 2023, 31(7): 4011-4033. doi: 10.3934/era.2023204
In this paper, we studied the estimation of a stress-strength reliability model ($R = P(X>Y)$) based on inverted exponentiated Rayleigh distribution under the unified progressive hybrid censoring scheme (unified PHCS). The maximum likelihood estimates of the unknown parameters were obtained using the stochastic expectation-maximization algorithm (stochastic EMA). The asymptotic confidence intervals were also created. Under squared error and Linex and generalized entropy loss functions, the Gibbs sampler together with Metropolis-Hastings algorithm was provided to compute the Bayes estimates and the credible intervals. Extensive simulations were performed to see the effectiveness of the proposed estimation methods. Also, parallel to the development of reliability studies, it is necessary to study its application in different sciences such as engineering. Therefore, droplet splashing data under two nozzle pressures were proposed to exemplify the theoretical outcomes.

| [1] |
A. Childs, B. Chandrasekar, N. Balakrishnan, D. Kundu, Exact likelihood inference based on Type-I and Type-Ⅱ hybrid censored samples from the exponential distribution, Ann. Inst. Stat. Math., 55 (2003), 319–330. https://doi.org/10.1007/BF02530502 doi: 10.1007/BF02530502

|
| [2] |
N. Balakrishnan, A. Rasouli, S. N. Farsipour, Exact likelihood inference based on a unified hybrid censored sample from the exponential distribution, J. Stat. Comput. Simul., 78 (2008), 475–488. http://dx.doi.org/10.1080/00949650601158336 doi: 10.1080/00949650601158336
|
| [3] |
N. Balakrishnan, Progressive censoring methodology: An appraisal, TEST, 16 (2007), 211–296. https://doi.org/10.1007/s11749-007-0061-y doi: 10.1007/s11749-007-0061-y
|
| [4] |
D. Kundu, A. Joarder, Analysis of Type-Ⅱ progressively hybrid censored data, Comput. Stat. Data Anal., 50 (2006), 2509–2528. https://doi.org/10.1016/j.csda.2005.05.002 doi: 10.1016/j.csda.2005.05.002
|
| [5] |
H. Panahi, Estimation of the Burr type Ⅲ distribution with application in unified hybrid censored sample of fracture toughness, J. Appl. Stat., 44 (2017), 2575–2592. http://dx.doi.org/10.1080/02664763.2016.1258549 doi: 10.1080/02664763.2016.1258549
|
| [6] |
K. Lee, J. I. Seo, Different approaches to estimation of the gompertz distribution under the progressive type-Ⅱ censoring scheme, J. Probab. Stat., 2020 (2020), 3541946. https://doi.org/10.1155/2020/3541946 doi: 10.1155/2020/3541946
|
| [7] |
L. A. Ferreira, J. L. Silva, Parameter estimation for Weibull distribution with right censored data using EM algorithm, Ekspl. Niezawodność, 19 (2017), 310–315. https://doi.org/10.17531/ein.2017.2.20 doi: 10.17531/ein.2017.2.20
|
| [8] | J. K. Starling, C. Mastrangelo, Y. Choe, Improving Weibull distribution estimation for generalized Type I censored data using modified SMOTE, Reliab. Eng. Syst. Saf., 211 (2021), 107505. http://dx.doi.org10.1016/j.ress.2021.107505 |
| [9] |
B. X. Wang, K. Yu, Z. Sheng, New inference for constant-stress accelerated life tests with Weibull distribution and progressively Type-Ⅱ censoring, IEEE Trans. Reliab., 63 (2014), 807–815. http://dx.doi.org/10.1109/TR.2014.2313804 doi: 10.1109/TR.2014.2313804
|
| [10] |
S. A. Lone, A. Rahman, T. A. Tarray, Inference for step-stress partially accelerated life test model with an adaptive type-I progressively hybrid censored data, J. Mod. Appl. Stat. Methods, 19 (2021). http://dx.doi.org/10.22237/jmasm/1608552180 doi: 10.22237/jmasm/1608552180
|
| [11] |
S. A. Lone, H. Panahi, Estimation procedures for partially accelerated life test model based on unified hybrid censored sample from the Gompertz distribution, Ekspl. Niezawodność, 24 (2022), 427–436. http://dx.doi.org/10.17531/ein.2022.3.4 doi: 10.17531/ein.2022.3.4
|
| [12] |
S. A. Lone, H. Panahi, I. Shah, Bayesian prediction interval for a constant-stress partially accelerated life test model under censored data, J. Taibah Univ. Sci., 15 (2021), 1178–1187. http://dx.doi.org/10.1080/16583655.2021.2023847 doi: 10.1080/16583655.2021.2023847
|
| [13] |
S. A. Lone, A. Ahmed, Design and analysis of accelerated life testing and its application under rebate warranty, Sankhya A, 83 (2021), 393–407. https://doi.org/10.1007/s13171-019-00193-0 doi: 10.1007/s13171-019-00193-0
|
| [14] |
S. A. Lone, Simulating fréchet distribution under multiply censored partially accelerated life testing, Ann. Data Sci., 9 (2022). https://doi.org/10.1007/s40745-022-00399-4 doi: 10.1007/s40745-022-00399-4
|
| [15] |
J. Gorny, E. Cramer, Modularization of hybrid censoring schemes and its application to unified progressive hybrid censoring, Metrika, 81 (2018), 173–210. https://doi.org/10.1007/s00184-017-0639-7 doi: 10.1007/s00184-017-0639-7
|
| [16] |
J. D. Church, B. Harris, The estimation of reliability from stress-strength relationships, Technometrics, 12 (1970), 49–54. https://doi.org/10.2307/1267350 doi: 10.2307/1267350
|
| [17] |
S. Wellek, Basing the analysis of comparative bioavailability trials on an individualized statistical definition of equivalence, Biom. J., 35 (1993), 47–55. https://doi.org/10.1002/bimj.4710350105 doi: 10.1002/bimj.4710350105
|
| [18] |
L. Schwartz, S. Wearden, A distribution-free asymptotic method of estimating, testing, and setting confidence limits for heritability, Biometrics, 15 (1959), 227–235. https://doi.org/10.2307/2527671 doi: 10.2307/2527671
|
| [19] | G. K. Bhattacharyya, R. A. Johnson, Estimation of reliability in multicomponent stress-strength model, J. Am. Stat. Assoc., 69 (1974), 966–970. |
| [20] |
G. S. Rao, R. R. L. Kantam, K. Rosaiah, J. P. Reddy, Estimation of stress-strength reliability from inverse Rayleigh distribution, J. Ind. Prod. Eng., 30 (2013), 256–263. https://doi.org/10.1080/21681015.2013.828787 doi: 10.1080/21681015.2013.828787
|
| [21] |
M. E. Ghitany, D. K. Al-Mutairi, S. M. Aboukhamseen, Estimation of the reliability of a stress strength system from power Lindley distributions, Commun. Stat.-Simul. Comput., 44 (2015), 118–136. https://doi.org/10.1080/03610918.2013.767910 doi: 10.1080/03610918.2013.767910
|
| [22] |
F. G. Akgul, B Senoglu, Estimation of P (X < Y) using ranked set sampling for the Weibull distribution, Qual. Technol. Quant. Manage., 14 (2017), 296–309. https://doi.org/10.1080/16843703.2016.1226590 doi: 10.1080/16843703.2016.1226590
|
| [23] |
X. Bai, Y. Shi, Y. Liu, B. Liu, Reliability estimation of stress-strength model using finite mixture distributions under progressively interval censoring, J. Comput. Appl. Math., 348 (2019), 509–524. https://doi.org/10.1016/j.cam.2018.09.023 doi: 10.1016/j.cam.2018.09.023
|
| [24] |
D. Demiray, F. Kizilaslan, Stress-strength reliability estimation of a consecutive k-out-of-n system based on proportional hazard rate family, J. Stat. Comput. Simul., 92 (2021), 159–190. https://doi.org/10.1080/00949655.2021.1935947 doi: 10.1080/00949655.2021.1935947
|
| [25] |
S. Asadi, H. Panahi, Estimation of stress-strength reliability based on censored data and its evaluation for coating processes, Qual. Technol. Quant. Manage., 19 (2022), 379–401. https://doi.org/10.1080/16843703.2021.2001129 doi: 10.1080/16843703.2021.2001129
|
| [26] |
L. Zhang, A. Xu, L. An, M. Li, Bayesian inference of system reliability for multicomponent stress-strength model under Marshall-Olkin Weibull distribution, Systems, 10 (2022). https://doi.org/10.3390/systems10060196 doi: 10.3390/systems10060196
|
| [27] |
R. De La Cruz, H. S. Salinas, C. Meza, Reliability estimation for stress-strength model based on Unit-Half-Normal distribution, Symmetry, 14 (2022). https://doi.org/10.3390/sym14040837 doi: 10.3390/sym14040837
|
| [28] |
B. Wang, Y. Geng, J. X. Zhou, Inference for the generalized exponential stress-strength model, Appl. Math. Modell., 53 (2018), 267–275. http://dx.doi.org/10.1016/j.apm.2017.09.012 doi: 10.1016/j.apm.2017.09.012
|
| [29] |
L. Zhuang, A. Xu, X. L. Wang, A prognostic driven predictive maintenance framework based on Bayesian deep learning, Reliab. Eng. Syst. Saf., 234 (2023). https://doi.org/10.1016/j.ress.2023.109181 doi: 10.1016/j.ress.2023.109181
|
| [30] |
T. Kayal, Y. M. Tripathi, M. K. Rastogi, Estimation and prediction for an inverted exponentiated Rayleigh distribution under hybrid censoring, Commun. Stat.-Theory Methods, 47 (2018), 1615–1640. http://dx.doi.org/10.1080/03610926.2017.1322702 doi: 10.1080/03610926.2017.1322702
|
| [31] |
S. Gao, W. Gui, Parameter estimation of the inverted exponentiated Rayleigh distribution based on progressively first-failure censored samples, Int. J. Syst. Assur. Eng. Manage., 10 (2019), 925–936. https://doi.org/10.1007/s13198-019-00822-9 doi: 10.1007/s13198-019-00822-9
|
| [32] |
H. Panahi, N. Moradi, Estimation of the inverted exponentiated Rayleigh distribution based on adaptive Type Ⅱ progressive hybrid censored sample, J. Comput. Appl. Math., 364 (2020). http://dx.doi.org/10.1016/j.cam.2019.112345 doi: 10.1016/j.cam.2019.112345
|
| [33] |
J. Fan, W. Gui, Statistical inference of inverted exponentiated Rayleigh distribution under joint progressively Type-Ⅱ censoring, Entropy, 24 (2022). https://doi.org/10.3390/e24020171 doi: 10.3390/e24020171
|
| [34] |
J. Diebolt, G. Celeux, Asymptotic properties of a stochastic EM algorithm for estimating mixing proportions, Stochastic Models, 9 (1993), 599–613. https://doi.org/10.1080/15326349308807283 doi: 10.1080/15326349308807283
|
| [35] |
N. Metropolis, A. W. Rosenbluth, M. N. Rosenbluth, A. H. Teller, E. Teller, Equations of state calculations by fast computing machines, J. Chem. Phys., 21 (1953), 1087–1092. https://doi.org/10.1063/1.1699114 doi: 10.1063/1.1699114
|
| [36] |
W. K. Hastings, Monte Carlo sampling methods using Markov chains and their applications, Biometrika, 57 (1970), 97–109. https://doi.org/10.2307/2334940 doi: 10.2307/2334940
|
| [37] |
J. Ren, W. Gui, Statistical analysis of adaptive type-Ⅱ progressively censored competing risks for Weibull models, Appl. Math. Modell., 98 (2021), 323–342. http://dx.doi.org/10.1016/j.apm.2021.05.008 doi: 10.1016/j.apm.2021.05.008
|
| [38] |
M. P. Planche, O. Khatim, L. Dembinski, Y. Bailly, C. Coddet, Evaluation of the splats properties and relation with droplets diameters in atomization process using a De Laval Nozzle, Mater. Chem. Phys., 137(2013), 681–188. https://doi.org/10.1016/j.matchemphys.2012.09.040 doi: 10.1016/j.matchemphys.2012.09.040
|


Figures(7) / Tables(5)
Sadia Anwar, Showkat Ahmad Lone, Aysha Khan, Salmeh Almutlak. Stress-strength reliability estimation for the inverted exponentiated Rayleigh distribution under unified progressive hybrid censoring with application[J]. Electronic Research Archive, 2023, 31(7): 4011-4033. doi: 10.3934/era.2023204


 DownLoad: