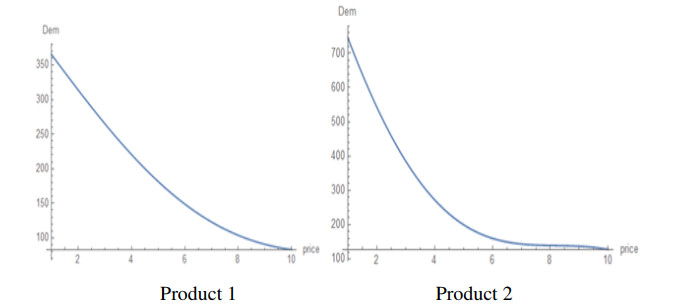
In a bottom-up approach, agent-based models have been extensively used in finance and economics in order to understand how macro-level phenomena can emerge from myriads of micro-level behaviours of individual agents. Moreover, in the absence of (big) data there is still the need to test economic theories and understand how macro-level laws can be materialized as the aggregate of a multitude of interactions of discrete agents. We exemplify how we can solve this problem in a particular instance: We introduce an agent-based method in order to generate data with Monte Carlo and then we interpolate the data with machine learning methods in order to derive multi-parametric demand functions. In particular, the model we construct is implemented in a simulated economy with 1000 consumers and two products, where each consumer is characterized by a unique set of preferences and available income. The demand for each product is determined by a stochastic process, incorporating the uncertainty in consumer preferences. By interpolating the data for the demands for various scenarios and types of consumers we derive poly-parametric demand functions. These demand functions are partially in tension with classical demand theory since on certain occasions they imply that the demand of a product increases as its price increases. Our proposed method of generating data from discrete agents with Monte Carlo and of interpolating the data with machine learning methods can be easily generalized and applied to the assessment of economic theories and to the derivation of economic laws in a bottom-up approach.
Citation: Georgios Alkis Tsiatsios, John Leventides, Evangelos Melas, Costas Poulios. A bounded rational agent-based model of consumer choice[J]. Data Science in Finance and Economics, 2023, 3(3): 305-323. doi: 10.3934/DSFE.2023018
In a bottom-up approach, agent-based models have been extensively used in finance and economics in order to understand how macro-level phenomena can emerge from myriads of micro-level behaviours of individual agents. Moreover, in the absence of (big) data there is still the need to test economic theories and understand how macro-level laws can be materialized as the aggregate of a multitude of interactions of discrete agents. We exemplify how we can solve this problem in a particular instance: We introduce an agent-based method in order to generate data with Monte Carlo and then we interpolate the data with machine learning methods in order to derive multi-parametric demand functions. In particular, the model we construct is implemented in a simulated economy with 1000 consumers and two products, where each consumer is characterized by a unique set of preferences and available income. The demand for each product is determined by a stochastic process, incorporating the uncertainty in consumer preferences. By interpolating the data for the demands for various scenarios and types of consumers we derive poly-parametric demand functions. These demand functions are partially in tension with classical demand theory since on certain occasions they imply that the demand of a product increases as its price increases. Our proposed method of generating data from discrete agents with Monte Carlo and of interpolating the data with machine learning methods can be easily generalized and applied to the assessment of economic theories and to the derivation of economic laws in a bottom-up approach.

| [1] |
Akerlof GA (2002) Behavioral macroeconomics and macroeconomic behavior. Am Econ Rev 92: 411–433. https://doi.org/10.1257/00028280260136192 doi: 10.1257/00028280260136192

|
| [2] | Anderson TW, Goodman LA (1957) Statistical inference about Markov chains. Ann Math Stat 28: 89–110. |
| [3] | Arrow KJ (1971) Essays in the Theory of Risk-Bearing. Markham Pub Co |
| [4] |
Assenza T, Delli Gatti D, Grazzini J (2015) Emergent dynamics of a macroeconomic agent-based model with capital and credit. J Econ Dyn Control 50: 5–28. https://doi.org/10.1016/j.jedc.2014.07.001 doi: 10.1016/j.jedc.2014.07.001
|
| [5] | Axtell RL, Farmer JD (2022) Agent-Based Modeling in Economics and Finance: Past, Present, and Future. INET Oxford Working Paper No. 2002-10. 21$^{st}$ June 2022. |
| [6] |
Barbu VS, D'Amico G, De Blasis R (2017) Novel advancements in the Markov chain stock model: Analysis and inference. Ann Financ 13: 125–152. https://doi.org/10.1007/s10436-017-0297-9 doi: 10.1007/s10436-017-0297-9
|
| [7] |
Battiston S, Farmer JD, Flache A, et al. (2016) Complexity theory and financial regulation. Science 351: 818–819. https://doi.org/10.1126/science.aad0299 doi: 10.1126/science.aad0299
|
| [8] | Billingsley P (1961) Statistical methods in Markov chains. Ann Math Stat 32: 12–40. |
| [9] |
Bonabeau (2002) Agent-based modeling: Methods and techniques for simulating human systems. P Natl Acad Sci 99: 7280–7287. https://doi.org/10.1073/pnas.0820808 doi: 10.1073/pnas.0820808
|
| [10] |
Bookstaber R (2017) Agent-Based Models for Financial Crises. Ann Rev Financ Econ 9: 85–100. https://doi.org/10.1146/annurev-financial-110716-032556 doi: 10.1146/annurev-financial-110716-032556
|
| [11] | Buchanan M (2009) Meltdown modelling: could agent-based computer models prevent another financial crisis? Nature 460: 680–683. |
| [12] |
Delli G, Gaffeo E, Gallegati M (2010) Complex agent-based macroeconomics: a manifesto for a new paradigm. J Econ Interact Coor 5: 111–135. https://doi.org/10.1007/s11403-010-0064-8 doi: 10.1007/s11403-010-0064-8
|
| [13] | Ehrenberg AS (1988) Repeat-Buying: Facts, Theory and Applications. Oxford University Press. |
| [14] | Epstein JM (2006) Generative social science: Studies in agent-based computational modeling. Princeton University Press. |
| [15] |
Farmer JD, Foley D (2009) The economy needs agent–based modelling. Nature 460: 685–686. https://doi.org/10.1038/460685a doi: 10.1038/460685a
|
| [16] |
Gary JG, Irwin PL, Goutam C, et al. (1991) Consumer evaluation of multi-product bundles: An information integration analysis. Market Lett 2: 47–57. https://doi.org/10.1007/BF00435195 doi: 10.1007/BF00435195
|
| [17] |
Grazzini J, Richiardi MG (2015) Estimation of ergodic agent-based models by simulated minimum distance. J Econ Dyn Control 51: 148–165. https://doi.org/10.1016/j.jedc.2014.10.006 doi: 10.1016/j.jedc.2014.10.006
|
| [18] | Hamill L, Gilbert N (2015) Agent–based modelling in economics. John Wiley & Sons. |
| [19] | Kahneman D (2003) Maps of Bounded Rationality: Psychology for Behavioral Economics. Am Econ Rev 93: 1449–1475. |
| [20] |
Kaplow L (2008) Optimal policy with heterogeneous preferences. BE J Econ Anal Policy 8. https://doi.org/10.2202/1935-1682.1947 doi: 10.2202/1935-1682.1947
|
| [21] | Leijonhufvud A (1996) Towards a not-too-rational macroeconomics, In: Colander, D. (Ed.), Beyond Microfoundations: Post Walrasian Macroeconomics. Cambridge University Press, Cambridge, MA., 39–55. |
| [22] | Macal CM, North MJ (2005) Tutorial on agent$-$based modeling and simulation. Proceedings of the Winter Simulation Conference 14, IEEE. |
| [23] |
Maravilha D, Silva S, Laranjeira E (2022) Consumer's behavior determinants after the electricity market liberalization: the Portuguese case. Green Financ 4: 436–449. https://doi.org/10.3934/GF.2022021 doi: 10.3934/GF.2022021
|
| [24] |
Mandel A, Landini S, Gallegati M, et al. (2015) Price dynamics, financial fragility and aggregate volatility. J Econ Dyn Control 51: 257–277. https://doi.org/10.1016/j.jedc.2014.11.001 doi: 10.1016/j.jedc.2014.11.001
|
| [25] |
Manout O, Ciari F (2021) Assessing the Role of Daily Activities and Mobility in the Spread of COVID-19 in Montreal with an Agent-Based Approach. Front Built Enviroment 7: 2021. https://doi.org/10.3389/fbuil.2021.654279 doi: 10.3389/fbuil.2021.654279
|
| [26] | McFadden D (1974) Conditional Logit Analysis of Qualitative Choice Behavior. Front Econometrics Zarembka (Ed.) 105–142. New York: Academic Press. |
| [27] |
Mullainathan S, Spiess J (2017) Machine Learning: An Applied Econometric Approach. J Econ Perspect 31: 87–106. https://doi.org/10.1257/jep.31.2.87 doi: 10.1257/jep.31.2.87
|
| [28] |
Peña G (2020) A new trading algorithm with financial applications. Quant Financ Econ 4: 596–607. https://doi.org/10.3934/QFE.2020027 doi: 10.3934/QFE.2020027
|
| [29] |
Predelus W, Amine S (2022) The insolvency choice during an economic crisis: the case of Canada. Quant Financ Econ 6: 658–668. https://doi.org/10.3934/QFE.2022029 doi: 10.3934/QFE.2022029
|
| [30] |
Reisch LA, Zhao M (2017) Behavioural economics, consumer behaviour and consumer policy: state of the art. Behav Public Policy 1: 190–206. https://doi.org/10.1017/bpp.2017.1 doi: 10.1017/bpp.2017.1
|
| [31] |
Seetharaman PB (2004) Modeling multiple sources of state dependence in random utility models: A distributed lag approach. Market Sci 23: 263–271. https://doi.org/10.1287/mksc.1030.0024 doi: 10.1287/mksc.1030.0024
|
| [32] | Simon HA (1955) A Behavioral Model of Rational Choice. Q J Econ 69: 99–118. |
| [33] | Simudyne (2023) A Complete-Guide to Agent-Based Modeling for Financial Services. Simudyne 2023. |
| [34] |
Tesfatsion L (2006) Agent-Based Computational Economics: A Constructive Approach to Economic Theory. Handb Computat Econ 2: 831–880. https://doi.org/10.1016/S1574-0021(05)02016-2 doi: 10.1016/S1574-0021(05)02016-2
|
| [35] | Tesfatsion L, Judd KL (2006) Handbook of computational economics: agent-based computational economics. Elsevier. |
| [36] | Thaler RH (2015) Misbehaving: The Making of Behavioral Economics. W. W. Norton & Company. |
| [37] | Thurner S, Farmer JD, Geanakoplos J (2012) Using agent-based simulations, this work discusses the role of leverage in financial markets, explaining phenomena like fat-tailed asset returns. Quant Financ 12: 695–707. |
| [38] | Tsiatsios GA, Kollias I, Melas E, et al. (2022) Some first results from an agent–based model of consumer demand. submitted. |
| [39] | Tsiatsios GA, Leventides I, Melas E, et al. (2023a) A bounded rational agent-based model of consumer choice. submitted. |
| [40] | Tsiatsios GA, Leventides I, Toudas K, et al. (2023b) An agent–based study on the dynamic distribution and firms concentration in a closed economy. submitted. |
| [41] | Turell A (2016) Agent-based models: Understanding the economy from the bottom up. Bank England Quart Bull 2016. |
| [42] | Varian HR (2014) Intermediate Microeconomics: A Modern Approach. W. W. Norton & Company. |
| [43] |
Zhong Li Z (2020) Impact of economic policy uncertainty shocks on China's financial conditions. Financ Res Lett 35: 101303. https://doi.org/10.1016/j.frl.2019.101303 doi: 10.1016/j.frl.2019.101303
|


Figures(8)
Georgios Alkis Tsiatsios, John Leventides, Evangelos Melas, Costas Poulios. A bounded rational agent-based model of consumer choice[J]. Data Science in Finance and Economics, 2023, 3(3): 305-323. doi: 10.3934/DSFE.2023018


 DownLoad: