We present a non-local version of a scalar balance law modeling traffic flow with on-ramps and off-ramps. The source term is used to describe the inflow and output flow over the on-ramp and off-ramps respectively. We approximate the problem using an upwind-type numerical scheme and we provide
Citation: Felisia Angela Chiarello, Harold Deivi Contreras, Luis Miguel Villada. Nonlocal reaction traffic flow model with on-off ramps[J]. Networks and Heterogeneous Media, 2022, 17(2): 203-226. doi: 10.3934/nhm.2022003
We present a non-local version of a scalar balance law modeling traffic flow with on-ramps and off-ramps. The source term is used to describe the inflow and output flow over the on-ramp and off-ramps respectively. We approximate the problem using an upwind-type numerical scheme and we provide

| [1] |
On the numerical integration of scalar nonlocal conservation laws. ESAIM: Mathematical Modelling and Numerical Analysis (2015) 49: 19-37. 
|
| [2] |
A. Bayen, A. Keimer, L. Pflug and T. Veeravalli, Modeling multi-lane traffic with moving obstacles by nonlocal balance laws, Preprint, (2020). |
| [3] |
Well-posedness of a conservation law with non-local flux arising in traffic flow modeling. Numerische Mathematik (2016) 132: 217-241.
|
| [4] |
A non-local traffic flow model for 1-to-1 junctions. European Journal of Applied Mathematics (2020) 31: 1029-1049.
|
| [5] |
Global entropy weak solutions for general non-local traffic flow models with anisotropic kernel. ESAIM: Mathematical Modelling and Numerical Analysis (2018) 52: 163-180.
|
| [6] |
Non-local multi-class traffic flow models. Networks & Heterogeneous Media (2019) 14: 371-380.
|
| [7] |
A PDE-ODE model for a junction with ramp buffer. SIAM Journal on Applied Mathematics (2014) 74: 22-39.
|
| [8] |
J. Friedrich, S. Göttlich and E. Rossi, Nonlocal approaches for multilane traffic models, Commun. Math. Sci., 19 (2021), 2291–2317, arXiv preprint, arXiv: 2012.05794, (2020). |
| [9] |
A godunov type scheme for a class of lwr traffic flow models with non-local flux. Networks & Heterogeneous Media (2018) 13: 531-547.
|
| [10] |
A multilane macroscopic traffic flow model for simple networks. SIAM Journal on Applied Mathematics (2019) 79: 1967-1989.
|
| [11] |
Well-posedness and finite volume approximations of the LWR traffic flow model with non-local velocity. Netw. Heterog. Media (2016) 11: 107-121.
|
| [12] |
Hierarchical ramp metering in freeways: An aggregated modeling and control approach. Transportation Research Part C: Emerging Technologies (2020) 110: 1-19.
|
| [13] |
Master: Macroscopic traffic simulation based on a gas-kinetic, non-local traffic model. Transportation Research Part B: Methodological (2001) 35: 183-211.
|
| [14] |
Models for dense multilane vehicular traffic. SIAM Journal on Mathematical Analysis (2019) 51: 3694-3713.
|
| [15] |
Optimal ramp metering strategy with extended lwr model, analysis and computational methods. IFAC Proceedings Volumes (2005) 38: 99-104.
|
| [16] |
G. Lipták, M. Pereira, B. Kulcsár, M. Kovács and G. Szederkényi, Traffic reaction model, arXiv preprint, arXiv: 2101.10190, (2021). |
| [17] |
Modelling of freeway merging and diverging flow dynamics. Applied Mathematical Modelling (1996) 20: 459-469.
|
| [18] |
Stochastic modeling and simulation of traffic flow: Asymmetric single exclusion process with arrhenius look-ahead dynamics. SIAM Journal on Applied Mathematics (2006) 66: 921-944.
|
| [19] |
Study on traffic characteristics for a typical expressway on-ramp bottleneck considering various merging behaviors. Physica A: Statistical Mechanics and its Applications (2015) 440: 57-67.
|
| [20] |
Effects of the number of on-ramps on the ring traffic flow. Chinese Physics B (2010) 19: 050517.
|
| [21] |
A new macro model for traffic flow on a highway with ramps and numerical tests. Communications in Theoretical Physics (2009) 51: 71.
|
| [22] |
Congested traffic patterns of two-lane lattice hydrodynamic model with on-ramp. Nonlinear Dynamics (2017) 88: 1345-1359.
|
Figures(5) / Tables(1)
Felisia Angela Chiarello, Harold Deivi Contreras, Luis Miguel Villada. Nonlocal reaction traffic flow model with on-off ramps[J]. Networks and Heterogeneous Media, 2022, 17(2): 203-226. doi: 10.3934/nhm.2022003

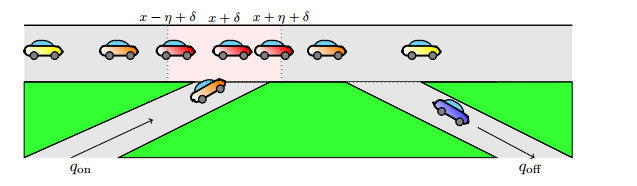
Illustration of the model setting
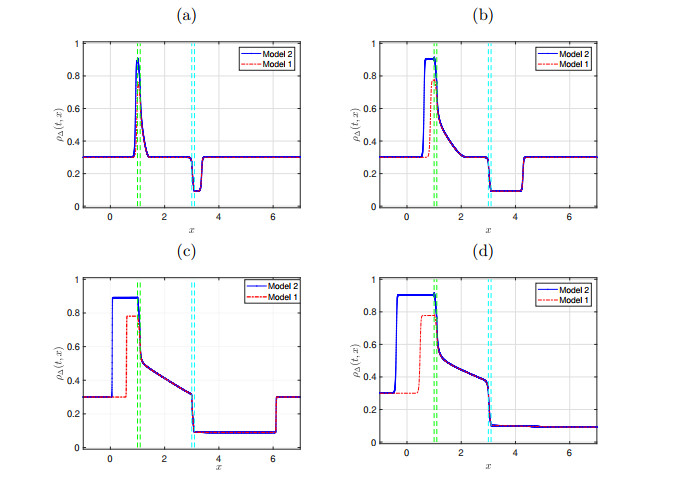
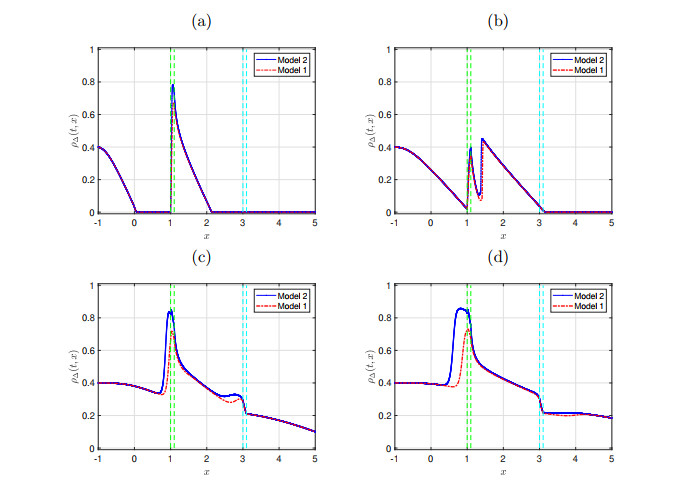
Example 1. Numerical approximations of the problem (2.1). Dynamic of Model 1 vs. Model 2 at (a)
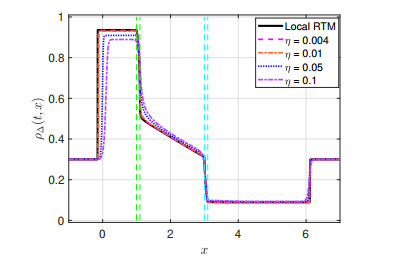
Example 2. Numerical approximations of the problem (2.1) at
Example 3. Numerical approximation at time
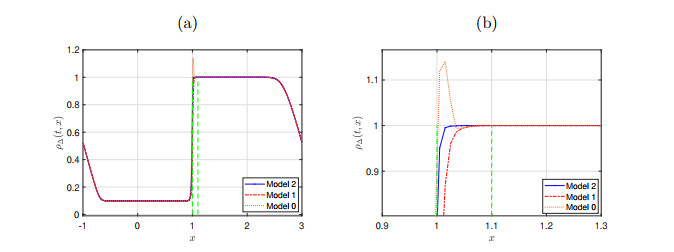
Example 4. Dynamic of the model (2.1). Behavior of the numerical solution computed with Algorithm 3.1 by means of Model 1 and Model 2 at time (a)


 DownLoad: