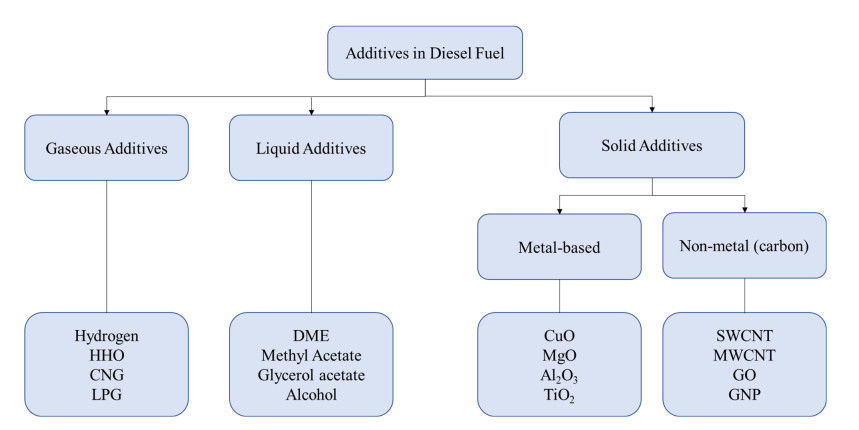
In recent years, there has been an increasing interest in additives for fuel research in the field of internal-combustion engines. Many studies have been conducted to improve the performance and emissions of the engine. Many kinds of additives in the form of solids, liquids, and gases have been used. The objective of this review is to examine the effects of having additives on the performance and emissions of an internal combustion engine. Additives such as alcohol, hydrogen, and metal oxides are proven to be successful in improving performance or reducing emissions. Results from selected papers are discussed and summarised in a table. With the new developments in nanotechnology, many researchers have shown an increased interest in carbon-based nanoparticles such as multi-walled carbon nanotubes (MWCNT) and single-walled carbon nanotubes (SWCNT). Lately, with the discovery of graphene production techniques, graphene nanoplatelets (GNP) have also been applied as fuel additives. In addition to understanding the effects of the additives on the engine performance and emissions, researchers extended the research to predict the outcome of the performance and emissions. The experiments involving the predictions efforts are summarised in a table. From the summary, it is found that the prediction of the GNP as fuel additive effects to the performance and emissions has not yet been explored. This gap is an opportunity for researchers to explore further.
Citation: Sarbani Daud, Mohd Adnin Hamidi, Rizalman Mamat. A review of fuel additives' effects and predictions on internal combustion engine performance and emissions[J]. AIMS Energy, 2022, 10(1): 1-22. doi: 10.3934/energy.2022001
In recent years, there has been an increasing interest in additives for fuel research in the field of internal-combustion engines. Many studies have been conducted to improve the performance and emissions of the engine. Many kinds of additives in the form of solids, liquids, and gases have been used. The objective of this review is to examine the effects of having additives on the performance and emissions of an internal combustion engine. Additives such as alcohol, hydrogen, and metal oxides are proven to be successful in improving performance or reducing emissions. Results from selected papers are discussed and summarised in a table. With the new developments in nanotechnology, many researchers have shown an increased interest in carbon-based nanoparticles such as multi-walled carbon nanotubes (MWCNT) and single-walled carbon nanotubes (SWCNT). Lately, with the discovery of graphene production techniques, graphene nanoplatelets (GNP) have also been applied as fuel additives. In addition to understanding the effects of the additives on the engine performance and emissions, researchers extended the research to predict the outcome of the performance and emissions. The experiments involving the predictions efforts are summarised in a table. From the summary, it is found that the prediction of the GNP as fuel additive effects to the performance and emissions has not yet been explored. This gap is an opportunity for researchers to explore further.

| [1] |
Raghuvaran S, Ashok B, Veluchamy B, et al. (2020) Evaluation of performance and exhaust emission of C.I diesel engine fuel with palm oil biodiesel using an artificial neural network. Mater Today: Proc 37: 1107-1111. https://doi.org/10.1016/j.matpr.2020.06.344 doi: 10.1016/j.matpr.2020.06.344

|
| [2] |
Sunil Kumar M, Rajasekar R, Ganesan S, et al. (2020) Evaluation of metal oxide nano particles in lemongrass biodiesel for engine performance, emission and combustion characteristics. Mater Today: Proc 44: 3657-3665. https://doi.org/10.1016/j.matpr.2020.10.796. doi: 10.1016/j.matpr.2020.10.796
|
| [3] |
El-Seesy AI, Hassan H, Ookawara S (2018) Performance, combustion, and emission characteristics of a diesel engine fueled with Jatropha methyl ester and graphene oxide additives. Energy Convers Manage 166: 674-686. https://doi.org/10.1016/j.enconman.2018.04.049 doi: 10.1016/j.enconman.2018.04.049
|
| [4] |
Ershov MA, Grigorieva EV, Abdellatief TM, et al. (2021) Hybrid low-carbon high-octane oxygenated gasoline based on low-octane hydrocarbon fractions. Sci Total Environ 756: 142715. https://doi.org/10.1016/j.scitotenv.2020.142715 doi: 10.1016/j.scitotenv.2020.142715
|
| [5] |
Sharma P, Dhar A (2019) Particulate emissions from hydrogen diesel fuelled CI engines. Engine Exhaust Part, 199-211. https://doi.org/10.1007/978-981-13-3299-9_10 doi: 10.1007/978-981-13-3299-9_10
|
| [6] |
Chuvashev A, Chuprakov A (2019) Investigation of environmental indicators of diesel engine when working on methanol. J Phys: Conference Series 1399: 055085. https://doi.org/10.1088/1742-6596/1399/5/055085 doi: 10.1088/1742-6596/1399/5/055085
|
| [7] |
Wong JY, Vermeulen R, Dai Y, et al. (2021) Elevated urinary mutagenicity among those exposed to bituminous coal combustion emissions or diesel engine exhaust. Environ Mol Mutagen 62: 458-470. https://doi.org/10.1002/em.22455 doi: 10.1002/em.22455
|
| [8] |
Jeevahan J, Mageshwaran G, Joseph GB, et al. (2017) Various strategies for reducing Nox emissions of biodiesel fuel used in conventional diesel engines: A review. Chem Eng Commun 204: 1202-1223. https://doi.org/10.1080/00986445.2017.1353500 doi: 10.1080/00986445.2017.1353500
|
| [9] |
Day C, Day G (2017) Climate change, fossil fuel prices and depletion: The rationale for a falling export tax. Econ Modell 63: 153-160. https://doi.org/10.1016/j.econmod.2017.01.006 doi: 10.1016/j.econmod.2017.01.006
|
| [10] | Kaplan RS (2018) A Perspective on Oil, in: Federal Reserve Bank of Dallas. |
| [11] |
Raugei M, Leccisi E (2016) A comprehensive assessment of the energy performance of the full range of electricity generation technologies deployed in the United Kingdom. Energy Policy 90: 46-59. https://doi.org/10.1016/j.enpol.2015.12.011 doi: 10.1016/j.enpol.2015.12.011
|
| [12] |
Mattioli G, Philips I, Anable J, et al. (2019) Vulnerability to motor fuel price increases: Socio-spatial patterns in England. J Trans Geogr 78: 98-114. https://doi.org/10.1016/j.jtrangeo.2019.05.009 doi: 10.1016/j.jtrangeo.2019.05.009
|
| [13] |
Kpodar K, Abdallah C (2017) Dynamic fuel price pass-through: Evidence from a new global retail fuel price database. Energy Econ 66: 303-312. https://doi.org/10.1016/j.eneco.2017.06.017 doi: 10.1016/j.eneco.2017.06.017
|
| [14] |
Cavalcanti EJ, Carvalho M, Ochoa AA (2019) Exergoeconomic and exergoenvironmental comparison of diesel-biodiesel blends in a direct injection engine at variable loads. Energy Convers Manage 183: 450-461. https://doi.org/10.1016/j.enconman.2018.12.113 doi: 10.1016/j.enconman.2018.12.113
|
| [15] |
Zahan KA, Kano M (2018) Biodiesel production from palm oil, its by-products, and mill effluent: A review. Energies 11: 2132. https://doi.org/10.3390/en11082132 doi: 10.3390/en11082132
|
| [16] |
Han J, Vahidi A, Sciarretta A (2019) Fundamentals of energy efficient driving for combustion engine and electric vehicles: An optimal control perspective. Automatica 103: 558-572. https://doi.org/10.1016/j.automatica.2019.02.031 doi: 10.1016/j.automatica.2019.02.031
|
| [17] |
Krishania N, Rajak U, Verma TN, et al. (2020) Effect of microalgae, tyre pyrolysis oil and Jatropha biodiesel enriched with diesel fuel on performance and emission characteristics of CI engine. Fuel 278: 118252. https://doi.org/10.1016/j.fuel.2020.118252 doi: 10.1016/j.fuel.2020.118252
|
| [18] |
Krishnamoorthi M, Malayalamurthi R, He Z, et al. (2019) A review on low temperature combustion engines: Performance, combustion and emission characteristics. Renewable Sustainable Energy Rev 116: 109404. https://doi.org/10.1016/j.rser.2019.109404 doi: 10.1016/j.rser.2019.109404
|
| [19] |
Mohiddin AASMN, Reddy ANR, Hamdan S (2018) A study on chicken fat as an alternative feedstock: Biodiesel production, fuel characterisation, and diesel engine performance analysis. Int J Automot Mech Eng 15. https://doi.org/10.15282/ijame.15.3.2018.10.0425 doi: 10.15282/ijame.15.3.2018.10.0425
|
| [20] |
Nayak SK, Mishra PC (2017) Analysis of a Diesel Engine fuelled with jojoba blend and coir pith producer gas. Int J Automot Mech Eng 14: 4675-4689. https://doi.org/10.15282/ijame.14.4.2017.7.0368 doi: 10.15282/ijame.14.4.2017.7.0368
|
| [21] |
Pattanaik BP, Jena J, Misra RD (2017) The effect of oxygen content is soapnut biodiesel-diesel blends on performance of a diesel engine. Int J Automot Mech Eng 14: 4574-4588. https://doi.org/10.15282/ijame.14.3.2017.14.0361 doi: 10.15282/ijame.14.3.2017.14.0361
|
| [22] |
Cano ZP, Banham D, Ye S, et al. (2018) Batteries and fuel cells for emerging electric vehicle markets. Nat Energy 3: 279-289. https://doi.org/10.1038/s41560-018-0108-1 doi: 10.1038/s41560-018-0108-1
|
| [23] |
Anderson A, Al-Mohaimeed AM, Elshikh MS, et al. (2021) Exergy and Energy Analysis of α-Fe2O3-Doped Al2O3 Nanocatalyst-Based biodiesel blends—Performance and emission characteristics. J Energy Resour Technol 143. https://doi.org/10.1115/1.4050488 doi: 10.1115/1.4050488
|
| [24] |
Ge S, Ganesan R, Sekar M, et al. (2022) Blending and emission characteristics of biogasoline produced using CaO/SBA-15 catalyst by cracking used cooking oil. Fuel 307: 121861. https://doi.org/10.1016/j.fuel.2021.121861 doi: 10.1016/j.fuel.2021.121861
|
| [25] |
Nadim F, Zack P, Hoag GE, et al. (2001) United States experience with gasoline additives. Energy Policy 29: 1-5. https://doi.org/10.1016/S0301-4215(00)00099-9 doi: 10.1016/S0301-4215(00)00099-9
|
| [26] |
Ershov MA, Savelenko VD, Makhova UA, et al. (2021) New insights on introducing modern multifunctional additives into motor gasoline. Sci Total Environ 152034. https://doi.org/10.1016/j.scitotenv.2021.152034 doi: 10.1016/j.scitotenv.2021.152034
|
| [27] |
Wu G, Chen S, Meng X, et al. (2021) Development of antifreeze fracturing fluid systems for tight petroleum reservoir stimulations. Energy Fuels 35: 12119-12131. https://doi.org/10.1021/acs.energyfuels.1c01819 doi: 10.1021/acs.energyfuels.1c01819
|
| [28] |
Kalghatgi GT (2015) Developments in internal combustion engines and implications for combustion science and future transport fuels. Proc Combust Inst 35: 101-115. https://doi.org/10.1016/j.proci.2014.10.002 doi: 10.1016/j.proci.2014.10.002
|
| [29] |
Kanth S, Debbarma S, Das B (2020) Effect of hydrogen enrichment in the intake air of diesel engine fuelled with honge biodiesel blend and diesel. Int J Hydrogen Energy 45: 32521-32533. https://doi.org/10.1016/j.ijhydene.2020.08.152 doi: 10.1016/j.ijhydene.2020.08.152
|
| [30] |
Wategave SP, Banapurmath NR, Sawant MS, et al. (2021) Clean combustion and emissions strategy using reactivity controlled compression ignition (RCCI) mode engine powered with CNG-Karanja biodiesel. J Taiwan Inst Chem Eng 124: 116-131. https://doi.org/10.1016/j.jtice.2021.04.055 doi: 10.1016/j.jtice.2021.04.055
|
| [31] |
Gavhane RS, Kate AM, Pawar A, et al. (2020) Effect of zinc oxide nano-additives and soybean biodiesel at varying loads and compression ratios on VCR diesel engine characteristics. Symmetry 12: 1042. https://doi.org/10.3390/sym12061042 doi: 10.3390/sym12061042
|
| [32] |
Banapurmath N, Chandrashekar T, Soudagar MEM, et al. (2021) Effect of parameters behavior of simarouba methyl ester operated diesel engine. Energies 14: 4973. https://doi.org/10.3390/en14164973 doi: 10.3390/en14164973
|
| [33] |
Sateesh K, Yaliwal V, Soudagar MEM, et al. (2021) Utilization of biodiesel/Al2O3 nanoparticles for combustion behavior enhancement of a diesel engine operated on dual fuel mode. J Therm Anal Calorim 1-15. https://doi.org/10.1007/s10973-021-10928-7 doi: 10.1007/s10973-021-10928-7
|
| [34] |
Soudagar MEM, Afzal A, Safaei MR, et al. (2020) Investigation on the effect of cottonseed oil blended with different percentages of octanol and suspended MWCNT nanoparticles on diesel engine characteristics. J Therm Anal Calorim 1-18. https://doi.org/10.1007/s10973-020-10293-x doi: 10.1007/s10973-020-10293-x
|
| [35] |
Ramachander J, Gugulothu SK, Sastry GR, et al. (2021) Statistical and experimental investigation of the influence of fuel injection strategies on CRDI engine assisted CNG dual fuel diesel engine. Int J Hydrogen Energy 46: 22149-22164. https://doi.org/10.1016/j.ijhydene.2021.04.010 doi: 10.1016/j.ijhydene.2021.04.010
|
| [36] | American Elements. Available from: https://www.americanelements.com/graphene-1034343-98-0 |
| [37] |
Tayari S, Abedi R (2019) Effect of Chlorella vulgaris methyl ester enriched with hydrogen on performance and emission characteristics of CI engine. Fuel 256: 115906. https://doi.org/10.1016/j.fuel.2019.115906 doi: 10.1016/j.fuel.2019.115906
|
| [38] |
Anye Ngang E, Ngayihi Abbe CV (2018) Experimental and numerical analysis of the performance of a diesel engine retrofitted to use LPG as secondary fuel. Appl Therm Eng 136: 462-474. https://doi.org/10.1016/j.applthermaleng.2018.03.022 doi: 10.1016/j.applthermaleng.2018.03.022
|
| [39] |
Akcay M, Yilmaz IT, Feyzioglu A (2020) Effect of hydrogen addition on performance and emission characteristics of a common-rail CI engine fueled with diesel/waste cooking oil biodiesel blends. Energy 212: 118538. https://doi.org/10.1016/j.energy.2020.118538 doi: 10.1016/j.energy.2020.118538
|
| [40] |
Dharmaraja J, Nguyen DD, Shobana S, et al. (2019) Engine performance, emission and bio characteristics of rice bran oil derived biodiesel blends. Fuel 239: 153-161. https://doi.org/10.1016/j.fuel.2018.10.123 doi: 10.1016/j.fuel.2018.10.123
|
| [41] |
Yilmaz İ, Taştan M (2018) Investigation of hydrogen addition to methanol-gasoline blends in an SI engine. Int J Hydrogen Energy 43: 20252-20261. https://doi.org/10.1016/j.ijhydene.2018.07.088 doi: 10.1016/j.ijhydene.2018.07.088
|
| [42] |
Su T, Ji C, Wang S, et al. (2017) Improving idle performance of a hydrogen-gasoline rotary engine at stoichiometric condition. Int J Hydrogen Energy 42: 11893-11901. https://doi.org/10.1016/j.ijhydene.2017.01.220 doi: 10.1016/j.ijhydene.2017.01.220
|
| [43] |
Gnanamoorthi V, Vimalananth VT (2020) Effect of hydrogen fuel at higher flow rate under dual fuel mode in CRDI diesel engine. Int J Hydrogen Energy 45: 16874-16889. https://doi.org/10.1016/j.ijhydene.2020.04.145 doi: 10.1016/j.ijhydene.2020.04.145
|
| [44] |
Tabar AR, Hamidi AA, Ghadamian H (2017) Experimental investigation of CNG and gasoline fuels combination on a 1.7 L bi-fuel turbocharged engine. Int J Energy Environ Eng 8: 37-45. https://doi.org/10.1007/s40095-016-0223-3 doi: 10.1007/s40095-016-0223-3
|
| [45] |
Sonachalam M, PaulPandian P, Manieniyan V (2020) Emission reduction in diesel engine with acetylene gas and biodiesel using inlet manifold injection. Clean Technol Environ Policy 22: 2177-2191. https://doi.org/10.1007/s10098-020-01968-y doi: 10.1007/s10098-020-01968-y
|
| [46] |
Akansu SO, Tangoz S, Kahraman N, et al. (2017) Experimental study of gasoline-ethanol-hydrogen blends combustion in an SI engine. Int J Hydrogen Energy. https://doi.org/10.1016/j.ijhydene.2017.07.014 doi: 10.1016/j.ijhydene.2017.07.014
|
| [47] |
Najafi G, Ghobadian B, Moosavian A, et al. (2016) SVM and ANFIS for prediction of performance and exhaust emissions of a SI engine with gasoline-ethanol blended fuels. Appl Therm Eng 95: 186-203. https://doi.org/10.1016/j.applthermaleng.2015.11.009 doi: 10.1016/j.applthermaleng.2015.11.009
|
| [48] |
Nour M, Attia AMA, Nada SA (2019) Improvement of CI engine combustion and performance running on ternary blends of higher alcohol (Pentanol and Octanol)/hydrous ethanol/diesel. Fuel 251: 10-22. https://doi.org/10.1016/j.fuel.2019.04.026 doi: 10.1016/j.fuel.2019.04.026
|
| [49] |
Yesilyurt MK, Eryilmaz T, Arslan M (2018) A comparative analysis of the engine performance, exhaust emissions and combustion behaviors of a compression ignition engine fuelled with biodiesel/diesel/1-butanol (C4 alcohol) and biodiesel/diesel/n-pentanol (C5 alcohol) fuel blends. Energy 165: 1332-1351. https://doi.org/10.1016/j.energy.2018.10.100 doi: 10.1016/j.energy.2018.10.100
|
| [50] |
Edwin Geo V, Jesu Godwin D, Thiyagarajan S, et al. (2019) Effect of higher and lower order alcohol blending with gasoline on performance, emission and combustion characteristics of SI engine. Fuel 256: 115806. https://doi.org/10.1016/j.fuel.2019.115806 doi: 10.1016/j.fuel.2019.115806
|
| [51] |
Phuangwongtrakul S, Wechsatol W, Sethaput T, et al. (2016) Experimental study on sparking ignition engine performance for optimal mixing ratio of ethanol-gasoline blended fuels. Appl Therm Eng 100: 869-879. https://doi.org/10.1016/j.applthermaleng.2016.02.084 doi: 10.1016/j.applthermaleng.2016.02.084
|
| [52] |
Yesilyurt MK, Yilbasi Z, Aydin M (2020) The performance, emissions, and combustion characteristics of an unmodified diesel engine running on the ternary blends of pentanol/safflower oil biodiesel/diesel fuel. J Therm Anal Calorim 140: 2903-2942. https://doi.org/10.1007/s10973-020-09376-6 doi: 10.1007/s10973-020-09376-6
|
| [53] |
Doğan B, Erol D, Yaman H, et al. (2017) The effect of ethanol-gasoline blends on performance and exhaust emissions of a spark ignition engine through exergy analysis. Appl Therm Eng 120: 433-443. https://doi.org/10.1016/j.applthermaleng.2017.04.012 doi: 10.1016/j.applthermaleng.2017.04.012
|
| [54] |
Uslu S, Celik MB (2018) Prediction of engine emissions and performance with artificial neural networks in a single cylinder diesel engine using diethyl ether. Eng Sci Technol, Int J 21: 1194-1201. https://doi.org/10.1016/j.jestch.2018.08.017 doi: 10.1016/j.jestch.2018.08.017
|
| [55] |
Chen C, Yao A, Yao C, et al. (2019) Study of the characteristics of PM and the correlation of soot and smoke opacity on the diesel methanol dual fuel engine. Appl Therm Eng 148: 391-403. https://doi.org/10.1016/j.applthermaleng.2018.11.062 doi: 10.1016/j.applthermaleng.2018.11.062
|
| [56] |
Pinzi S, Redel-Macías MD, Leiva-Candia DE, et al. (2017) Influence of ethanol/diesel fuel and propanol/diesel fuel blends over exhaust and noise emissions. Energy Procedia 142: 849-854. https://doi.org/10.1016/j.egypro.2017.12.136 doi: 10.1016/j.egypro.2017.12.136
|
| [57] |
Amirabedi M, Jafarmadar S, Khalilarya S (2019) Experimental investigation the effect of Mn2O3 nanoparticle on the performance and emission of SI gasoline fueled with mixture of ethanol and gasoline. Appl Therm Eng 149: 512-519. https://doi.org/10.1016/j.applthermaleng.2018.12.058 doi: 10.1016/j.applthermaleng.2018.12.058
|
| [58] |
Jayaraman J, Karthik M, Krishna BM, et al. (2020) Impact of titanium oxide nano additives on the performance characteristics of a CI engine fuelled with manilkarazapota methyl ester blends. Mater Today: Proc. https://doi.org/10.1016/j.matpr.2020.09.497 doi: 10.1016/j.matpr.2020.09.497
|
| [59] |
Wei J, He C, Fan C, et al. (2021) Comparison in the effects of alumina, ceria and silica nanoparticle additives on the combustion and emission characteristics of a modern methanol-diesel dual-fuel CI engine. Energy Convers Manage 238: 114121. https://doi.org/10.1016/j.enconman.2021.114121 doi: 10.1016/j.enconman.2021.114121
|
| [60] |
Örs I, Sarıkoç S, Atabani AE, et al. (2018) The effects on performance, combustion and emission characteristics of DICI engine fuelled with TiO2 nanoparticles addition in diesel/biodiesel/n-butanol blends. Fuel 234: 177-188. https://doi.org/10.1016/j.fuel.2018.07.024 doi: 10.1016/j.fuel.2018.07.024
|
| [61] |
Gumus S, Ozcan H, Ozbey M, et al. (2016) Aluminum oxide and copper oxide nanodiesel fuel properties and usage in a compression ignition engine. Fuel 163: 80-87. https://doi.org/10.1016/j.fuel.2015.09.048 doi: 10.1016/j.fuel.2015.09.048
|
| [62] |
Wei J, Yin Z, Wang C, et al. (2021) Impact of aluminium oxide nanoparticles as an additive in diesel-methanol blends on a modern DI diesel engine. Appl Therm Eng 185: 116372. https://doi.org/10.1016/j.applthermaleng.2020.116372 doi: 10.1016/j.applthermaleng.2020.116372
|
| [63] |
Heydari-Maleney K, Taghizadeh-Alisaraei A, Ghobadian B, et al. (2017) Analyzing and evaluation of carbon nanotubes additives to diesohol-B2 fuels on performance and emission of diesel engines. Fuel 196: 110-123. https://doi.org/10.1016/j.fuel.2017.01.091 doi: 10.1016/j.fuel.2017.01.091
|
| [64] |
Hosseini SH, Taghizadeh-Alisaraei A, Ghobadian B, et al. (2017) Performance and emission characteristics of a CI engine fuelled with carbon nanotubes and diesel-biodiesel blends. Renewable Energy 111: 201-213. https://doi.org/10.1016/j.renene.2017.04.013 doi: 10.1016/j.renene.2017.04.013
|
| [65] |
Gad MS, Kamel BM, Anjum Badruddin I (2021) Improving the diesel engine performance, emissions and combustion characteristics using biodiesel with carbon nanomaterials. Fuel 288: 119665. https://doi.org/10.1016/j.fuel.2020.119665 doi: 10.1016/j.fuel.2020.119665
|
| [66] |
Razzaq L, Mujtaba MA, Soudagar MEM, et al. (2021) Engine performance and emission characteristics of palm biodiesel blends with graphene oxide nanoplatelets and dimethyl carbonate additives. J Environ Manage 282: 111917. https://doi.org/10.1016/j.jenvman.2020.111917 doi: 10.1016/j.jenvman.2020.111917
|
| [67] |
Tomar M, Kumar N (2020) Effect of multi-walled carbon nanotubes and alumina nano-additives in a light duty diesel engine fuelled with schleichera oleosa biodiesel blends. Sustainable Energy Technol Assess 42: 100833. https://doi.org/10.1016/j.seta.2020.100833 doi: 10.1016/j.seta.2020.100833
|
| [68] |
Mei D, Zuo L, Adu-Mensah D, et al. (2019) Combustion characteristics and emissions of a common rail diesel engine using nanoparticle-diesel blends with carbon nanotube and molybdenum trioxide. Appl Therm Eng 162: 114238. https://doi.org/10.1016/j.applthermaleng.2019.114238 doi: 10.1016/j.applthermaleng.2019.114238
|
| [69] |
Chacko N, Jeyaseelan T (2020) Comparative evaluation of graphene oxide and graphene nanoplatelets as fuel additives on the combustion and emission characteristics of a diesel engine fuelled with diesel and biodiesel blend. Fuel Process Technol 204: 106406. https://doi.org/10.1016/j.fuproc.2020.106406 doi: 10.1016/j.fuproc.2020.106406
|
| [70] |
El-Seesy AI, Hassan H (2019) Investigation of the effect of adding graphene oxide, graphene nanoplatelet, and multiwalled carbon nanotube additives with n-butanol-Jatropha methyl ester on a diesel engine performance. Renewable Energy 132: 558-574. https://doi.org/10.1016/j.renene.2018.08.026 doi: 10.1016/j.renene.2018.08.026
|
| [71] |
Debbarma S, Misra RD, Das B (2020) Performance of graphene-added palm biodiesel in a diesel engine. Clean Technol Environ Policy 22: 523-534. https://doi.org/10.1007/s10098-019-01800-2 doi: 10.1007/s10098-019-01800-2
|
| [72] |
Ning L, Duan Q, Chen Z, et al. (2020) A comparative study on the combustion and emissions of a non-road common rail diesel engine fueled with primary alcohol fuels (methanol, ethanol, and n-butanol)/diesel dual fuel. Fuel 266: 117034. https://doi.org/10.1016/j.fuel.2020.117034 doi: 10.1016/j.fuel.2020.117034
|
| [73] |
Rastogi PM, Sharma A, Kumar N (2021) Effect of CuO nanoparticles concentration on the performance and emission characteristics of the diesel engine running on jojoba (Simmondsia Chinensis) biodiesel. Fuel 286: 119358. https://doi.org/10.1016/j.fuel.2020.119358 doi: 10.1016/j.fuel.2020.119358
|
| [74] |
El-Seesy AI, Hassan H, Ookawara S (2018) Effects of graphene nanoplatelet addition to jatropha Biodiesel-Diesel mixture on the performance and emission characteristics of a diesel engine. Energy 147: 1129-1152. https://doi.org/10.1016/j.energy.2018.01.108 doi: 10.1016/j.energy.2018.01.108
|
| [75] |
Bhargavi M, Vinod Kumar T, Ali Azmath Shaik R, et al. (2021) Effective utilization and optimization of waste plastic oil with ethanol additive in diesel engine using full factorial design. Mater Today: Proc. https://doi.org/10.1016/j.matpr.2021.10.310 doi: 10.1016/j.matpr.2021.10.310
|
| [76] |
Loganathan S, Leenus Jesu Martin M, Nagalingam B, et al. (2018) Heat release rate and performance simulation of DME fuelled diesel engine using oxygenate correction factor and load correction factor in double Wiebe function. Energy 150: 77-91. https://doi.org/10.1016/j.energy.2018.02.112 doi: 10.1016/j.energy.2018.02.112
|
| [77] |
Subramani S, Govindasamy R, Rao GLN (2020) Predictive correlations for NOx and smoke emission of DI CI engine fuelled with diesel-biodiesel-higher alcohol blends-response surface methodology approach. Fuel 269: 117304. https://doi.org/10.1016/j.fuel.2020.117304 doi: 10.1016/j.fuel.2020.117304
|
| [78] |
Singh Y, Sharma A, Kumar Singh G, et al. (2018) Optimization of performance and emission parameters of direct injection diesel engine fuelled with pongamia methyl esters-response surface methodology approach. Ind Crops Prod 126: 218-226. https://doi.org/10.1016/j.indcrop.2018.10.035 doi: 10.1016/j.indcrop.2018.10.035
|
| [79] |
Rai A, Kumar NS, Srinivasa Pai P, et al. (2012) Fuzzy Logic Based Prediction of Performance and Emission Parameters of a LPG-Diesel Dual Fuel Engine. Procedia Eng 38: 280-292. https://doi.org/10.1016/j.proeng.2012.06.036 doi: 10.1016/j.proeng.2012.06.036
|
| [80] |
Manigandan S, Atabani AE, Ponnusamy VK, et al. (2020) Effect of hydrogen and multiwall carbon nanotubes blends on combustion performance and emission of diesel engine using Taguchi approach. Fuel 276: 118120. https://doi.org/10.1016/j.fuel.2020.118120 doi: 10.1016/j.fuel.2020.118120
|
| [81] |
Srinidhi C, Madhusudhan A, Channapattana SV, et al. (2021) RSM based parameter optimization of CI engine fuelled with nickel oxide dosed Azadirachta indica methyl ester. Energy 234: 121282. https://doi.org/10.1016/j.energy.2021.121282 doi: 10.1016/j.energy.2021.121282
|
| [82] |
Ghanbari M, Mozafari-Vanani L, Dehghani-Soufi M, et al. (2021) Effect of alumina nanoparticles as additive with diesel-biodiesel blends on performance and emission characteristic of a six-cylinder diesel engine using response surface methodology (RSM). Energy Convers Manage: X 11: 100091. https://doi.org/10.1016/j.ecmx.2021.100091 doi: 10.1016/j.ecmx.2021.100091
|
| [83] |
Fayaz H, Mujtaba MA, Soudagar MEM, et al. (2021) Collective effect of ternary nano fuel blends on the diesel engine performance and emissions characteristics. Fuel 293: 120420. https://doi.org/10.1016/j.fuel.2021.120420 doi: 10.1016/j.fuel.2021.120420
|
| [84] |
Solmaz H, Ardebili SMS, Calam A, et al. (2021) Prediction of performance and exhaust emissions of a CI engine fueled with multi-wall carbon nanotube doped biodiesel-diesel blends using response surface method. Energy 227: 120518. https://doi.org/10.1016/j.energy.2021.120518 doi: 10.1016/j.energy.2021.120518
|
| [85] |
Safieddin Ardebili SM, Taghipoor A, Solmaz H, et al. (2020) The effect of nano-biochar on the performance and emissions of a diesel engine fueled with fusel oil-diesel fuel. Fuel 268: 117356. https://doi.org/10.1016/j.fuel.2020.117356 doi: 10.1016/j.fuel.2020.117356
|


Figures(5) / Tables(5)

Sarbani Daud, Mohd Adnin Hamidi, Rizalman Mamat. A review of fuel additives' effects and predictions on internal combustion engine performance and emissions[J]. AIMS Energy, 2022, 10(1): 1-22. doi: 10.3934/energy.2022001


 DownLoad: