1.
Introduction
Strawberry (Fragaria x ananassa Duch) is a horticultural plant that grows worldwide and grows optimally in cool and humid climatic conditions [1]. This plant is a short-day plant, cultivated well at daytime temperatures of 22 ℃–25 ℃ [2]. Strawberry belongs to the Rosaceae family and the fruit is an aggregate with achenes embedded in the surface of the receptacle. In general, strawberries reproduce by producing runners [3].
Drought is a universal problem, seriously hampering crop production and the quality of strawberry plants. Research aimed at obtaining drought-tolerant crops is needed to reduce the threat to food availability in the future [4]. The effects of drought on plants can be seen in the physiological processes in plants, such as changes in plant structure, leaf morphology, and cell structure. Additionally, changes in stomatal conductance, respiration, and photosynthesis due to the disruption of metabolic functions in plants can also occur [5]. The transport of nutrients from the soil to plants depends on soil moisture (availability of water in the soil). Nutrient transport from root to shoot is also limited by a decrease in transpiration rate caused by water availability restrictions. Nutrient absorption constraints due to drought have negative consequences for plants because it results in a decrease in production. A better understanding of the effects of water stress and plant nutrition is helpful in developing strategies to maximize production and reduce quality degradation of plants [6].
Fertilizer is a substance added to the soil to enhance the plants' growth and yield. Inorganic and organic fertilizers are composed mainly of nitrogen, phosphorus, and potassium (NPK) compounds with secondary nutrients added. Application of organic manure was found to enhance NO3− of the soil [7,8,9]. Results from Alwi Y et al. [10] showed that the plant height, leaves number, leaf area, and dry root weight on wild elephant grass (Pennisetum polystachion) increased significantly (P ≤ 0.05) with NPK fertilizer. In Indonesia, nitrogen (N), phosphorus (P), and potassium (K) fertilizers in the form of Urea, SP 36, and KCl is the common inorganic fertilizer used by farmers. The application of N, P, and K nutrients are essential for plants, and must always be available in the soil [11]. The composited effect fertilizer and water stress on strawberry has been intensively evaluated. However, we are still nowhere nearer to getting a comprehensive assessment of this interaction between fertilizer and water stress on strawberry plants in Indonesia.
In this experiment, we examined the interactive effects of fertilizer sources and water stress on plant growth, leaf gas exchange, and nutrient uptake on strawberry. Our objective was to provide knowledge on efficient management of agronomical input (fertilizer and irrigation) for better growth and quality of strawberry. It was hypothesized that the use of appropriate fertilizer could improve the growth of the strawberry plant and its ability to adapt when subjected to water stress conditions.
2.
Materials and methods
2.1. Study area and experimental design
The experiment was conducted in the glasshouse of Indonesian Citrus and Subtropical Fruit Research Institute (ICSFRI), Batu East Java, Indonesia. This site is situated at 950 m above sea level, Latitude 7°54' 41.4'' (7.9115°5 south, Longitude 112° 32' 20'' (112.5389" east) from April 2019 until August 2019. The mean daily temperatures of 20.8 ℃ and mean relative humidity of 94.2%. This experiment was organized in randomized complete block design (RCBD), with two factors. The first factor was fertilizer sources (P), consisting of 4 levels (P1, P2, P3, P4) and the second factor was the level of water stress (W), consisting of 3 levels (W1, W2, and W3). There were 12 combinations of treatments, replicated three times, two plants per replicate and four plants per destructive, covering 288 plants. The seedlings of strawberry plant used were California strawberry. The seedlings were planted in plastic pots (17 × 12 cm) and filled with a topsoil surface layer. The recommended rates of nitrogen (N): phosphorus (P): potassium (K) fertilizer used for strawberry is 92:90:90 NPK kg/ha and goat dung fertilizer is 20 tons/ha (recommended by the Indonesian National Development Planning Agency/SMCNDPA). Throughout the experiment, fertilizer was applied one week after planting, as much as 1/3 of the recommended dosage. Additional fertilizer (at 1/3 of the recommended dosage) was applied about 5–6 and 8–9 weeks after planting. The detail fertilizer and irrigation interval treatments are given below:
2.2. Determination of field capacity (FC)
The measurement of field capacity to determine the volume of watering was calculated by Hendriyani I S et al. [12]. The planting media in plastic pot was watered until the drip (saturated) and allow to stand for 1–3 days until no water drips. The planting media was weighed to determine the wet and dry weights. The wet weight of planting media was taken when no water dripped from the plastic pot. The dry weight was taken after the planting medium was dried at 100 ℃ for 24 hours to obtain a constant weight. Field capacity is calculated by the formula:
Information: W = field capacity; Tb = wet weight; Tk = dry weight
2.3. Plant growth characteristics
Measurements of plant growth were plant height, leaves number, and canopy width [13,14]. The height of plant was determined by cupping all the leaves each other, then measured from the bottom of the crown to the highest end of the leaf using a ruler. The number of leaves was calculated by counting total leaves per plant from the appearance of the first leaf until the end of the research. The canopy width was recorded for the east-west and north-south in centimeters with a ruler. Measurements plant growth were done biweekly.
2.4. Fresh and dry weight
The fresh weights of the strawberry plants were carried out by weighing the ten randomly selected shoot and root of strawberry plants that have been uprooted and then the roots were washed with water to remove the soil. The fresh weights of the strawberry plants were recorded using a digital balance [15] and expressed in gram (g). The dry weights (g) of the strawberry shoot and root were obtained by separating the fresh shoot and root, put in an envelope, and dried in an oven at a temperature of 70℃ for 48 hours until a constant weight was achieved [16]. The measurement unit for the dry weight of the strawberry plant was in gram (g).
2.5. Destructive chlorophyll content measurements
Fresh leaves (one gram) were chopped into pieces. The extracted pigment was done by grinding the cut tissue in a mortar with glass powder. The homogenate was transferred quantitatively to a Buchner filter with Whatman No.1 filter paper. The filtrate was placed in a 100 mL volumetric flask and filled to a total volume of 100 mL with 96 percent alcohol. A spectrophotometer with two wavelengths (649 and 665 nm) was used to determine the plant extract optical density. The chlorophyll content was determined by Wintermans JFGA et al. [17] using the equation:
Where OD = Optical Density
2.6. Proline content determination
Leaf sample 0.5 g was extracted in sulfosalicylic acid 3% 10 mL. Then the sample was filtered with filter paper (Whatman). The filtrate was taken as much as 2 mL, added with ninhydrin and 100% glacial acetic acid 2 mL. The samples were heated in water bath 100 ℃ for 1 hour. The process was halted by soaking the samples in ice liquid for 15–20 minutes. Added with toluene 4 mL and stirred with the test-tube for 15–20 seconds. Let stand the samples until the toluene phase was separated from the sample solution phase. The toluene phase was determined by using spectrophotometer Shimadzu (UV-1601PC, Japan) at absorbance 520 nm. The proline content was determined by comparison with L-proline as the standard curve. Proline levels are expressed in µmol.g−1 [18].
2.7. Total sugar
Total sugar was analyzed by taking fruit sample (0.5 g) and crushing it in mortar. The sample was homogenized in 5 mL 95% ethanol. The mixture was centrifuged at 4000 rpm for 15 min. The supernatant (1 mL) was mixed with 5 mL of anthrone reagent into the test tube. The test tube was closed and vortexed until homogeneous. After that, the test tube was heated at 100 ℃ water bath for 12 minutes, transferred to the cuvette, and the absorbance was read at a wavelength of 630 nm using a spectrophotometer [19].
2.8. Leaf gas exchange measurement
Leaf gas exchange was measured using LICOR 6400 portable photosynthesis system, a closed system of the infrared gas analyzer. The gas exchange parameters containing the transpiration rate, the net photosyn thetic rate, and the stomatal conductance of the strawberry plant were recorded on fully expanded leaves in standard time (09:00 AM) during data collection. The readings of the photosynthesis rate were expressed in μmol.m−2s−1, transpiration rate (mmol.m−2s−1), and the stomatal conductance (mol.m−2s−1). The WUE was calculated as the ratio of photosynthesis to transpiration rate.
2.9. Nutrient analysis
Nutrient analysis was carried out using the methods described by [20]. For N analysis: 1 g of plant sample was weighed and put into a Kjeldahl flask and 0.7 g of copper sulphate, 1.5 g of K2SO4, and 30 mL of H2SO4 were added to the flask. The digestion block was heated until frothing ceases and boiled briskly until the solution was clear and the digestion was continued for about 30 minutes. The flask was removed from the heater and cooled, 50 mL of water was added, and transferred to a distilling flask. In the receiving conical flask, 25 mL of 0.05 M H2SO4 was placed accurately so that there will be an excess of at least 5 mL of the acid and two drops of methyl red indicator were added. Sodium hydroxide (35 mL of 35%) was added to the distilling flask and heated in the flask for approximately 30 minutes. The excess acid in the distillate was then titrated with 0.1M NaOH.
The P and K analyses were carried out using the methods of [21]. The plant sample (0.5 g) was weighed and put into the digestion tube. Then, 5 mL of HNO3 p.a. and 0.5 ml of HClO4 were added and left one night. The next day, it was heated in digestion blocks at 100 ℃ for one hour, before increasing to 150 ℃. After the yellow steam was used up, the digestion block temperature was increased to 200 ℃. The digestion was complete after white smoke appeared, and the remaining extract was approximately 0.5 mL. The tube was removed and allowed to cool. Dilute the extract with ion-free water to an exact volume of 50 mL and shake with a tube shaker until homogeneous. This extract can then be measured for the P and K contents.
2.10. Statistical and correlation analysis
The Kolmogorov-Smirnov (KS) test was used for testing normality. The analysis of variance (two-way ANOVA) and means comparison were carried out using the SPSS computer software Version 24, developed by IBM corporation. The means comparison was performed using DMRT (Duncan Multiple Range Test) with the least significant level of 5%. The correlation analysis was determined using Pearson's correlation analysis.
3.
Result and discussion
3.1. Plant growth
3.1.1. Plant height
Water stress and fertilizer sources treatments had a significant effect on the plant height of strawberry plants. The interaction effects between water stress and different fertilizer types were significant (Table 2). The plant height differed significantly within different sources of fertilizer under well-watered and water-stressed treatments. Under well-watered conditions, plants with the combination 46:45:45 kg/ha NPK fertilizer + 10 kg/ha goat dung fertilizer (P4W1) showed the highest plant height, followed by P4W2 treatment, at 18.59 cm and 15.39 cm, respectively. It was significantly higher as compared to the plants grown without fertilizer treatments. However, no significant plant height variations were detected between plants grown with P2 and P4 treatment under water stress conditions (2 days irrigation intervals). The results showed that the plant grown without fertilizer had the lowest plant height than the other treatments.
Our findings agree with those by [22], who indicated that deficit irrigation affected plant height of Forage Sorghum. The interaction between the NPK fertilizers and deficit irrigation treatments was significant concerning plant height. According to [23], goat dung manure application enhanced plant height compared to control plants (without fertilizer) in Albemoschus esculentus (okra) plants. The usage of manure affects the accumulation of carbon and nitrogen. [24] stated NPK elements influenced the growth rates of plants, and the usage of manure affects the accumulation of carbon and nitrogen. Nitrogen plays a role in the division and enlargement of cells in the apical meristem. Apical meristem operation produces the development of the shoots such that the plant height increases.
3.1.2. Leaves number
The leaves number was influenced by water stress and fertilizer sources and its interaction effects between water stress and types of fertilizer (Table 2). Under water stress conditions, the highest leaves number was P4W2 treatment (46:45:45 kg/ha NPK fertilizer + 10 kg/ha goat dung fertilizer; 2 days Ⅱ 75% FC) that recorded 14.67 per plant, and the lowest was in P1W3 treatment (without fertilizer) that recorded 5.33 per plant. In W2 treatment, there was no significant effect between the application of 92:90:90 kg/ha NPK fertilizer (P2) and 46:45:45 kg/ha NPK fertilizer + 10 kg/ha goat dung fertilizer (P4). P1 (without fertilizer) had significantly fewer leaves compared to other treatments. Similar studies were reported by [25], who mentioned that decreasing irrigation supplies from 75% to 50% significantly reduced the number of leaves by 15, 6% in wheat (Triticum aestivum). Meanwhile, using fertilizer (organic and inorganic) on strawberry plants improved the number of leaves. This finding was in agreement with [26], who reported that combined manures and NPK fertilizer enhanced the number of leaves per plant on cucumber (Cucumis sativus).
3.1.3. Canopy width
The interaction effects of water stress and fertilizer sources on the canopy's width parameters of the strawberry plant are presented in Table 2. The strawberry plant fertilized with NPK was significantly better in canopy width increment than those with goat dung fertilizer and without fertilizer, but was not significantly different with the combination of 46:45:45 kg/ha NPK fertilizer + 10 kg/ha goat dung fertilizer. The lowest canopy length is recorded in plants that are not applied with any fertilizer. This implied that the application of NPK fertilizer influenced the improvement of the canopy length of the strawberry plants. This study also documented lowered the length of strawberry plants' canopy due to water stress. The decreased canopy length was because of water stress treatments, previously reported by [27]. The canopy area of two tomato cultivars (Sufen 14 and Jinlingmeiyu) declined at drought stress treatment. [28] stated, applying goat manure increased plant canopy on Okra (Abelmoschus esculentus). Goat manure and NPK included in the ideal proposition for the growth of a plant.
3.2. Shoot and root fresh weight
The results showed that water stress and sources of fertilizer treatments had significant differences for shoot fresh weight (SFW) and root fresh weight (RFW). A significant interaction occurred between water stress and sources of fertilizer treatments on RFW and SFW (Table 2). Organic (goat dung) and inorganic (NPK) fertilizers improved the shoot and root fresh weight. In water-stressed conditions (2 days irrigation interval), the maximum fresh weight values were observed in the combination of 46:45:45 kg/ha NPK fertilizer + 10 kg/ha goat dung fertilizer (P4) at 29.36 g (SFW) and 21.57 g (RFW). These results increased by 84.91% and 66.03%, respectively, compared to the no-fertilization treatment under water-stressed conditions. The increasing biomass on the strawberry plant with NPK fertilizer application is similar to [29]; NPK fertilizer enhanced the biomass (fresh weight of shoot) on maize seedlings compared to without nutrient application well-watered and the drought treatments.
3.3. Shoot and root dry weight
Water stress and fertilizer sources treatments had a significant effect on the shoot and root dry weights of strawberry plants, and the interaction between both treatments was significant (Table 2). The duration of water stress caused the shoot and root dry weight of the strawberry plants to be reduced. Under water-stressed conditions with 6 days of irrigation interval had a shoot dry weight (SDW) and root dry weight (RDW) of 3.76 g and 2.82 g, respectively. This value decreased when compared with the SDW and RDW on 2 days irrigation intervals at 36.55% (SDW) and 38.19% (FDW), respectively. The current study's results showed that the application of organic (goat dung) and inorganic (NPK) fertilizers increased the strawberry plant's shoot and root dry weights. The total shoot and root dry weights of strawberries under the well-watered and water stress treatments are shown in Table 2. Strawberry plants treated with the combination of 46:45:45 kg/ha NPK fertilizer + 10 kg/ha goat dung fertilizer; daily irrigation 100% FC (P4W1) had higher shoot and root dry weights than those plants grown without fertilizer. Inorganic (NPK) and organic (goat dung) fertilizer treatments improved the dry weight of shoot and root. In contrast, water stress treatment reduced dry weight of shoot and root. Similar findings by [30] and [31] also showed that water stress declined total biomass on Jerusalem artichoke (Helianthus tuberosus), Bothriochloa ischaemum and Lespedeza davurica.
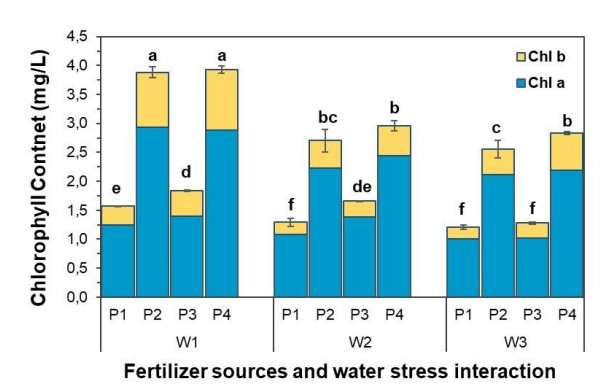
3.4. Chlorophyll (chl) content
Based on the results, chlorophyll content was significantly different within water stress and different fertilizer types treatments. Also, there were significant interactions between water stress and sources of fertilizer treatments on chlorophyll a, chlorophyll b, and total chlorophyll of the strawberry plant, as shown in Figure 1. Strawberry plants fertilized with organic and inorganic fertilizer had higher chlorophyll content than control plants (without fertilizer). The results showed that the combination of 46:45:45 kg/ha NPK fertilizer + 10 kg/ha goat dung fertilizer application at well-watered conditions had the highest value of chlorophyll a, chlorophyll b, and total chlorophyll than other treatments. But this treatment was not significantly different from 92:90:90 kg/ha NPK fertilizer treatment on chlorophyll a dan total chlorophyll. Overall, strawberry plants in the current research had chlorophyll a value higher than chlorophyll b. According to [32,33], goat manure has a higher nitrogen content, which is an essential mineral nutrient needed by plants for its growth and involved with the synthesis of chlorophyll.
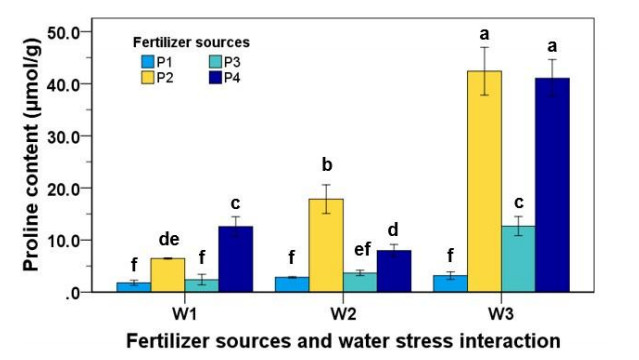
3.5. Proline content
There were significant interaction effects between water stress and fertilizer sources on proline content (Figure 2). The average proline content in water stress treatment of strawberry leaves was between ½ to 5 times higher than the strawberry plant grown in well-watered conditions. This showed that water stress plants tended to increase proline content in the strawberry plants. Fertilizer treatment also had a significant effect on proline content. NPK fertilizer (P2), goat dung fertilizer (P3), and the combination of NPK and goat dung fertilizer (P4) were between 1 to 5 times higher than the plants planted without fertilizer. On the contrary, there was no significant difference in proline content when the plant was without fertilizer treatment in all water levels treatment.
In this study, water stress treatments significantly enhanced the proline content of strawberry plants in all fertilizer treatments. This was strengthened by findings from [10], who noted that the content of proline was significantly enhanced (P ≤ 0.05) on wild elephant grass due to the treatment of water stress. Water stress levels up to 40% of field capacity recorded the maximum proline content. According to Mafakheri A et al. [34] and Pessarakli M et al. [35], proline has numerous functions in plants, for example, plays a central role in the plant stress response. The accumulation of proline on dehydration due to water deficit or increasing osmotic pressure describes the osmoregulatory function of proline in stressed plants conditions. Proline, an osmoprotectant with a sink for strength to adjust potentials of redox, was discovered to have improved accumulation in drought-tolerant cultivars of chickpea.
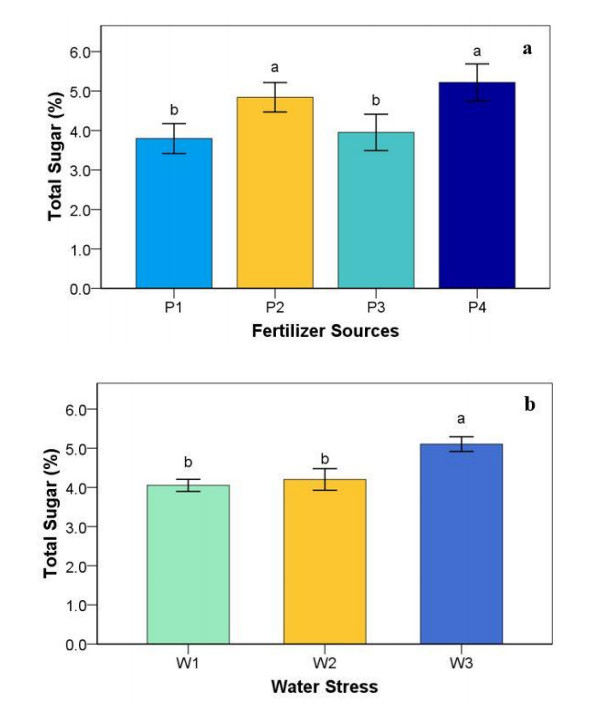
3.6. Total sugar
From Figure 3 below, different levels of water stress and sources of fertilizer significantly affected the sugar content of strawberry fruits. However, no interaction effects were observed between water stress and sources of fertilizer treatments. It can be seen that the combination of 46:45:45 kg/ha NPK fertilizer + 10 kg/ha goat dung fertilizer had the highest sugar content, but this treatment was not significantly different from the 92:90:90 kg/ha NPK fertilizer treatment. The enhancement of sugar content is facilitated by reducing the water content of fruits. The sugar content values were within the range of 3.79–5.22. The lowest sugar content was in the plants that were grown without fertilizer and 75% FC with 6 days irrigation interval treatments.
In total sugar, water stress treatments increased total sugar on strawberry fruits in all application organic and inorganic fertilizers. The total sugar of strawberry fruits was higher in water-stressed conditions compared to well-watered. This is in line with the research of Nohong B et al. [36], whereby total soluble sugars caused by water stress improved by up to 126% relative to well-watered conditions.
3.7. Leaf gas exchange
Leaf gas exchange (transpiration rate, stomatal conductance, and photosynthesis rate) indicated a significant difference in sources of fertilizer and water stress treatments. The interaction between both treatments was significant on the leaf gas exchange of strawberry plants, as shown in Table 3. The strawberry plant's leaf gas exchange parameters mostly declined when the water deficit and duration irrigation interval increased. The leaf gas exchange results in well-watered strawberry plants remained higher than those plants planted under water stress treatments.
The transpiration rate value of P4W1 treatment was higher than other treatments. The transpiration rate decreased gradually with increasing water stress. It started to decline after the treatment application of 2 days irrigation interval. The transpiration rate of this treatment ranged from 2.19 to 1.50 mmol.m−2s−1. At the 6-day irrigation interval, the transpiration rate decreased further, with a range of 0.51–0.68 mmol.m−2s−1. The transpiration rate was reduced by 32.88–85.12% compared to plants provided with water under field capacity conditions. The lowest transpiration rate was obtained in P2W3 treatment.
According to Table 3, results showed significant interactions between water stress and fertilizer sources on the stomatal conductance between both factors. Water stress significantly reduced the stomatal conductance of strawberry plants. In well-watered conditions, the result of gs at P2W1 was not significantly different from P4W1, while in water-stressed conditions with an irrigation interval of 6 days, the gs of plants planted with fertilization was not significantly different from control plants (without fertilization). The highest and lowest gs were recorded in well-watered plants with 92:90:90 kg/ha NPK fertilizer (P2W1) and water stress (6 days irrigation interval) with 20 kg/ha goat dung fertilizer (P3W3), respectively.
From the present study results, it was observed that the photosynthesis rate was influenced by water stress and sources of fertilizer. There were interaction effects between water stress and sources of fertilizer on the photosynthesis rate, as shown in Table 3. Generally, the photosynthesis rate was highest under well-watered with 46:45:45 kg/ha NPK fertilizer + 10 kg/ha goat dung fertilizer (P4W1) with a value of 16.20 µmol.m−2s−1. This result was not significantly different from P2W1 treatment. The results also indicated that as water stress increased, the photosynthesis rate declined. It decreased progressively during the length of the irrigation interval. Water stress with the 6 days irrigation interval had the lowest value on the photosynthesis rate with a decrease by 51.39% compared to well-watered treatment (watering daily).
The interaction effects of different water stress levels within different types of fertilizer on water use efficiency (WUE) are presented in Table 3. In this study, the results indicated that WUE responded to altering water stress levels. The WUE tended to enhance with increased water stress. It was observed that the WUE for the plants grown under water stress with 6 days irrigation interval was significantly higher by 60.66% compared to well-watered (daily watering). However, no significant difference in WUE between fertilizer treatment and control (without fertilizer) was noted. The lowest WUE was obtained in strawberry plants with sufficient water without fertilizers (P1W1).
The leaf gas exchange parameters generally decreased under water stress conditions. The leaf gas exchange results of well-watered strawberry plants persisted above those planted under water stress treatment. The length of the irrigation interval (6 days irrigation interval) had the lowest photosynthetic rate (Pn), transpiration rate (E), stomatal conductance (gs). The current result was in agreement with the research by Sarazin V et al. [37]; the water deficit application decreased the transpiration rate on Helianthus annuus significantly. It was revealed that enhanced water stress conditions might be an integral function of increased tolerance of water stress. The response to water stress in plants increases the abscisic acid (ABA), which eventually causes stomatal closure to avoid water shortages [38]. Stomatal closure induced CO2 assimilation declined, especially those of CO2 fixation and synthesis of adenosine triphosphate [39]. Our results indicated that 92:90:90 kg/ha NPK fertilizer treatment in water-stressed conditions (2 days irrigation interval) increased leaf gas exchange on strawberry plants. The improvement of leaf gas exchange with NPK fertilizer application was also observed in Gossypium hirsutum [40]. The application of NPK fertilizer has several advantages. Nitrogen (N) is an element that plays a role in biological processes and a major component of protein; whereas phosphorus (P) fertilizer is related to the process of plant development. Moreover, potassium is involved in drought tolerance, photosynthesis processes, and protein synthesis [41].
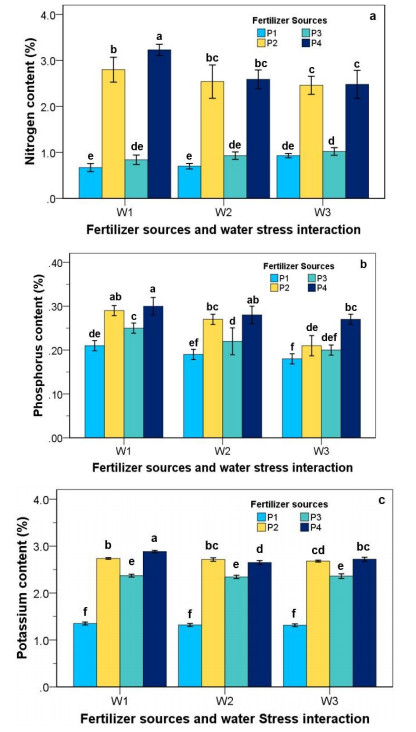
3.8. Nitrogen (N), Phosphorus (P), Potassium (K) content
As mentioned in Figure 4a, water stress and fertilizer sources and their interaction significantly influenced the nitrogen content of strawberry plants. Water stress clearly caused a declined in nitrogen content, but the application of organic and inorganic fertilizer (goat dung and NPK fertilizer) increased the nitrogen content in all irrigation regimes. The highest nitrogen content was observed in P4W1 treatment at 3.32%. Under water-stressed conditions (2- and 6-days irrigation interval), the highest nitrogen content was obtained by adding a combination of 46:45:45 kg/ha NPK fertilizer + 10 kg/ha goat dung fertilizer treatment. P1 treatment (without fertilizer) had the lowest nitrogen content compared with other treatments in all irrigation regimes.
Water stress and fertilizer sources and their interaction significantly influenced the phosphorus content of strawberry plants (Figure 4b). The content of phosphorus increased with fertilizer supply (NPK and goat dung fertilizer). In contrast, the phosphorus content was reduced with water stress application. Application of P2 and P4 treatments had no significant difference in phosphorus content. The content of phosphorus at P4W1 was significantly higher than in other treatments. Whereas, the lowest phosphorus content in this research was P1W3.
Potassium contents in the strawberry plants are presented in Figure 4c. Statistical analysis showed that the water stress and fertilizer sources significantly influenced the potassium contents. Potassium contents decreased with increased water stress treatment, where W2 and W3 treatments showed lower potassium contents than W1 (water field capacity treatment). However, in fertilizer treatment, 46:45:45 kg/ha NPK fertilizer + 10 kg/ha goat dung fertilizer significantly affected the potassium contents more than other fertilizer treatments. The highest potassium content was observed in P4W1, followed by P2W1 at 2.88% and 2.74%, respectively. The lowest potassium content was P1W3 treatment.
The effects of water stress and fertilizer sources on N, P, and K content on the strawberry plant was observed significantly differently (P ≤ 0.05). The N, P, and K content were significantly reduced with increased water stress. Besides, the N, P, and K content in P1 (without fertilizer) treatment was the lowest result compared to that of organic (goat dung fertilizer), inorganic (NPK fertilizer), or combination NPK fertilizer + goat dung fertilizer treatment. This indicates that water stress reduced N, P, and K content, as Hussain H.A et al. [42] reported on maize cultivars (Xida 319). The content of N, P and K decreased under water-stressed conditions by 15.63%, 14.72%, and 17.47%, respectively, compared to well-watered treatment (control). The strawberry plant without fertilizer had the lowest N, P, and K content than other treatments. Similarly, Dania SO et al. [43] reported that N and K content significantly decreased in Moringa (Moringa oleifera) seedling without fertilizer treatments. Sudradjat et al. [44] explained that it is necessary for plants to receive nutrients that originated from inorganic and organic fertilizers. Compound fertilizers such as NPK are available in inorganic fertilizers. Inorganic fertilizers have high nutrients substance and are immediately available to plants, while organic fertilizers lead a higher role in enhancing the soil's physical, chemical, and biological properties.
3.9. Correlation between parameters
The correlation between the parameter was significant at P ≤ 0.01. The correlation between the variables was explored after applying water stress and fertilizer sources treatments (Table 4). There was a positive and negative correlation between most parameters (growth, leaf gas exchange, and nutrient uptake). The results indicated that plant height was significantly and positively correlated (P ≤ 0.01) with shoot fresh weight (r = 0.921), root fresh weight (r = 0.797), shoot dry weight leaf area (r = 0.913), root dry weight (r = 0.700), chlorophyll content (r = 0.858), indicating that the increase in plant height followed in enhancing in shoot fresh weight, root fresh weight, leaf area shoot dry weight, root dry weight, chlorophyll content, nitrogen content, phosphorus content and potassium content of strawberry plants. Photosynthesis rate also had positively and strong correlated (P ≤ 0.01) with transpiration rate (r = 0.879) and stomatal conductance (r = 0.886). The strong correlation between photosynthesis rate with stomatal conductance shows to indicate an adjustment of stomatal conductance to match the essential capacity of photosynthetic [45].
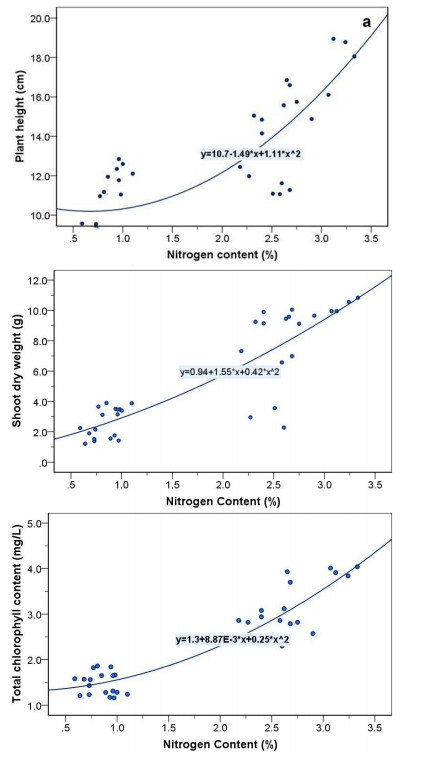
Interestingly, Figure 5. shows the relationship between plant height, shoot dry weight, and chlorophyll content with nitrogen content of strawberry plant as affected by water stress. The nitrogen content had highly correlated to plant height (r = 0.805), shoot dry weight (r = 0.865), and total chlorophyll content (r = 0.921). Phosphorus content had highly correlated to number of leaves (r = 0.864), shoot fresh weight (r = 0.855), and shoot dry weight (r = 0.911). Potassium content had highly correlated to plant height (r = 0.804), canopy width (r = 0.773), and shoot fresh weight (r = 0.815). On the other hand, the results indicated that prolin content was negatively correlated (P ≤ 0.01) with photosynthesis rate (r = −0.611), transpiration rate (r = −0.538) and stomatal conductance (r = −0.505). In term of WUE, it also showed a significant negative correlation (P ≤ 0.01) photosynthesis rate (r = −0.752), transpiration rate (r = −0.902) and stomatal conductance (r = −0.814), indicating that the increase in water use efficiency followed in decrease in photosynthesis rate, transpiration rate and stomatal conductance.
4.
Conclusions
The present study performed that the interaction of different water stress and fertilizer types had a significant effect on all parameters (the growth, leaf gas exchange, and nutrient uptake) except in the total sugar of strawberry fruits. The results indicate that plant growth, leaf gas exchange and nutrient uptake decreased under water stress conditions whereas total proline, total sugar, and water use efficiency (WUE) enhanced under water stress conditions. The maximum value of plant height, leaves number, shoot-root fresh weight, shoot-root dry weight, photosynthesis rate, chlorophyll content, nitrogen content and phosphorus content was obtained from the application of 46:45:45 kg/ha NPK fertilizer + 10 kg/ha goat dung fertilizer at 2 days Ⅱ 75% FC. Additionally, the application of NPK and goat dung fertilizers increased growth and leaf gas exchange under water-stressed conditions. Plants that were not fertilized had the lowest growth compared to those with fertilizers. This research is intended to be beneficial in developing strategies to mitigate the impact of water stress on strawberry plants through the use of fertilizer in Indonesia.
Acknowledgements
This research was funded by the Sustainable Management of Agricultural Research and Technology Dissemination (SMARTD) Program of Indonesian Agency for Agricultural Research and Development no. B-2816/KP.320/H.1/10/2016.
Conflict of interest
The authors declare no conflict of interest.


 DownLoad: