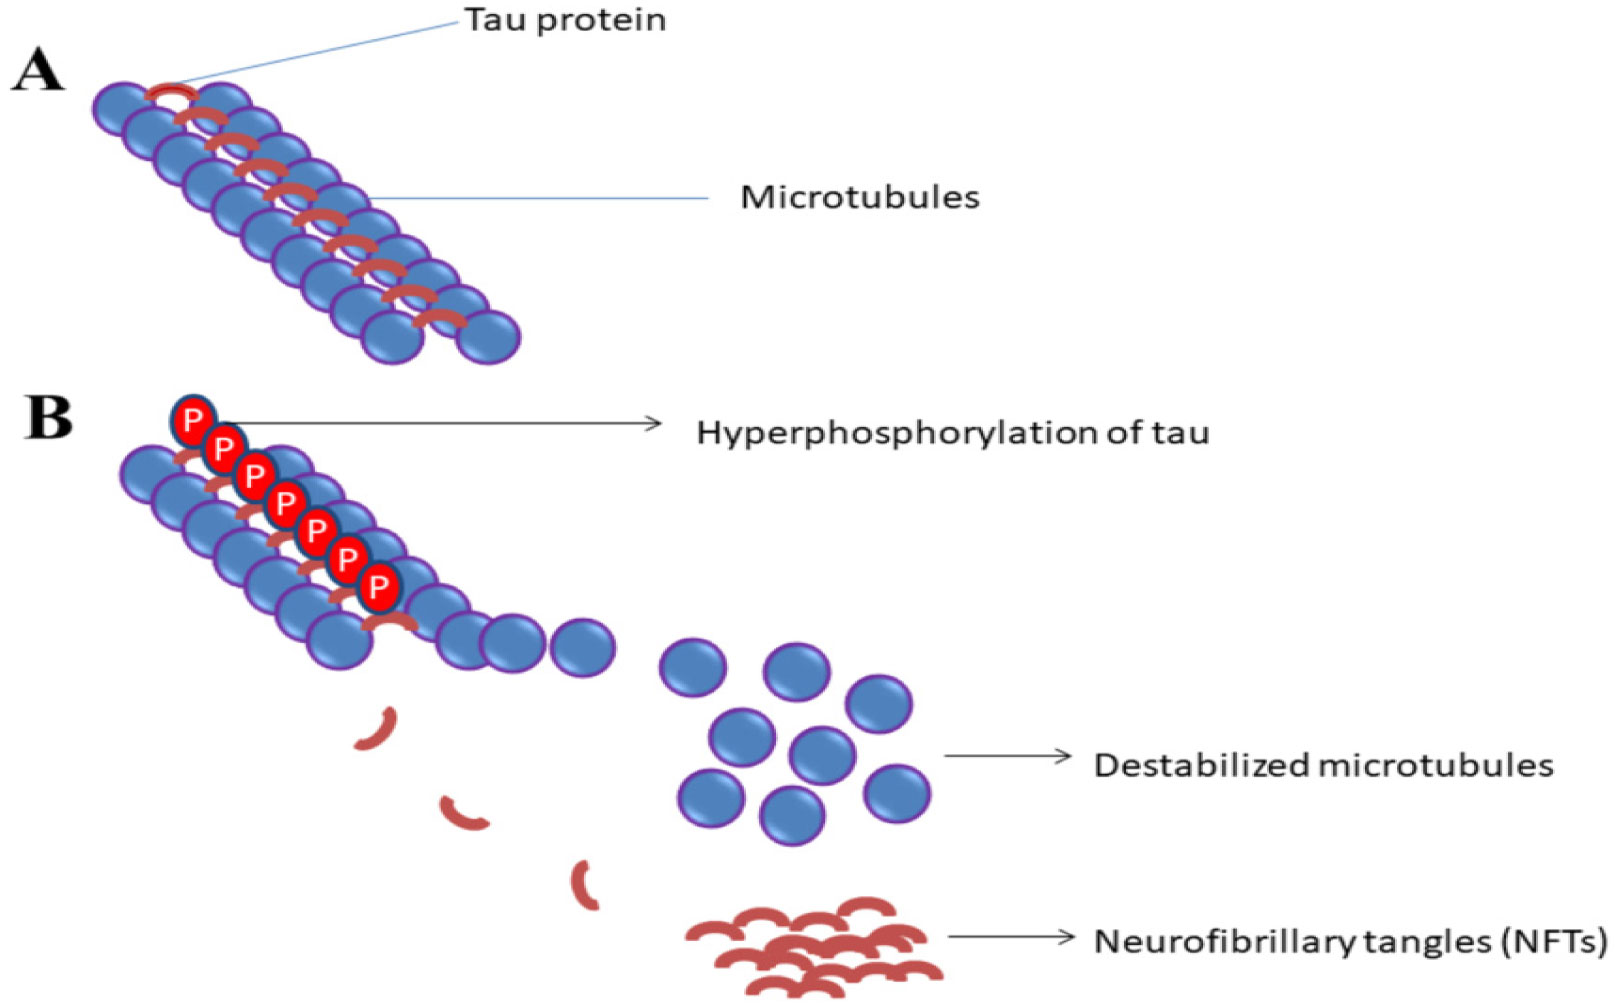
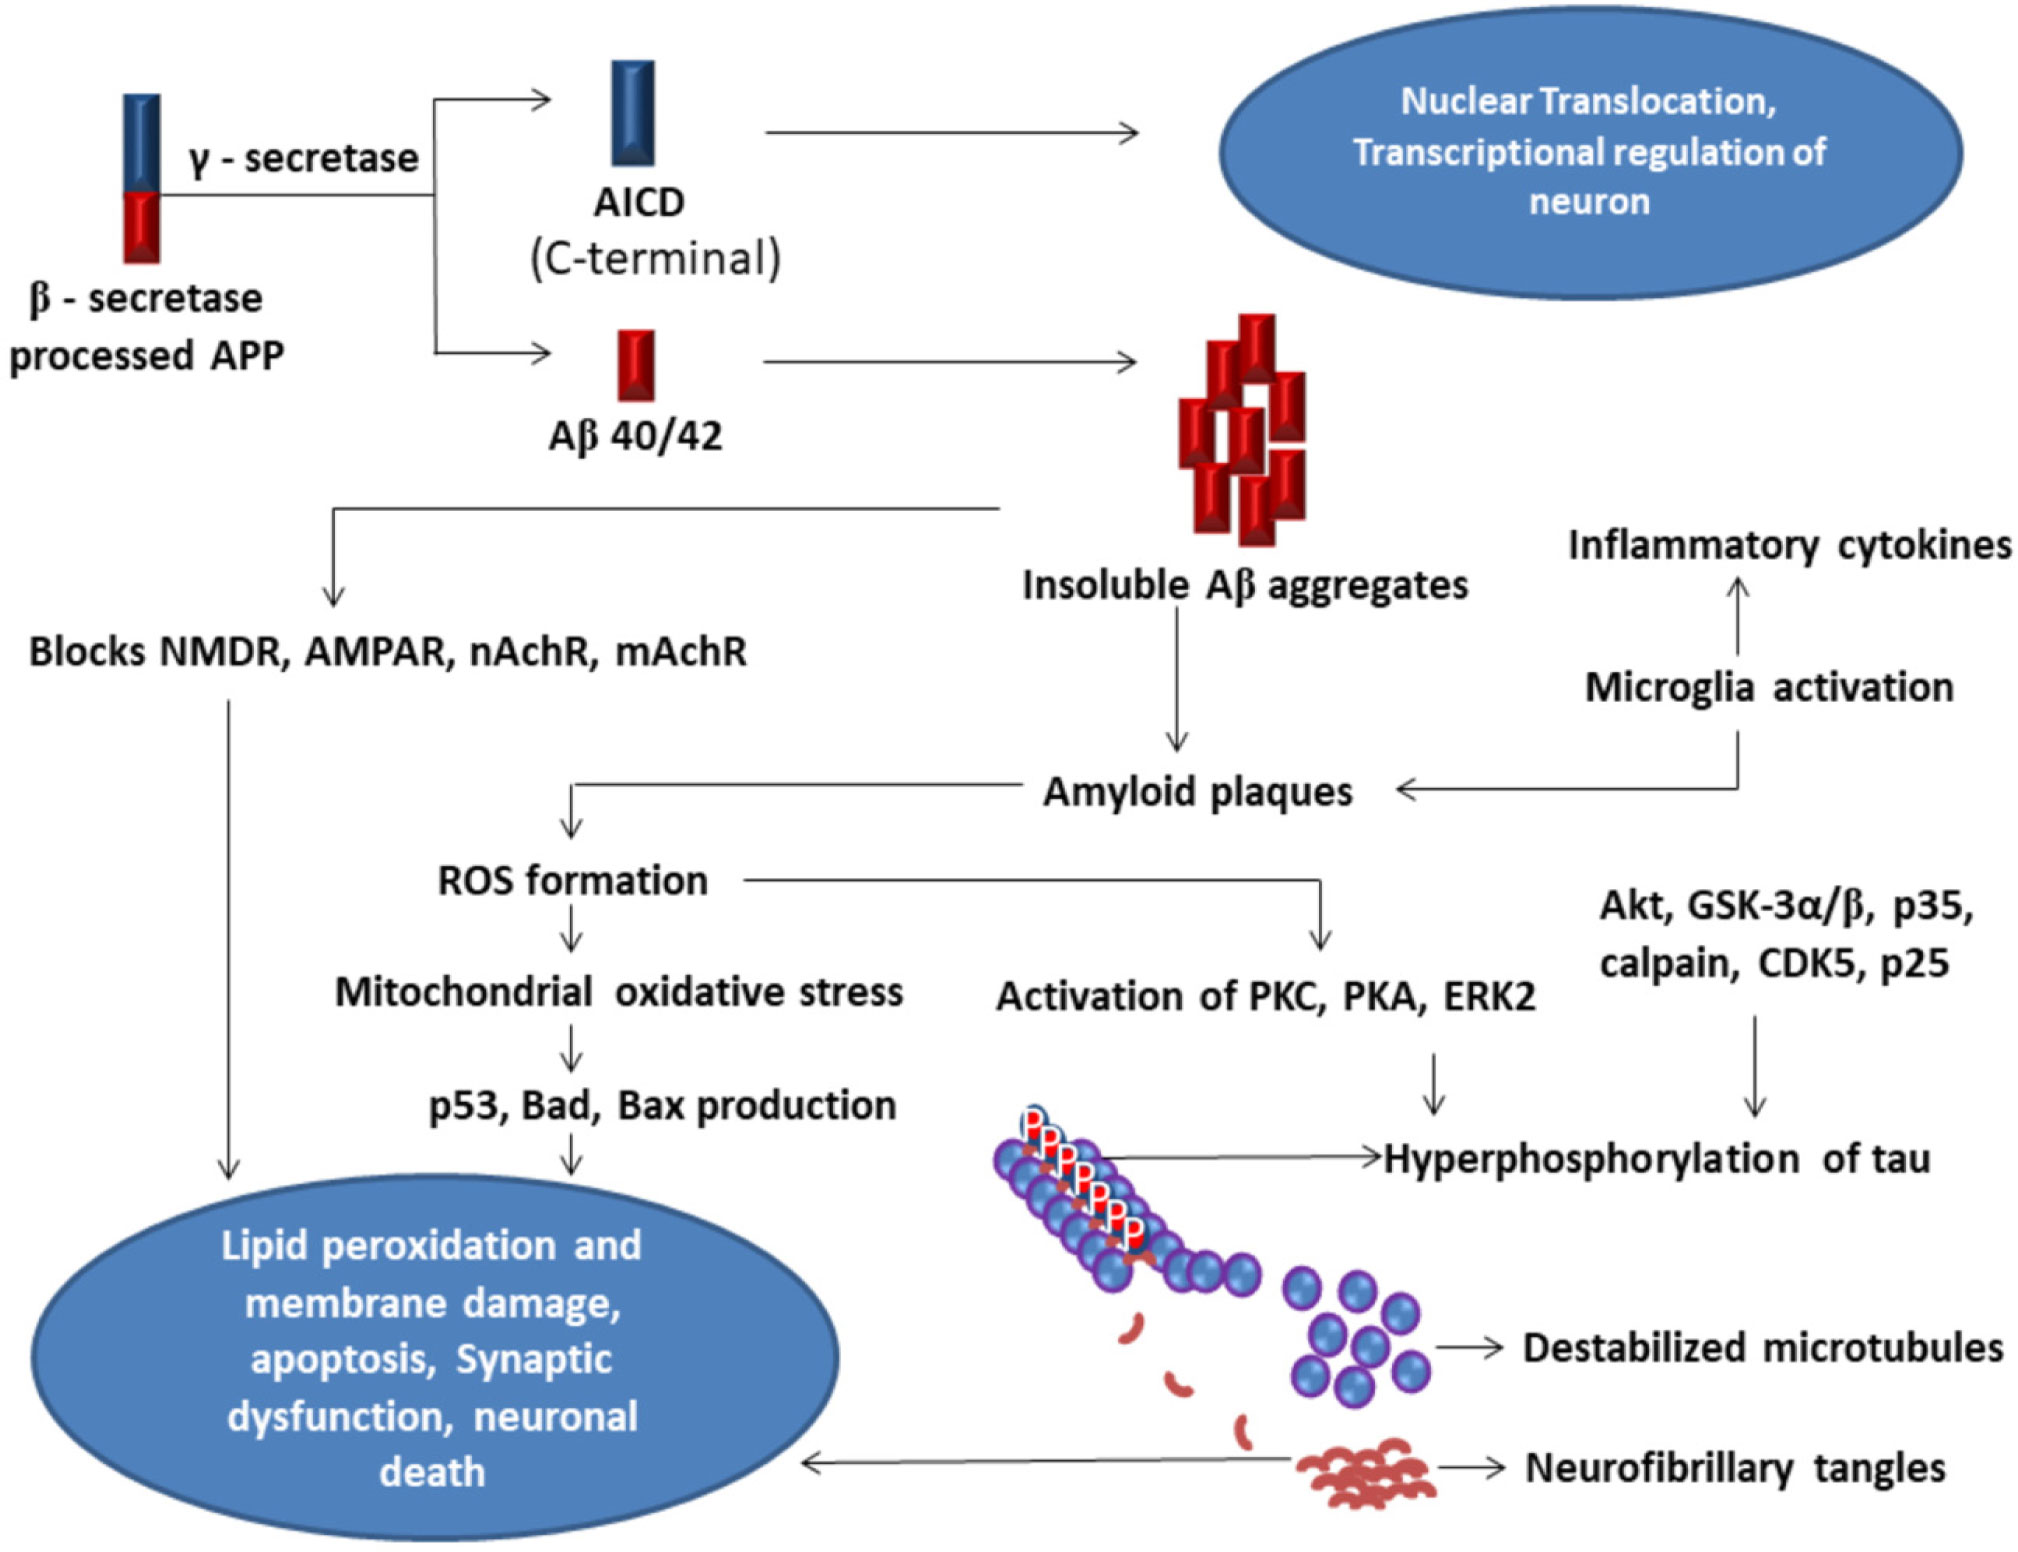
Alzheimer's disease (AD) is one of the most common, severe neurodegenerative brain disorder characterized by the accumulation of amyloid-beta plaques, neurofibrillary tangles in the brain causing neural disintegration, synaptic dysfunction, and neuronal death leading to dementia. Although many US-FDA-approved drugs like Donepezil, Rivastigmine, Galantamine are available in the market, their consumption reduces only the symptoms of the disease but fails in potency to cure the disease. This disease affects many individuals with aging. Combating the disease tends to be very expensive. This review focuses on biochemical mechanisms in the neuron both at normal and AD state with relevance to the tau hypothesis, amyloid hypothesis, the risk factors influencing dementia, oxidative stress, and neuroinflammation altogether integrated with neurodegeneration. A brief survey is carried out on available biomarkers in the diagnosis of the disease, drugs used for the treatment, and the challenges in approaching therapeutic targets in inhibiting the disease pathologies. This review conjointly assesses the demerits with the inefficiency of drugs to reach targets, their side effects, and toxicity. Optimistically, this review directs on the advantageous strategies in using nanotechnology-based drug delivery systems to cross the blood-brain barrier for improving the efficacy of drugs combined with a novel neuronal stem cell therapy approach. Determinately, this review aims at the natural, non-therapeutic healing impact of physical exercise on different model organisms and the effect of safe neuromodulation treatments using repetitive Transcranial Magnetic Stimulation (rTMS), transcranial Electrical Stimulation (tES) in humans to control the disease pathologies prominent in enhancing the synaptic function.
Citation: Kiran Kumar Siddappaji, Shubha Gopal. Molecular mechanisms in Alzheimer's disease and the impact of physical exercise with advancements in therapeutic approaches[J]. AIMS Neuroscience, 2021, 8(3): 357-389. doi: 10.3934/Neuroscience.2021020
Alzheimer's disease (AD) is one of the most common, severe neurodegenerative brain disorder characterized by the accumulation of amyloid-beta plaques, neurofibrillary tangles in the brain causing neural disintegration, synaptic dysfunction, and neuronal death leading to dementia. Although many US-FDA-approved drugs like Donepezil, Rivastigmine, Galantamine are available in the market, their consumption reduces only the symptoms of the disease but fails in potency to cure the disease. This disease affects many individuals with aging. Combating the disease tends to be very expensive. This review focuses on biochemical mechanisms in the neuron both at normal and AD state with relevance to the tau hypothesis, amyloid hypothesis, the risk factors influencing dementia, oxidative stress, and neuroinflammation altogether integrated with neurodegeneration. A brief survey is carried out on available biomarkers in the diagnosis of the disease, drugs used for the treatment, and the challenges in approaching therapeutic targets in inhibiting the disease pathologies. This review conjointly assesses the demerits with the inefficiency of drugs to reach targets, their side effects, and toxicity. Optimistically, this review directs on the advantageous strategies in using nanotechnology-based drug delivery systems to cross the blood-brain barrier for improving the efficacy of drugs combined with a novel neuronal stem cell therapy approach. Determinately, this review aims at the natural, non-therapeutic healing impact of physical exercise on different model organisms and the effect of safe neuromodulation treatments using repetitive Transcranial Magnetic Stimulation (rTMS), transcranial Electrical Stimulation (tES) in humans to control the disease pathologies prominent in enhancing the synaptic function.
Alzheimer's disease
Amyloid-beta
Neurofibrillary Tangles
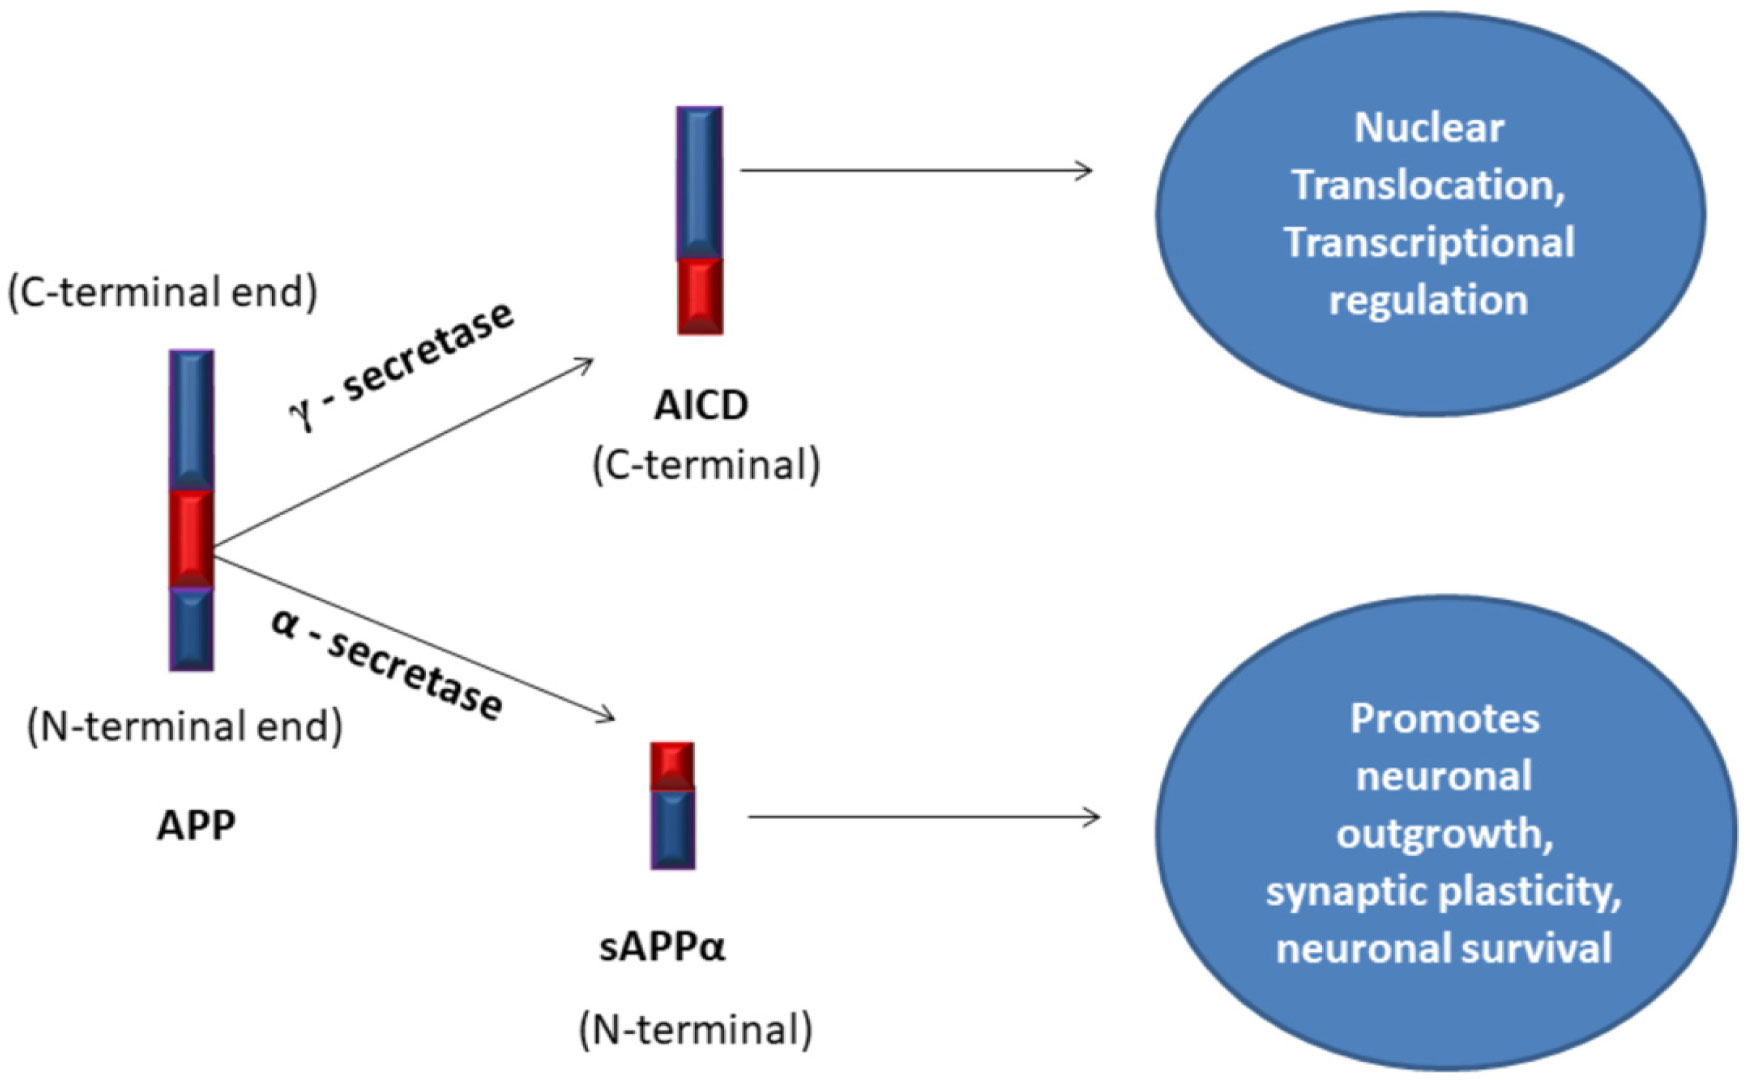
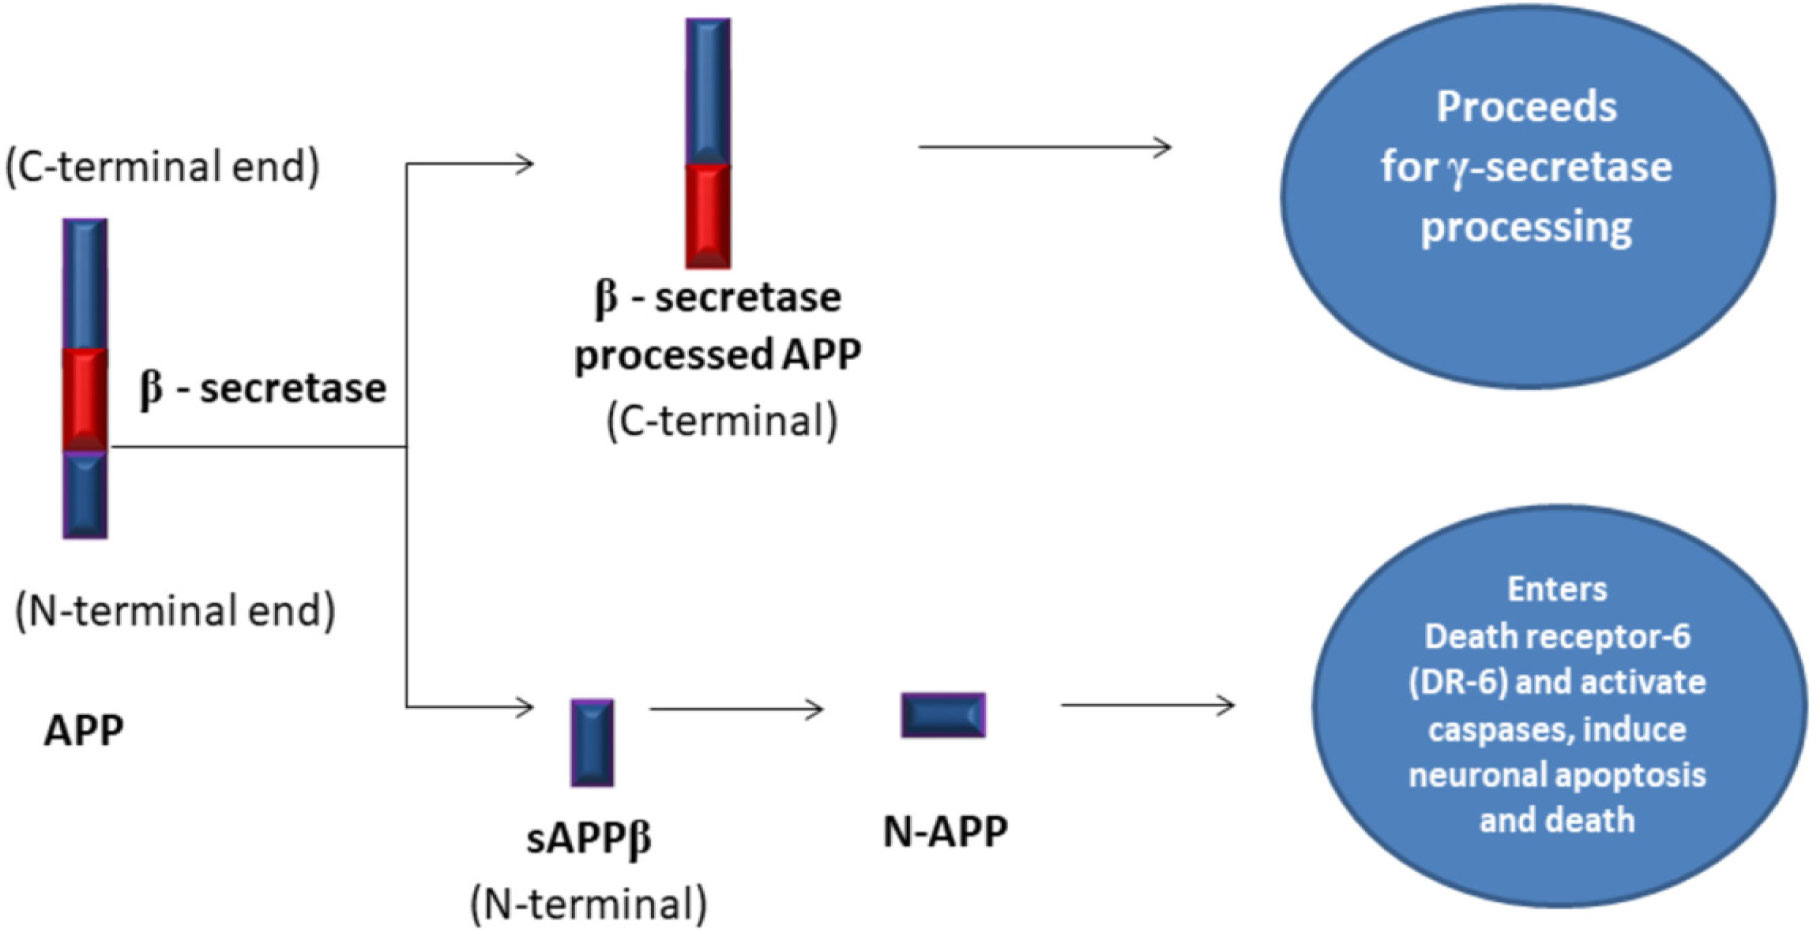
Amyloid Precursor Protein
soluble Amyloid Precursor Protein alpha
Amyloid Precursor Protein Intra Cellular Domain
N-Methyl-D-Aspartate Receptor
α-Amino-3-hydroxy-5-Methyl-4-isoxazole Propionic acid Receptor
nicotinic Acetylcholine Receptors
muscarinic Acetylcholine Receptors
soluble Amyloid Precursor Protein beta
Reactive Oxygen Species
Protein Kinase C
Protein Kinase A
Extracellular signal-Regulated Kinases2
Cyclin-Dependent Kinases 5
AcetylcholinEsterase
Cerebro Spinal Fluid
Positron Emission Tomography
Blood-Brain Barrier
Physical Exercise
Dementia with Lewy Bodies
FrontoTemporal Dementia
Magnetic Resonance Imaging
functional Magnetic Resonance Imaging
repetitive Transcranial Magnetic Stimulation
transcranial Electrical Stimulation
transcranial Direct Current Stimulation
transcranial Alternating Current Stimulation
transcranial Random Noise Stimulation
transcranial Pulsed Current Stimulation
Mild Cognitive Impairment
Dynamin-related protein-1
Presenilin-1
Presenilin-2
Insulin Degrading Enzyme
Parkinson's Disease
Apolipoprotein-E
Protein Kinase B
Glycogen synthase kinase 3α/β
Electron Transport Chain
Insulin-like Growth Factor-1
Interleukin-6
Nitrous Oxide Synthase-2
Nuclear Factor Kappa B
Lipoprotein Receptor-related Protein-1
Orexin-A
Orexin-B
G-Protein-Coupled Receptors
Orexin Receptor-type-1
Orexin Receptor-type-2
Brain-Derived Neurotrophic Factor
Obstructive Sleep Apnea (OSA)
Central Disorders of Hypersomnolence
Rapid Eye Movement
Electroencephalogram
Traumatic Brain Injury
123I-Meta-IodoBenzylGuanidine
[11C]-Pittsburgh compound B
Fluorine 18-labeled
Montreal Cognitive Assessment
Total tau
phosphorylated-tau
Visinin-Like Protein
Neuro Filament Light Protein
Heart Fatty Acid Binding Protein
Neuron-Specific Enolase
Chitinase-3-like protein-1
Tumor Necrosis Factor Ligand Superfamily member-10
Angiotensin-Converting Enzyme
triple-transgenic-AD
Voxel-Based Morphometry

| [1] |
Drachman DA (2005) Do we have brain to spare? Neurology 64: 2004-2005. doi: 10.1212/01.WNL.0000166914.38327.BB

|
| [2] |
Beul SF, Hilgetag CC (2019) Neuron density fundamentally relates to architecture and connectivity of the primate cerebral cortex. Neuroimage 189: 777-792. doi: 10.1016/j.neuroimage.2019.01.010
|
| [3] | Cunningham EL, McGuinness B, Herron B, et al. (2015) Dementia. Ulster Med J 84: 79-87. |
| [4] | Alzheimer's Disease International (2014) Dementia in the Asia Pacific Region. Alzheimer's Disease International Report, London Available from: https://www.alzint.org/resource/dementia-in-the-asia-pacific-region/. |
| [5] | Europe A (2019) Dementia in Europe yearbook 2019: Estimating the prevalence of dementia in Europe Luxembourg: Alzheimer Europe, 1-102. |
| [6] | Alzheimer's disease facts and figures (2020) Alzheimer's Dement. Alzheimer's Association Report 2020 Available from: https://doi.org/10.1002/alz.12068. |
| [7] | Kumar CTS, Shaji KS, Varghese M, et al. (2019) Dementia in India 2020 Cochin: Alzheimer's and Related Disorders Society of India (ARDSI), 1-96. |
| [8] |
Barnes DE, Yaffe K (2011) The projected effect of risk factor reduction on Alzheimer's disease prevalence. Lancet Neurol 10: 819-828. doi: 10.1016/S1474-4422(11)70072-2
|
| [9] | Fleming R, Zeisel J, Bennett K (2020) World Alzheimer Report 2020: Design Dignity Dementia: dementia-related design and the built environment Volume 1: Case Studies London, England: Alzheimer's Disease International, 1-248. |
| [10] |
Trevisan K, Cristina-Pereira R, Silva-Amaral D, et al. (2019) Theories of Aging and the Prevalence of Alzheimer's Disease. Biomed Res Int 2019: 1-9. doi: 10.1155/2019/9171424
|
| [11] | Alzheimer A (1987) About a peculiar disease of the cerebral cortex. By Alois Alzheimer, 1907 (Translated by L Jarvik and H Greenson). Alzheimer Dis Assoc Disord 1: 3-8. |
| [12] |
Tiraboschi P, Hansen LA, Thal LJ, et al. (2004) The importance of neuritic plaques and tangles to the development and evolution of AD. Neurology 62: 1984-1989. doi: 10.1212/01.WNL.0000129697.01779.0A
|
| [13] |
Carter J, Lippa CF (2001) Beta-Amyloid, Neuronal Death and Alzheimers Disease. Curr Mol Med 1: 733-737. doi: 10.2174/1566524013363177
|
| [14] |
Medina M, Hernández F, Avila J (2016) New features about tau function and dysfunction. Biomolecules 6: 21. doi: 10.3390/biom6020021
|
| [15] |
Castellani RJ, Perry G (2019) Tau biology, tauopathy, traumatic brain injury, and diagnostic challenges. J Alzheimers Dis 67: 447-467. doi: 10.3233/JAD-180721
|
| [16] |
Zvěřová M (2019) Clinical aspects of Alzheimer's disease. Clin Biochem 72: 3-6. doi: 10.1016/j.clinbiochem.2019.04.015
|
| [17] |
Yang Y, Kandiah N, Kim S, et al. (2020) Clinical aspects of neurobehavioral symptoms of dementia. Dement Neurocogn Disord 19: 54-64. doi: 10.12779/dnd.2020.19.2.54
|
| [18] |
Raz L, Knoefel J, Bhaskar K (2016) The neuropathology and cerebrovascular mechanisms of dementia. J Cereb Blood Flow Metab 36: 172-186. doi: 10.1038/jcbfm.2015.164
|
| [19] |
Livingston G, Huntley J, Sommerlad A, et al. (2020) Dementia prevention, intervention, and care: report of the Lancet Commission. Lancet 396: 413-446. doi: 10.1016/S0140-6736(20)30367-6
|
| [20] |
Kelly AM (2018) Exercise-induced modulation of neuroinflammation in models of Alzheimer's disease. Brain Plast 4: 81-94. doi: 10.3233/BPL-180074
|
| [21] |
Saha P, Sen N (2019) Tauopathy: A common mechanism for neurodegeneration and brain aging. Mech Ageing Dev 178: 72-79. doi: 10.1016/j.mad.2019.01.007
|
| [22] |
Hernandez F, Avila J (2007) Tauopathies. Cell Mol Life Sci 64: 2219-2233. doi: 10.1007/s00018-007-7220-x
|
| [23] |
Šimić G, Babić Leko M, Wray S, et al. (2016) Tau protein hyperphosphorylation and aggregation in Alzheimer's disease and other tauopathies, and possible neuroprotective strategies. Biomolecules 6: 6. doi: 10.3390/biom6010006
|
| [24] |
Vickers JC, Dickson TC, Adlard PA, et al. (2000) The cause of neuronal degeneration in Alzheimer's disease. Prog Neurobiol 60: 139-165. doi: 10.1016/S0301-0082(99)00023-4
|
| [25] |
Serrano-Pozo A, Frosch MP, Masliah E, et al. (2011) Neuropathological alterations in Alzheimer disease. Cold Spring Harb Perspect Med 1: a006189. doi: 10.1101/cshperspect.a006189
|
| [26] | Wenk GL (2003) Neuropathologic Changes in Alzheimer's Disease. J Clin Psychiatry 64: 7-10. |
| [27] |
Priller C, Bauer T, Mitteregger G, et al. (2006) Synapse formation and function is modulated by the amyloid precursor protein. J Neurosci 26: 7212-7221. doi: 10.1523/JNEUROSCI.1450-06.2006
|
| [28] |
Turner PR, O'connor K, Tate WP, et al. (2003) Roles of amyloid precursor protein and its fragments in regulating neural activity, plasticity and memory. Prog Neurobiol 70: 1-32. doi: 10.1016/S0301-0082(03)00089-3
|
| [29] |
Sastre M, Steiner H, Fuchs K, et al. (2001) Presenilin-dependent γ-secretase processing of β-amyloid precursor protein at a site corresponding to the S3 cleavage of Notch. EMBO Rep 2: 835-841. doi: 10.1093/embo-reports/kve180
|
| [30] |
Selkoe DJ (2002) Deciphering the genesis and fate of amyloid beta-protein yields novel therapies for Alzheimer disease. J Clin Invest 110: 1375-1381. doi: 10.1172/JCI0216783
|
| [31] | Dingledine R, Borges K, Bowie D, et al. (1999) The glutamate receptor ion channels. Pharmacol Rev 51: 7-62. |
| [32] |
Hu M, Liu QS, Chang KT, et al. (2002) Nicotinic regulation of CREB activation in hippocampal neurons by glutamatergic and nonglutamatergic pathways. Mol Cell Neurosci 21: 616-625. doi: 10.1006/mcne.2002.1202
|
| [33] |
Yakel JL (2013) Cholinergic receptors: functional role of nicotinic ACh receptors in brain circuits and disease. Pflügers Archi 465: 441-450. doi: 10.1007/s00424-012-1200-1
|
| [34] |
Hussain I, Powell D, Howlett DR, et al. (1999) Identification of a novel aspartic protease (Asp 2) as β-secretase. Mol Cell Neurosci 14: 419-427. doi: 10.1006/mcne.1999.0811
|
| [35] |
Seubert P, Oltersdorf T, Lee MG, et al. (1993) Secretion of β-amyloid precursor protein cleaved at the amino terminus of the β-amyloid peptide. Nature 361: 260-263. doi: 10.1038/361260a0
|
| [36] |
Hashimoto M, Rockenstein E, Crews L, et al. (2003) Role of protein aggregation in mitochondrial dysfunction and neurodegeneration in Alzheimer's and Parkinson's diseases. Neuromolecular Med 4: 21-36. doi: 10.1385/NMM:4:1-2:21
|
| [37] |
Peng C, Trojanowski JQ, Lee VM (2020) Protein transmission in neurodegenerative disease. Nat Rev Neurol 16: 199-212. doi: 10.1038/s41582-020-0333-7
|
| [38] |
Mattson MP, Guo ZH, Geiger JD (1999) Secreted form of amyloid precursor protein enhances basal glucose and glutamate transport and protects against oxidative impairment of glucose and glutamate transport in synaptosomes by a cyclic GMP-mediated mechanism. J Neurochem 73: 532-537. doi: 10.1046/j.1471-4159.1999.0730532.x
|
| [39] |
Snyder EM, Nong Y, Almeida CG, et al. (2005) Regulation of NMDA receptor trafficking by amyloid-β. Nat Neurosci 8: 1051-1058. doi: 10.1038/nn1503
|
| [40] |
Gu Z, Liu W, Yan Z (2009) β-Amyloid impairs AMPA receptor trafficking and function by reducing Ca2+/calmodulin-dependent protein kinase II synaptic distribution. J Biol Chem 284: 10639-10649. doi: 10.1074/jbc.M806508200
|
| [41] |
Tozaki H, Matsumoto A, Kanno T, et al. (2002) The inhibitory and facilitatory actions of amyloid-β peptides on nicotinic ACh receptors and AMPA receptors. Biochem Biophys Rese Communn 294: 42-45. doi: 10.1016/S0006-291X(02)00429-1
|
| [42] |
Liskowsky W, Schliebs R (2006) Muscarinic acetylcholine receptor inhibition in transgenic Alzheimer-like Tg2576 mice by scopolamine favours the amyloidogenic route of processing of amyloid precursor protein. Int J Dev Neurosci 24: 149-156. doi: 10.1016/j.ijdevneu.2005.11.010
|
| [43] |
Bojarski L, Herms J, Kuznicki J (2008) Calcium dysregulation in Alzheimer's disease. Neurochem Int 52: 621-633. doi: 10.1016/j.neuint.2007.10.002
|
| [44] |
Van der Kant R, Goldstein LS, Ossenkoppele R (2020) Amyloid-β-independent regulators of tau pathology in Alzheimer disease. Nat Rev Neurosci 21: 21-35. doi: 10.1038/s41583-019-0240-3
|
| [45] | Ramesh G, MacLean AG, Philipp MT (2013) Cytokines and chemokines at the crossroads of neuroinflammation, neurodegeneration, and neuropathic pain. Mediators Inflamm 2013: 480739. |
| [46] |
Alberghina L, Colangelo AM (2006) The modular systems biology approach to investigate the control of apoptosis in Alzheimer's disease neurodegeneration. BMC Neurosci 7: S2. doi: 10.1186/1471-2202-7-S1-S2
|
| [47] |
Gunn AP, Wong BX, Johanssen T, et al. (2016) Amyloid-β peptide Aβ3pE-42 induces lipid peroxidation, membrane permeabilization, and calcium influx in neurons. J Biol Chem 291: 6134-6145. doi: 10.1074/jbc.M115.655183
|
| [48] |
Gan X, Huang S, Wu L, et al. (2014) Inhibition of ERK-DLP1 signaling and mitochondrial division alleviates mitochondrial dysfunction in Alzheimer's disease cybrid cell. Biochim Biophys Acta 1842: 220-231. doi: 10.1016/j.bbadis.2013.11.009
|
| [49] |
Hooper C, Killick R, Lovestone S (2008) The GSK3 hypothesis of Alzheimer's disease. J Neurochem 104: 1433-1439. doi: 10.1111/j.1471-4159.2007.05194.x
|
| [50] |
Town T, Zolton J, Shaffner R, et al. (2002) p35/Cdk5 pathway mediates soluble amyloid-β peptide-induced tau phosphorylation in vitro. J Neurosci Res 69: 362-372. doi: 10.1002/jnr.10299
|
| [51] |
Das A, Dikshit M, Nath C (2005) Role of molecular isoforms of acetylcholinesterase in learning and memory functions. Pharmacol Biochem Behav 81: 89-99. doi: 10.1016/j.pbb.2005.02.006
|
| [52] |
Tiwari P, Dwivedi S, Singh MP, et al. (2013) Basic and modern concepts on cholinergic receptor: A review. Asian Pac J Trop Dis 3: 413-420. doi: 10.1016/S2222-1808(13)60094-8
|
| [53] | Leonard BE (2004) Pharmacotherapy in the treatment of Alzheimer's disease: an update. World Psychiatry 3: 84-88. |
| [54] |
Gutteridge JM, Halliwell B (2000) Free radicals and antioxidants in the year 2000: a historical look to the future. Ann N Y Acad Sci 899: 136-147. doi: 10.1111/j.1749-6632.2000.tb06182.x
|
| [55] |
Uttara B, Singh AV, Zamboni P, et al. (2009) Oxidative stress and neurodegenerative diseases: a review of upstream and downstream antioxidant therapeutic options. Curr Neuropharmacol 7: 65-74. doi: 10.2174/157015909787602823
|
| [56] |
Mancuso C, Scapagini G, Curro D, et al. (2007) Mitochondrial dysfunction, free radical generation and cellular stress response in neurodegenerative disorders. Front Biosci 12: 1107-1123. doi: 10.2741/2130
|
| [57] |
Beal MF (1998) Mitochondrial dysfunction in neurodegenerative diseases. Biochim Biophys Acta 1366: 211-223. doi: 10.1016/S0005-2728(98)00114-5
|
| [58] |
Fernie AR, Carrari F, Sweetlove LJ (2004) Respiratory metabolism: glycolysis, the TCA cycle and mitochondrial electron transport. Curr Opin Plant Biol 7: 254-261. doi: 10.1016/j.pbi.2004.03.007
|
| [59] |
Turrens JF (2003) Mitochondrial formation of reactive oxygen species. J Physiol 552: 335-344. doi: 10.1113/jphysiol.2003.049478
|
| [60] |
Halliwell B (1992) Reactive oxygen species and the central nervous system. J Neurochem 59: 1609-1623. doi: 10.1111/j.1471-4159.1992.tb10990.x
|
| [61] |
Reddy PH, Beal MF (2008) Amyloid beta, mitochondrial dysfunction and synaptic damage: implications for cognitive decline in aging and Alzheimer's disease. Trends Mol Med 14: 45-53. doi: 10.1016/j.molmed.2007.12.002
|
| [62] |
Reddy PH, Tripathi R, Troung Q, et al. (2012) Abnormal mitochondrial dynamics and synaptic degeneration as early events in Alzheimer's disease: implications to mitochondria-targeted antioxidant therapeutics. Biochim Biophys Acta 1822: 639-649. doi: 10.1016/j.bbadis.2011.10.011
|
| [63] |
Reddy PH, McWeeney S, Park BS, et al. (2004) Gene expression profiles of transcripts in amyloid precursor protein transgenic mice: up-regulation of mitochondrial metabolism and apoptotic genes is an early cellular change in Alzheimer's disease. Hum Mol Genet 13: 1225-1240. doi: 10.1093/hmg/ddh140
|
| [64] |
Tran M, Reddy PH (2021) Defective Autophagy and Mitophagy in Aging and Alzheimer's Disease. Front Neurosci 14: 612757. doi: 10.3389/fnins.2020.612757
|
| [65] |
Pradeepkiran JA, Reddy PH (2020) Defective mitophagy in Alzheimer's disease. Ageing Res Rev 64: 101191. doi: 10.1016/j.arr.2020.101191
|
| [66] |
Reddy PH (2011) Abnormal tau, mitochondrial dysfunction, impaired axonal transport of mitochondria, and synaptic deprivation in Alzheimer's disease. Brain Res 1415: 136-148. doi: 10.1016/j.brainres.2011.07.052
|
| [67] |
Garbarino VR, Orr ME, Rodriguez KA, et al. (2015) Mechanisms of oxidative stress resistance in the brain: lessons learned from hypoxia tolerant extremophilic vertebrates. Arch Biochem Biophys 576: 8-16. doi: 10.1016/j.abb.2015.01.029
|
| [68] |
Gerlach M, Ben-Shachar D, Riederer P, et al. (1994) Altered brain metabolism of iron as a cause of neurodegenerative diseases? J Neurochem 63: 793-807. doi: 10.1046/j.1471-4159.1994.63030793.x
|
| [69] |
Chance B, Sies H, Boveris A (1979) Hydroperoxide metabolism in mammalian organs. Physiol Rev 59: 527-605. doi: 10.1152/physrev.1979.59.3.527
|
| [70] |
Hirai K, Aliev G, Nunomura A, et al. (2001) Mitochondrial abnormalities in Alzheimer's disease. J Neurosci 21: 3017-3023. doi: 10.1523/JNEUROSCI.21-09-03017.2001
|
| [71] |
Tuppo EE, Arias HR (2005) The role of inflammation in Alzheimer's disease. Int J Biochem Cell Biol 37: 289-305. doi: 10.1016/j.biocel.2004.07.009
|
| [72] |
Chao CC, Hu S, Sheng WS, et al. (1996) Cytokine-stimulated astrocytes damage human neurons via a nitric oxide mechanism. Glia 16: 276-284. doi: 10.1002/(SICI)1098-1136(199603)16:3<276::AID-GLIA10>3.0.CO;2-X
|
| [73] |
Biber K, Vinet J, Boddeke HW (2008) Neuron-microglia signaling: chemokines as versatile messengers. J Neuroimmunol 198: 69-74. doi: 10.1016/j.jneuroim.2008.04.012
|
| [74] |
Perkins ND (2007) Integrating cell-signalling pathways with NF-κB and IKK function. Nat Rev Mol Cell Biol 8: 49-62. doi: 10.1038/nrm2083
|
| [75] |
O'Neill LA, Kaltschmidt C (1997) NF-kB: a crucial transcription factor for glial and neuronal cell function. Trends Neurosci 20: 252-258. doi: 10.1016/S0166-2236(96)01035-1
|
| [76] |
Friedlander RM (2003) Apoptosis and caspases in neurodegenerative diseases. N Engl J Med 348: 1365-1375. doi: 10.1056/NEJMra022366
|
| [77] |
Katsimpardi L, Lledo PM (2018) Regulation of neurogenesis in the adult and aging brain. Curr Opin Neurobiol 53: 131-138. doi: 10.1016/j.conb.2018.07.006
|
| [78] | Anjum I, Fayyaz M, Wajid A, et al. (2018) Does obesity increase the risk of dementia: a literature review. Cureus 10: e2660. |
| [79] |
Verdile G, Keane KN, Cruzat VF, et al. (2015) Inflammation and oxidative stress: the molecular connectivity between insulin resistance, obesity, and Alzheimer's disease. Mediators Inflamm 2015: 105828. doi: 10.1155/2015/105828
|
| [80] |
Nameni G, Farhangi MA, Hajiluian G, et al. (2017) Insulin deficiency: a possible link between obesity and cognitive function. Int J Dev Neurosci 59: 15-20. doi: 10.1016/j.ijdevneu.2017.02.008
|
| [81] |
Steen E, Terry BM, Rivera EJ, et al. (2005) Impaired insulin and insulin-like growth factor expression and signaling mechanisms in Alzheimer's disease—is this type 3 diabetes? J Alzheimers Dis 7: 63-80. doi: 10.3233/JAD-2005-7107
|
| [82] |
Craft S (2005) Insulin resistance syndrome and Alzheimer's disease: age-and obesity-related effects on memory, amyloid, and inflammation. Neurobiol Aging 26: 65-69. doi: 10.1016/j.neurobiolaging.2005.08.021
|
| [83] |
Dye L, Boyle NB, Champ C, et al. (2017) The relationship between obesity and cognitive health and decline. Proc Nutr Soc 76: 443-454. doi: 10.1017/S0029665117002014
|
| [84] |
Skoog I, Gustafson D (2003) Hypertension, hypertension-clustering factors and Alzheimer's disease. Neurol Res 25: 675-680. doi: 10.1179/016164103101201986
|
| [85] |
Luchsinger JA, Reitz C, Patel B, et al. (2007) Relation of diabetes to mild cognitive impairment. Arch Neurol 64: 570-575. doi: 10.1001/archneur.64.4.570
|
| [86] |
Luchsinger JA, Tang MX, Shea S, et al. (2004) Hyperinsulinemia and risk of Alzheimer disease. Neurology 63: 1187-1192. doi: 10.1212/01.WNL.0000140292.04932.87
|
| [87] |
Tiehuis AM, Van der Graaf Y, Visseren FL, et al. (2008) Diabetes increases atrophy and vascular lesions on brain MRI in patients with symptomatic arterial disease. Stroke 39: 1600-1603. doi: 10.1161/STROKEAHA.107.506089
|
| [88] |
Li ZG, Zhang W, Sima AA (2007) Alzheimer-like changes in rat models of spontaneous diabetes. Diabetes 56: 1817-1824. doi: 10.2337/db07-0171
|
| [89] |
Ho L, Qin W, Pompl PN, et al. (2004) Diet-induced insulin resistance promotes amyloidosis in a transgenic mouse model of Alzheimer's disease. FASEB J 18: 902-904. doi: 10.1096/fj.03-0978fje
|
| [90] |
Bennett RG, Hamel FG, Duckworth WC (2003) An insulin-degrading enzyme inhibitor decreases amylin degradation, increases amylin-induced cytotoxicity, and increases amyloid formation in insulinoma cell cultures. Diabetes 52: 2315-2320. doi: 10.2337/diabetes.52.9.2315
|
| [91] |
Shiiki T, Ohtsuki S, Kurihara A, et al. (2004) Brain insulin impairs amyloid-β (1–40) clearance from the brain. J Neurosci 24: 9632-9637. doi: 10.1523/JNEUROSCI.2236-04.2004
|
| [92] |
Lee HJ, Seo HI, Cha HY, et al. (2018) Diabetes and Alzheimer's disease: mechanisms and nutritional aspects. Clin Nutr Res 7: 229-240. doi: 10.7762/cnr.2018.7.4.229
|
| [93] |
Xi YD, Li XY, Ding J, et al. (2013) Soy isoflavone alleviates Aβ1-42-induced impairment of learning and memory ability through the regulation of RAGE/LRP-1 in neuronal and vascular tissue. Curr Neurovasc Res 10: 144-156. doi: 10.2174/1567202611310020007
|
| [94] |
Deane R, Wu Z, Sagare A, et al. (2004) LRP/amyloid β-peptide interaction mediates differential brain efflux of Aβ isoforms. Neuron 43: 333-344. doi: 10.1016/j.neuron.2004.07.017
|
| [95] |
Lloret A, Monllor P, Esteve D, et al. (2019) Obesity as a risk factor for Alzheimer's disease: implication of leptin and glutamate. Front Neurosci 13: 508. doi: 10.3389/fnins.2019.00508
|
| [96] |
Bird TD (2008) Genetic aspects of Alzheimer disease. Genet Med 10: 231-239. doi: 10.1097/GIM.0b013e31816b64dc
|
| [97] |
Kang J, Lemaire HG, Unterbeck A, et al. (1987) The precursor of Alzheimer's disease amyloid A4 protein resembles a cell-surface receptor. Nature 325: 733-736. doi: 10.1038/325733a0
|
| [98] |
Weidemann A, König G, Bunke D, et al. (1989) Identification, biogenesis, and localization of precursors of Alzheimer's disease A4 amyloid protein. Cell 57: 115-126. doi: 10.1016/0092-8674(89)90177-3
|
| [99] |
Scheuner D, Eckman C, Jensen M, et al. (1996) Secreted amyloid beta-protein similar to that in the senile plaques of Alzheimer's disease is increased in vivo by the presenilin 1 and 2 and APP mutations linked to familial Alzheimer's disease. Nat Med 2: 864-870. doi: 10.1038/nm0896-864
|
| [100] |
Sherrington R, Rogaev EI, Liang Y, et al. (1995) Cloning of a gene bearing missense mutations in early-onset familial Alzheimer's disease. Nature 375: 754-760. doi: 10.1038/375754a0
|
| [101] |
Theuns J, Del-Favero J, Dermaut B, et al. (2000) Genetic variability in the regulatory region of presenilin 1 associated with risk for Alzheimer's disease and variable expression. Hum Mol Genet 9: 325-331. doi: 10.1093/hmg/9.3.325
|
| [102] |
Citron M, Westaway D, Xia W, et al. (1997) Mutant presenilins of Alzheimer's disease increase production of 42-residue amyloid beta-protein in both transfected cells and transgenic mice. Nat Med 3: 67-72. doi: 10.1038/nm0197-67
|
| [103] |
Moehlmann T, Winkler E, Xia X, et al. (2002) Presenilin-1 mutations of leucine 166 equally affect the generation of the Notch and APP intracellular domains independent of their effect on Abeta 42 production. Proc Natl Acad Sci USA 99: 8025-8030. doi: 10.1073/pnas.112686799
|
| [104] |
Levy-Lahad E, Wasco W, Poorkaj P, et al. (1995) Candidate gene for the chromosome 1 familial Alzheimer's disease locus. Science 269: 973-977. doi: 10.1126/science.7638622
|
| [105] |
Sherrington R, Froelich S, Sorbi S, et al. (1996) Alzheimer's disease associated with mutations in presenilin 2 is rare and variably penetrant. Hum Mol Genet 5: 985-988. doi: 10.1093/hmg/5.7.985
|
| [106] |
Kovacs DM, Fausett HJ, Page KJ, et al. (1996) Alzheimer-associated presenilins 1 and 2: neuronal expression in brain and localization to intracellular membranes in mammalian cells. Nat Med 2: 224-229. doi: 10.1038/nm0296-224
|
| [107] |
Corder EH, Saunders AM, Strittmatter WJ, et al. (1993) Gene dose of apolipoprotein E type 4 allele and the risk of Alzheimer's disease in late onset families. Science 261: 921-923. doi: 10.1126/science.8346443
|
| [108] |
Nicoll JA, Roberts GW, Graham DI (1995) Apolipoprotein E epsilon 4 allele is associated with deposition of amyloid beta-protein following head injury. Nat Med 1: 135-137. doi: 10.1038/nm0295-135
|
| [109] |
Liu Y, Laakso MP, Karonen JO, et al. (2002) Apolipoprotein E polymorphism and acute ischemic stroke: a diffusion- and perfusion-weighted magnetic resonance imaging study. J Cereb Blood Flow Metab 22: 1336-1342. doi: 10.1097/01.WCB.0000033200.58646.B3
|
| [110] | Horsburgh K, McCulloch J, Nilsen M, et al. (2000) Increased neuronal damage and apoE immunoreactivity in human apolipoprotein E, E4 isoform-specific, transgenic mice after global cerebral ischaemia. Eur J Neurosci 12: 4309-4317. |
| [111] | Huang Y (2006) Molecular and cellular mechanisms of apolipoprotein E4 neurotoxicity and potential therapeutic strategies. Curr Opin Drug Discov Devel 9: 627-641. |
| [112] |
Mahley RW, Weisgraber KH, Huang Y (2006) Apolipoprotein E4: a causative factor and therapeutic target in neuropathology, including Alzheimer's disease. Proc Natl Acad Sci USA 103: 5644-5651. doi: 10.1073/pnas.0600549103
|
| [113] |
Nagy Z, Esiri MM, Jobst KA, et al. (1995) Influence of the apolipoprotein E genotype on amyloid deposition and neurofibrillary tangle formation in Alzheimer's disease. Neurosci 69: 757-761. doi: 10.1016/0306-4522(95)00331-C
|
| [114] |
Gibson GE, Haroutunian V, Zhang H, et al. (2000) Mitochondrial damage in Alzheimer's disease varies with apolipoprotein E genotype. Ann Neurol 48: 297-303. doi: 10.1002/1531-8249(200009)48:3<297::AID-ANA3>3.0.CO;2-Z
|
| [115] |
Yamanaka A, Sakurai T, Katsumoto T, et al. (1999) Chronic intracerebroventricular administration of orexin—A to rats increases food intake in daytime, but has no effect on body weight. Brain Res 849: 248-252. doi: 10.1016/S0006-8993(99)01905-8
|
| [116] |
Chow M, Cao M (2016) The hypocretin/orexin system in sleep disorders: preclinical insights and clinical progress. Nat Sci Sleep 8: 81-86. doi: 10.2147/NSS.S114969
|
| [117] |
Tsuneki H, Wada T, Sasaoka T (2012) Role of orexin in the central regulation of glucose and energy homeostasis. Endocr J 59: 365-374. doi: 10.1507/endocrj.EJ12-0030
|
| [118] |
Ben J, Soares FM, Cechetti F, et al. (2009) Exercise effects on activities of Na+, K+-ATPase, acetylcholinesterase and adenine nucleotides hydrolysis in ovariectomized rats. Brain Res 1302: 248-255. doi: 10.1016/j.brainres.2009.09.013
|
| [119] |
Feng P, Vurbic D, Wu Z, et al. (2008) Changes in brain orexin levels in a rat model of depression induced by neonatal administration of clomipramine. J Psychopharmacol 22: 784-791. doi: 10.1177/0269881106082899
|
| [120] |
Liguori C, Romigi A, Nuccetelli M, et al. (2014) Orexinergic system dysregulation, sleep impairment, and cognitive decline in Alzheimer disease. JAMA Neurol 71: 1498-1505. doi: 10.1001/jamaneurol.2014.2510
|
| [121] |
Osorio RS, Ducca EL, Wohlleber ME, et al. (2016) Orexin—A is associated with increases in cerebrospinal fluid phosphorylated-tau in cognitively normal elderly subjects. Sleep 39: 1253-1260. doi: 10.5665/sleep.5846
|
| [122] |
Slats D, AHR Claassen J, Jan Lammers G, et al. (2012) Association between hypocretin-1 and amyloid-β42 cerebrospinal fluid levels in Alzheimer's disease and healthy controls. Curr Alzheimer Res 9: 1119-1125. doi: 10.2174/156720512804142840
|
| [123] | Davies J, Chen J, Pink R, et al. (2015) Orexin receptors exert a neuroprotective effect in Alzheimer's disease (AD) via heterodimerization with GPR103. Sci Rep 5: 1-2. |
| [124] |
Jaussent I, Bouyer J, Ancelin ML, et al. (2012) Excessive sleepiness is predictive of cognitive decline in the elderly. Sleep 35: 1201-1207. doi: 10.5665/sleep.2070
|
| [125] |
Suh SW, Han JW, Lee JR, et al. (2018) Sleep and cognitive decline: a prospective nondemented elderly cohort study. Ann Neurol 83: 472-482. doi: 10.1002/ana.25166
|
| [126] | American Academy of Sleep Medicine (2014) International Classification of Sleep Disorders Illinois: Darien, 1-383. |
| [127] |
Sadeghmousavi S, Eskian M, Rahmani F, et al. (2020) The effect of insomnia on development of Alzheimer's disease. J Neuroinflammation 17: 289. doi: 10.1186/s12974-020-01960-9
|
| [128] |
Gehrman PR, Martin JL, Shochat T, et al. (2003) Sleep-disordered breathing and agitation in institutionalized adults with Alzheimer disease. Am J Geriatr Psychiatry 11: 426-433. doi: 10.1097/00019442-200307000-00005
|
| [129] |
Andrade AG, Bubu OM, Varga AW, et al. (2018) The Relationship between Obstructive Sleep Apnea and Alzheimer's Disease. J Alzheimers Dis 64: S255-S270. doi: 10.3233/JAD-179936
|
| [130] |
Pan W, Kastin AJ (2014) Can sleep apnea cause Alzheimer's disease? Neurosci Biobehav Rev 47: 656-669. doi: 10.1016/j.neubiorev.2014.10.019
|
| [131] | Weldemichael DA, Grossberg GT (2010) Circadian rhythm disturbances in patients with Alzheimer's disease: a review. Int J Alzheimers Dis 2010: 716453. |
| [132] |
Bhidayasiri R, Sringean J, Rattanachaisit W, et al. (2017) The sleeping brain in Parkinson's disease: A focus on REM sleep behaviour disorder and related parasomnias for practicing neurologists. J Neurol Sci 374: 32-37. doi: 10.1016/j.jns.2017.01.018
|
| [133] |
Panel CC, Watson NF, Badr MS, Belenky G, et al. (2015) Joint consensus statement of the American Academy of Sleep Medicine and Sleep Research Society on the recommended amount of sleep for a healthy adult: methodology and discussion. Sleep 38: 1161-1183. doi: 10.5665/sleep.4886
|
| [134] |
Matricciani L, Bin YS, Lallukka T, et al. (2017) Past, present, and future: trends in sleep duration and implications for public health. Sleep Health 3: 317-323. doi: 10.1016/j.sleh.2017.07.006
|
| [135] |
Lo JC, Groeger JA, Cheng GH, et al. (2016) Self-reported sleep duration and cognitive performance in older adults: a systematic review and meta-analysis. Sleep Med 17: 87-98. doi: 10.1016/j.sleep.2015.08.021
|
| [136] |
Peter-Derex L, Yammine P, Bastuji H, et al. (2015) Sleep and Alzheimer's disease. Sleep Med Rev 19: 29-38. doi: 10.1016/j.smrv.2014.03.007
|
| [137] |
Camargos EF, Louzada FM, Nóbrega OT (2013) Wrist actigraphy for measuring sleep in intervention studies with Alzheimer's disease patients: application, usefulness, and challenges. Sleep Med Rev 17: 475-488. doi: 10.1016/j.smrv.2013.01.006
|
| [138] |
Brzecka A, Leszek J, Ashraf GM, et al. (2018) Sleep disorders associated with Alzheimer's disease: a perspective. Front Neurosci 12: 330. doi: 10.3389/fnins.2018.00330
|
| [139] | Tsolaki A, Kazis D, Kompatsiaris I, et al. (2014) Electroencephalogram and Alzheimer's disease: clinical and research approaches. Int J Alzheimers Dis 2014: 349249. |
| [140] |
Wu YH, Feenstra MG, Zhou JN, et al. (2003) Molecular changes underlying reduced pineal melatonin levels in Alzheimer disease: alterations in preclinical and clinical stages. J Clin Endocrinol Metab 88: 5898-5906. doi: 10.1210/jc.2003-030833
|
| [141] |
Fossati S, Cam J, Meyerson J, et al. (2010) Differential activation of mitochondrial apoptotic pathways by vasculotropic amyloid-β variants in cells composing the cerebral vessel walls. FASEB J 24: 229-241. doi: 10.1096/fj.09-139584
|
| [142] |
Washington PM, Morffy N, Parsadanian M, et al. (2014) Experimental traumatic brain injury induces rapid aggregation and oligomerization of amyloid-beta in an Alzheimer's disease mouse model. J Neurotrauma 31: 125-134. doi: 10.1089/neu.2013.3017
|
| [143] |
Washington PM, Villapol S, Burns MP (2016) Polypathology and dementia after brain trauma: does brain injury trigger distinct neurodegenerative diseases, or should they be classified together as traumatic encephalopathy? Exp Neurol 275: 381-388. doi: 10.1016/j.expneurol.2015.06.015
|
| [144] |
Ramos-Cejudo J, Wisniewski T, Marmar C, et al. (2018) Traumatic brain injury and Alzheimer's disease: the cerebrovascular link. EBioMedicine 28: 21-30. doi: 10.1016/j.ebiom.2018.01.021
|
| [145] |
Elahi FM, Miller BL (2017) A clinicopathological approach to the diagnosis of dementia. Nat Rev Neurol 13: 457-476. doi: 10.1038/nrneurol.2017.96
|
| [146] |
Lim X, Yeo JM, Green A, et al. (2013) The diagnostic utility of cerebrospinal fluid alpha-synuclein analysis in dementia with Lewy bodies: a systematic review and meta-analysis. Parkinsonism Relat d 19: 851-858. doi: 10.1016/j.parkreldis.2013.06.008
|
| [147] |
Watson R, Colloby SJ, Blamire AM, et al. (2015) Assessment of regional gray matter loss in dementia with Lewy bodies: a surface-based MRI analysis. Am J Geriatr Psychiatry 23: 38-46. doi: 10.1016/j.jagp.2014.07.005
|
| [148] |
Chow N, Aarsland D, Honarpisheh H, et al. (2012) Comparing hippocampal atrophy in Alzheimer's dementia and dementia with Lewy bodies. Dement Geriatr Cogn Disord 34: 44-50. doi: 10.1159/000339727
|
| [149] |
Lebedev AV, Westman E, Beyer MK, et al. (2013) Multivariate classification of patients with Alzheimer's and dementia with Lewy bodies using high-dimensional cortical thickness measurements: an MRI surface-based morphometric study. J Neurol 260: 1104-1115. doi: 10.1007/s00415-012-6768-z
|
| [150] |
Watson R, O'Brien JT, Barber R, et al. (2012) Patterns of gray matter atrophy in dementia with Lewy bodies: a voxel-based morphometry study. Int Psychogeriatr 24: 532-540. doi: 10.1017/S1041610211002171
|
| [151] |
Whitwell JL, Weigand SD, Shiung MM, et al. (2007) Focal atrophy in dementia with Lewy bodies on MRI: a distinct pattern from Alzheimer's disease. Brain 130: 708-719. doi: 10.1093/brain/awl388
|
| [152] |
Watson R, Blamire AM, Colloby SJ, et al. (2012) Characterizing dementia with Lewy bodies by means of diffusion tensor imaging. Neurology 79: 906-914. doi: 10.1212/WNL.0b013e318266fc51
|
| [153] |
Galvin JE, Price JL, Yan Z, et al. (2011) Resting bold fMRI differentiates dementia with Lewy bodies vs Alzheimer disease. Neurology 76: 1797-1803. doi: 10.1212/WNL.0b013e31821ccc83
|
| [154] |
Johnson KA, Fox NC, Sperling RA, et al. (2012) Brain imaging in Alzheimer disease. Cold Spring Harb Perspect Med 2: a006213. doi: 10.1101/cshperspect.a006213
|
| [155] |
McKeith I, O'Brien J, Walker Z, et al. (2007) Sensitivity and specificity of dopamine transporter imaging with 123I-FP-CIT SPECT in dementia with Lewy bodies: a phase III, multicentre study. Lancet Neurol 6: 305-313. doi: 10.1016/S1474-4422(07)70057-1
|
| [156] |
Brigo F, Turri G, Tinazzi M (2015) 123I-FP-CIT SPECT in the differential diagnosis between dementia with Lewy bodies and other dementias. J Neurol Sci 359: 161-171. doi: 10.1016/j.jns.2015.11.004
|
| [157] |
Shimizu S, Hanyu H, Kanetaka H, et al. (2005) Differentiation of dementia with Lewy bodies from Alzheimer's disease using brain SPECT. Dement Geriatr Cogn Disord 20: 25-30. doi: 10.1159/000085070
|
| [158] |
Hanyu H, Shimizu S, Hirao K, et al. (2006) Comparative value of brain perfusion SPECT and [(123) I] MIBG myocardial scintigraphy in distinguishing between dementia with Lewy bodies and Alzheimer's disease. Eur J Nucl Med Mol Imaging 33: 248-253. doi: 10.1007/s00259-005-1921-x
|
| [159] |
Yoshita M, Arai H, Arai H, et al. (2015) Diagnostic accuracy of 123 I-meta-iodobenzylguanidine myocardial scintigraphy in dementia with Lewy bodies: a multicenter study. PloS One 10: e0120540. doi: 10.1371/journal.pone.0120540
|
| [160] |
Edison P, Rowe CC, Rinne JO, et al. (2008) Amyloid load in Parkinson's disease dementia and Lewy body dementia measured with [11C] PIB positron emission tomography. J Neurol Neurosurg Psychiatry 79: 1331-1338. doi: 10.1136/jnnp.2007.127878
|
| [161] |
Kantarci K, Lowe VJ, Boeve BF, et al. (2017) AV-1451 tau and β-amyloid positron emission tomography imaging in dementia with Lewy bodies. Ann Neurol 81: 58-67. doi: 10.1002/ana.24825
|
| [162] |
Coleman KK, Coleman BL, MacKinley JD, et al. (2016) Detection and differentiation of frontotemporal dementia and related disorders from alzheimer disease using the Montreal Cognitive Assessment. Alzheimer Dis Assoc Disord 30: 258-263. doi: 10.1097/WAD.0000000000000119
|
| [163] |
Kuhlmann J, Andreasson U, Pannee J, et al. (2017) CSF Aβ1–42—an excellent but complicated Alzheimer's biomarker—a route to standardisation. Clinica Chimica Acta 467: 27-33. doi: 10.1016/j.cca.2016.05.014
|
| [164] |
Lashley T, Schott JM, Weston P, et al. (2018) Molecular biomarkers of Alzheimer's disease: progress and prospects. Dis Models Mech 11: dmm031781. doi: 10.1242/dmm.031781
|
| [165] |
Morbelli S, Bauckneht M (2018) Amyloid PET imaging: standardization and integration with other Alzheimer's disease biomarkers. In Biomarkers for Alzheimer's Disease Drug Development New York, NY: Humana Press, 203-212. doi: 10.1007/978-1-4939-7704-8_13
|
| [166] |
Olsson B, Lautner R, Andreasson U, et al. (2016) CSF and blood biomarkers for the diagnosis of Alzheimer's disease: a systematic review and meta-analysis. Lancet Neurol 15: 673-684. doi: 10.1016/S1474-4422(16)00070-3
|
| [167] |
Guzman-Martinez L, Maccioni RB, Farías GA, et al. (2019) Biomarkers for Alzheimer's Disease. Curr Alzheimer Res 16: 518-528. doi: 10.2174/1567205016666190517121140
|
| [168] |
Gill SS, Rochon PA, Herrmann N, et al. (2005) Atypical antipsychotic drugs and risk of ischaemic stroke: population based retrospective cohort study. BMJ 330: 445. doi: 10.1136/bmj.38330.470486.8F
|
| [169] |
Giacobini E, Pepeu G (2006) Cholinesterases in human brain: the effect of cholinesterase inhibitors on Alzheimer's disease and related disorders. Brain Cholinergic Syst Health Dis 235-264. doi: 10.1201/b14486-19
|
| [170] |
Li WM, Pi RB, Chan HH, et al. (2005) Novel dimeric acetylcholinesterase inhibitor bis7-tacrine, but not donepezil, prevents glutamate-induced neuronal apoptosis by blocking N-methyl-D-aspartate receptors. J Biol Chem 280: 18179-18188. doi: 10.1074/jbc.M411085200
|
| [171] |
Hyde C, Peters J, Bond M, et al. (2013) Evolution of the evidence on the effectiveness and cost-effectiveness of acetylcholinesterase inhibitors and memantine for Alzheimer's disease: systematic review and economic model. Age Ageing 42: 14-20. doi: 10.1093/ageing/afs165
|
| [172] |
Lipton SA (2005) The molecular basis of memantine action in Alzheimer's disease and other neurologic disorders: low-affinity, uncompetitive antagonism. Curr Alzheimer Res 2: 155-165. doi: 10.2174/1567205053585846
|
| [173] |
Hynd MR, Scott HL, Dodd PR (2004) Glutamate-mediated excitotoxicity and neurodegeneration in Alzheimer's disease. Neurochem Int 45: 583-595. doi: 10.1016/j.neuint.2004.03.007
|
| [174] |
Liperoti R, Pedone C, Corsonello A (2008) Antipsychotics for the treatment of behavioral and psychological symptoms of dementia (BPSD). Curr Neuropharmacol 6: 117-124. doi: 10.2174/157015908784533860
|
| [175] |
Reynolds GP, Kirk SL (2010) Metabolic side effects of antipsychotic drug treatment—pharmacological mechanisms. Pharmacol Ther 125: 169-179. doi: 10.1016/j.pharmthera.2009.10.010
|
| [176] |
Vigen CL, Mack WJ, Keefe RS, et al. (2011) Cognitive effects of atypical antipsychotic medications in patients with Alzheimer's disease: outcomes from CATIE-AD. Am J Psychiatry 168: 831-839. doi: 10.1176/appi.ajp.2011.08121844
|
| [177] |
Ralph SJ, Espinet AJ (2018) Increased all-cause mortality by antipsychotic drugs: updated review and meta-analysis in dementia and general mental health care. J Alzheimers Dis Rep 2: 1-26. doi: 10.3233/ADR-170042
|
| [178] |
Doody RS, Raman R, Farlow M, et al. (2013) A phase 3 trial of semagacestat for treatment of Alzheimer's disease. N Engl J Med 369: 341-350. doi: 10.1056/NEJMoa1210951
|
| [179] |
Coric V, Salloway S, van Dyck CH, et al. (2015) Targeting prodromal Alzheimer disease with avagacestat: a randomized clinical trial. JAMA neurology 72: 1324-1333. doi: 10.1001/jamaneurol.2015.0607
|
| [180] |
Muntimadugu E, Dhommati R, Jain A, et al. (2016) Intranasal delivery of nanoparticle encapsulated tarenflurbil: A potential brain targeting strategy for Alzheimer's disease. Eur J Pharm Sci 92: 224-234. doi: 10.1016/j.ejps.2016.05.012
|
| [181] |
Das B, Yan R (2019) A Close Look at BACE1 Inhibitors for Alzheimer's Disease Treatment. CNS Drugs 33: 251-263. doi: 10.1007/s40263-019-00613-7
|
| [182] |
Egan MF, Kost J, Voss T, et al. (2019) Randomized trial of verubecestat for prodromal Alzheimer's disease. N Engl J Med 380: 1408-1420. doi: 10.1056/NEJMoa1812840
|
| [183] |
Burki T (2018) Alzheimer's disease research: the future of BACE inhibitors. Lancet 391: 2486. doi: 10.1016/S0140-6736(18)31425-9
|
| [184] |
Henley D, Raghavan N, Sperling R, et al. (2019) Preliminary results of a trial of atabecestat in preclinical Alzheimer's disease. N Engl J Med 380: 1483-1485. doi: 10.1056/NEJMc1813435
|
| [185] |
Wong KH, Riaz MK, Xie Y, et al. (2019) Review of current strategies for delivering Alzheimer's disease drugs across the blood-brain barrier. Int J Mol Sci 20: 381. doi: 10.3390/ijms20020381
|
| [186] |
Di Benedetto G, Burgaletto C, Carta AR, et al. (2019) Beneficial effects of curtailing immune susceptibility in an Alzheimer's disease model. J Neuroinflammation 16: 166. doi: 10.1186/s12974-019-1554-9
|
| [187] |
Quitterer U, AbdAlla SN (2020) Improvements of symptoms of Alzheimers disease by inhibition of the angiotensin system. Pharmacol Res 154: 104230. doi: 10.1016/j.phrs.2019.04.014
|
| [188] |
Blurton-Jones M, Kitazawa M, Martinez-Coria H, et al. (2009) Neural stem cells improve cognition via BDNF in a transgenic model of Alzheimer disease. Proc Natl Acad Sci USA 106: 13594-13599. doi: 10.1073/pnas.0901402106
|
| [189] |
Blurton-Jones M, Spencer B, Michael S, et al. (2014) Neural stem cells genetically-modified to express neprilysin reduce pathology in Alzheimer transgenic models. Stem Cell Res Ther 5: 46. doi: 10.1186/scrt440
|
| [190] |
Ager RR, Davis JL, Agazaryan A, et al. (2015) Human neural stem cells improve cognition and promote synaptic growth in two complementary transgenic models of Alzheimer's disease and neuronal loss. Hippocampus 25: 813-826. doi: 10.1002/hipo.22405
|
| [191] |
Martini AC, Forner S, Trujillo-Estrada L, et al. (2018) Past to future: what animal models have taught us about Alzheimer's disease. J Alzheimers Dis 64: S365-S378. doi: 10.3233/JAD-179917
|
| [192] |
Briggs R, Kennelly SP, O'Neill D (2016) Drug treatments in Alzheimer's disease. Clin Med 16: 247-253. doi: 10.7861/clinmedicine.16-3-247
|
| [193] | Cummings J, Lee G, Ritter A, et al. (2020) Alzheimer's disease drug development pipeline: 2020. Alzheimers Dement TRCI 6: e12050. |
| [194] | Bennett T, Bray D, Neville MW (2014) Suvorexant, a dual orexin receptor antagonist for the management of insomnia. Pharm Ther 39: 264-266. |
| [195] |
Equihua-Benítez AC, Guzmán-Vásquez K, Drucker-Colín R (2017) Understanding sleep-wake mechanisms and drug discovery. Expert Opin Drug Discov 12: 643-657. doi: 10.1080/17460441.2017.1329818
|
| [196] | Steiner MA, Winrow CJ (2014) Insomnia and beyond-Exploring the therapeutic potential of orexin receptor antagonists. Frontiers Research Topics E-book series Switzerland: Frontiers Media SA, 1-219. |
| [197] |
Pradeepkiran JA, Reddy PH (2019) Structure based design and molecular docking studies for phosphorylated tau inhibitors in Alzheimer's disease. Cells 8: 260. doi: 10.3390/cells8030260
|
| [198] | Rêgo ML, Cabral DA, Costa EC, et al. (2019) Physical exercise for individuals with hypertension: It is time to emphasize its benefits on the brain and cognition. Clin Med Insights Cardiol 13: 1179546819839411. |
| [199] |
Archer T, Josefsson T, Lindwall M (2014) Effects of physical exercise on depressive symptoms and biomarkers in depression. CNS Neurol Disord Drug Targets 13: 1640-1653. doi: 10.2174/1871527313666141130203245
|
| [200] |
Vina J, Sanchis-Gomar F, Martinez-Bello V, et al. (2012) Exercise acts as a drug; the pharmacological benefits of exercise. Br J Pharmacol 167: 1-12. doi: 10.1111/j.1476-5381.2012.01970.x
|
| [201] |
Daré LR, Garcia A, Neves BH, et al. (2020) One Physical Exercise Session Promotes Recognition Learning In Rats With Cognitive Deficits Related To Amyloid Beta Neurotoxicity. Brain Res 1744: 146918. doi: 10.1016/j.brainres.2020.146918
|
| [202] |
Carro E, Trejo JL, Busiguina S, et al. (2001) Circulating insulin-like growth factor I mediates the protective effects of physical exercise against brain insults of different etiology and anatomy. J Neurosci 21: 5678-5684. doi: 10.1523/JNEUROSCI.21-15-05678.2001
|
| [203] |
He XF, Liu DX, Zhang Q, et al. (2017) Voluntary exercise promotes glymphatic clearance of amyloid beta and reduces the activation of astrocytes and microglia in aged mice. Front Mol Neurosci 10: 144. doi: 10.3389/fnmol.2017.00144
|
| [204] | Baker LD, Frank LL, Foster-Schubert K, et al. (2010) Effects of aerobic exercise on mild cognitive impairment: a controlled trial. Arch Neurol 67: 71-79. |
| [205] |
Lange-Asschenfeldt C, Kojda G (2008) Alzheimer's disease, cerebrovascular dysfunction and the benefits of exercise: from vessels to neurons. Exp Gerontol 43: 499-504. doi: 10.1016/j.exger.2008.04.002
|
| [206] | Ziemann E, Zembroñ-Lacny A, Kasperska A, et al. (2013) Exercise training-induced changes in inflammatory mediators and heat shock proteins in young tennis players. J Sports Sci Med 12: 282-289. |
| [207] |
Bobinski F, Teixeira JM, Sluka KA, et al. (2018) IL-4 mediates the analgesia produced by low-intensity exercise in mice with neuropathic pain. Pain 159: 437-450. doi: 10.1097/j.pain.0000000000001109
|
| [208] |
Liu Y, Chu JM, Yan T, et al. (2020) Short-term resistance exercise inhibits neuroinflammation and attenuates neuropathological changes in 3xTg Alzheimer's disease mice. J Neuroinflammation 17: 4. doi: 10.1186/s12974-019-1653-7
|
| [209] |
Saucedo Marquez CM, Vanaudenaerde B, Troosters T, et al. (2015) High-intensity interval training evokes larger serum BDNF levels compared with intense continuous exercise. J Appl Physiol 119: 1363-1373. doi: 10.1152/japplphysiol.00126.2015
|
| [210] |
Pajonk FG, Wobrock T, Gruber O, et al. (2010) Hippocampal plasticity in response to exercise in schizophrenia. Arch Gen Psychiat 67: 133-143. doi: 10.1001/archgenpsychiatry.2009.193
|
| [211] |
Adlard PA, Perreau VM, Pop V, et al. (2005) Voluntary exercise decreases amyloid load in a transgenic model of Alzheimer's disease. J Neurosci 25: 4217-4221. doi: 10.1523/JNEUROSCI.0496-05.2005
|
| [212] |
Um HS, Kang EB, Koo JH, et al. (2011) Treadmill exercise represses neuronal cell death in an aged transgenic mouse model of Alzheimer's disease. Neurosci Res 69: 161-173. doi: 10.1016/j.neures.2010.10.004
|
| [213] |
Leem YH, Lim HJ, Shim SB, et al. (2009) Repression of tau hyperphosphorylation by chronic endurance exercise in aged transgenic mouse model of tauopathies. J Neurosci Res 87: 2561-2570. doi: 10.1002/jnr.22075
|
| [214] |
Belarbi K, Burnouf S, Fernandez-Gomez FJ, et al. (2011) Beneficial effects of exercise in a transgenic mouse model of Alzheimer's disease-like Tau pathology. Neurobiol Dis 43: 486-494. doi: 10.1016/j.nbd.2011.04.022
|
| [215] |
Alkadhi KA, Dao AT (2018) Exercise decreases BACE and APP levels in the hippocampus of a rat model of Alzheimer's disease. Mol Cell Neurosci 86: 25-29. doi: 10.1016/j.mcn.2017.11.008
|
| [216] |
Hashiguchi D, Campos HC, Wuo-Silva R, et al. (2020) Resistance Exercise Decreases Amyloid Load and Modulates Inflammatory Responses in the APP/PS1 Mouse Model for Alzheimer's Disease. J Alzheimers Dis 73: 1525-1539. doi: 10.3233/JAD-190729
|
| [217] |
Mankhong S, Kim S, Moon S, et al. (2020) Effects of Aerobic Exercise on Tau and Related Proteins in Rats with the Middle Cerebral Artery Occlusion. Int J Mol Sci 21: 5842. doi: 10.3390/ijms21165842
|
| [218] | Khazaeinia T, Ramsey AA, Tam YK (2020) The effects of exercise on the pharmacokinetics of drugs. J Pharm Pharm Sci 3: 292-302. |
| [219] |
Taylor D (2014) Physical activity is medicine for older adults. Postgrad Med J 90: 26-32. doi: 10.1136/postgradmedj-2012-131366
|
| [220] | World Health Organization WHO guidelines on physical activity and sedentary behaviour: at a glance (2020) .Available from: World Health Organization. https://apps.who.int/iris/handle/10665/337001. Licence: CC BY-NC-SA 3.0 IGO, 1–17. |
| [221] | Spirduso WW, Francis K, MacRae P (1995) Physical dimensions of aging USA Champaign Illinois: Human kinetics, 1-432. |
| [222] |
Van Praag H, Shubert T, Zhao C, et al. (2005) Exercise enhances learning and hippocampal neurogenesis in aged mice. J Neurosci 25: 8680-8685. doi: 10.1523/JNEUROSCI.1731-05.2005
|
| [223] |
Lledo PM, Alonso M, Grubb MS (2006) Adult neurogenesis and functional plasticity in neuronal circuits. Nat Rev Neurosci 7: 179-193. doi: 10.1038/nrn1867
|
| [224] |
Erickson KI, Voss MW, Prakash RS, et al. (2011) Exercise training increases size of hippocampus and improves memory. PNAS 108: 3017-3022. doi: 10.1073/pnas.1015950108
|
| [225] |
Erickson KI, Kramer AF (2009) Aerobic exercise effects on cognitive and neural plasticity in older adults. Br J Sports Med 43: 22-24. doi: 10.1136/bjsm.2008.052498
|
| [226] | Voss MW, Prakash RS, Erickson KI, et al. (2010) Plasticity of brain networks in a randomized intervention trial of exercise training in older adults. Front Aging Neurosci 2: 32. |
| [227] |
Langlois F, Vu TT, Chassé K, et al. (2013) Benefits of physical exercise training on cognition and quality of life in frail older adults. J Gerontol:Series B 68: 400-404. doi: 10.1093/geronb/gbs069
|
| [228] | Geda YE, Roberts RO, Knopman DS, et al. (2010) Physical exercise, aging, and mild cognitive impairment: a population-based study. Arch Neurol 67: 80-86. |
| [229] |
Nuzum H, Stickel A, Corona M, et al. (2020) Potential benefits of physical activity in MCI and dementia. Behav Neurol 2020: 7807856. doi: 10.1155/2020/7807856
|
| [230] |
Burns JM, Cronk BB, Anderson HS, et al. (2008) Cardiorespiratory fitness and brain atrophy in early Alzheimer disease. Neurology 71: 210-216. doi: 10.1212/01.wnl.0000317094.86209.cb
|
| [231] |
Chen WW, Zhang X, Huang WJ (2016) Role of physical exercise in Alzheimer's disease. Biomed Rep 4: 403-407. doi: 10.3892/br.2016.607
|
| [232] |
Teri L, Gibbons LE, McCurry SM, et al. (2003) Exercise plus behavioral management in patients with Alzheimer disease: a randomized controlled trial. JAMA 290: 2015-2022. doi: 10.1001/jama.290.15.2015
|
| [233] | Teri L, McCurry SM, Buchner DM, et al. (1998) Exercise and activity level in Alzheimer's disease: a potential treatment focus. J Rehabil Res Dev 35: 411-419. |
| [234] |
Palleschi L, Vetta F, De Gennaro E, et al. (1996) Effect of aerobic training on the cognitive performance of elderly patients with senile dementia of Alzheimer type. Arch Gerontol Geriatr 22: 47-50. doi: 10.1016/0167-4943(96)86912-3
|
| [235] |
George EK, Reddy PH (2019) Can healthy diets, regular exercise, and better lifestyle delay the progression of dementia in elderly individuals? J Alzheimers Dis 72: S37-S58. doi: 10.3233/JAD-190232
|
| [236] | Fitzgerald PB, Daskalakis ZJ (2013) Repetitive transcranial magnetic stimulation treatment for depressive disorders: a practical guide. Springer Science & Business Media, Germany: Springer-Verlag Berlin Heidelberg, 1-121. |
| [237] |
Weiler M, Stieger KC, Long JM, et al. (2020) Transcranial Magnetic Stimulation in Alzheimer's disease: are we ready? eNeuro 7. doi: 10.1523/ENEURO.0235-19.2019
|
| [238] | Abraham G, Milev R, Lazowski L, et al. (2007) Repetitive transcranial magnetic stimulation for treatment of elderly patients with depression—an open label trial. Neuropsychiatr Dis Treat 3: 919-924. |
| [239] |
Cotelli M, Manenti R, Cappa SF, et al. (2008) Transcranial magnetic stimulation improves naming in Alzheimer disease patients at different stages of cognitive decline. Eur J Neurol 15: 1286-1292. doi: 10.1111/j.1468-1331.2008.02202.x
|
| [240] |
Cotelli M, Calabria M, Manenti R, et al. (2011) Improved language performance in Alzheimer disease following brain stimulation. J Neurol Neurosurg Psychiatry 82: 794-797. doi: 10.1136/jnnp.2009.197848
|
| [241] |
Rutherford G, Lithgow B, Moussavi Z (2015) Short and long-term effects of rTMS treatment on Alzheimer's disease at different stages: a pilot study. J Exp Neurosci 9: 43-51. doi: 10.4137/JEN.S24004
|
| [242] |
Koch G, Bonnì S, Pellicciari MC, et al. (2018) Transcranial magnetic stimulation of the precuneus enhances memory and neural activity in prodromal Alzheimer's disease. Neuroimage 169: 302-311. doi: 10.1016/j.neuroimage.2017.12.048
|
| [243] |
Rabey JM, Dobronevsky E (2016) Repetitive transcranial magnetic stimulation (rTMS) combined with cognitive training is a safe and effective modality for the treatment of Alzheimer's disease: clinical experience. J Neural Transm 123: 1449-1455. doi: 10.1007/s00702-016-1606-6
|
| [244] |
Yang YW, Pan WX, Xie Q (2020) Combined effect of repetitive transcranial magnetic stimulation and physical exercise on cortical plasticity. Neural Regen Res 15: 1986-1994. doi: 10.4103/1673-5374.282239
|
| [245] |
Ross RE, VanDerwerker CJ, Newton JH, et al. (2018) Simultaneous aerobic exercise and rTMS: Feasibility of combining therapeutic modalities to treat depression. Brain Stimul 11: 245-246. doi: 10.1016/j.brs.2017.10.019
|
| [246] |
Reed T, Kadosh RC (2018) Transcranial electrical stimulation (tES) mechanisms and its effects on cortical excitability and connectivity. J Inherit Metab Dis 41: 1123-1130. doi: 10.1007/s10545-018-0181-4
|
| [247] |
Zarifkar AH, Zarifkar A, Nami M, et al. (2018) The Comparison of the Effects of Different Transcranial Electrical Stimulation (tES) Paradigms on Beta-Amyloid (Aβ 25–35)-Induced Memory Impairment upon Morris Water Maze Task in Male Rats. J Neurol Neurosci 9: 265. doi: 10.21767/2171-6625.1000265
|
| [248] |
Steinberg F, Pixa NH, Fregni F (2019) A review of acute aerobic exercise and transcranial direct current stimulation effects on cognitive functions and their potential synergies. Front Hum Neurosci 12: 534. doi: 10.3389/fnhum.2018.00534
|
Figures(5) / Tables(1)

Kiran Kumar Siddappaji, Shubha Gopal. Molecular mechanisms in Alzheimer's disease and the impact of physical exercise with advancements in therapeutic approaches[J]. AIMS Neuroscience, 2021, 8(3): 357-389. doi: 10.3934/Neuroscience.2021020


 DownLoad: