We present a method by which to convert a large corpus of website traffic data into interactive and practical taste graph visualizations. The website traffic data lists individual visitors' level of interest in specific pages across the website; it is a tripartite list consisting of anonymized visitor ID, webpage ID, and a score that quantifies interest level. Taste graph visualizations reveal psychological profiles by revealing connections between consumer tastes; for example, an individual with a taste for A may be also have a taste for B. We describe here the method by which we map the web traffic data into a form that can be displayed as interactive taste graphs, and we describe design strategies for communicating the revealed information. In the context of the publishing industry, this interactive visualization is a tool that renders the large corpus of website traffic data into a form that is actionable for marketers and advertising professionals. It could equally be used as a method to personalize services in the domains of government services, education or health and wellness.
Citation: Ana Jofre, Lan-Xi Dong, Ha Phuong Vu, Steve Szigeti, Sara Diamond. 2017: Rendering website traffic data into interactive taste graph visualizations, Big Data and Information Analytics, 2(2): 107-118. doi: 10.3934/bdia.2017003
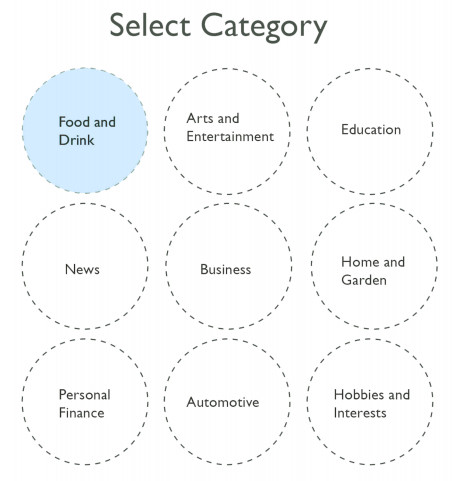
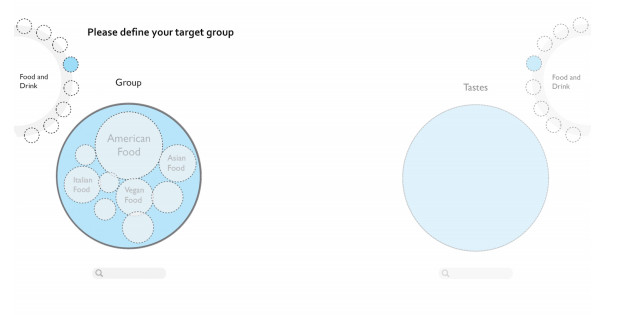
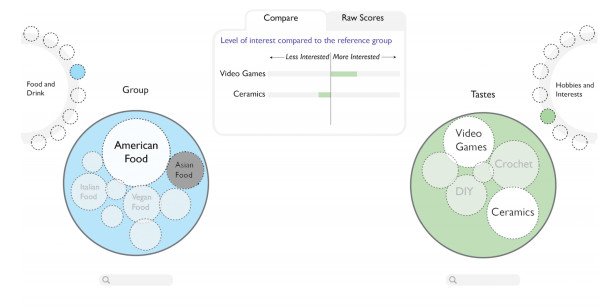
We present a method by which to convert a large corpus of website traffic data into interactive and practical taste graph visualizations. The website traffic data lists individual visitors' level of interest in specific pages across the website; it is a tripartite list consisting of anonymized visitor ID, webpage ID, and a score that quantifies interest level. Taste graph visualizations reveal psychological profiles by revealing connections between consumer tastes; for example, an individual with a taste for A may be also have a taste for B. We describe here the method by which we map the web traffic data into a form that can be displayed as interactive taste graphs, and we describe design strategies for communicating the revealed information. In the context of the publishing industry, this interactive visualization is a tool that renders the large corpus of website traffic data into a form that is actionable for marketers and advertising professionals. It could equally be used as a method to personalize services in the domains of government services, education or health and wellness.

| [1] | A. Cairo, The Functional Art: An Introduction to Information Graphics and Visualization New Riders, Berkeley, CA, 2013. |
| [2] | M. Bostock, D3. js -Data-Driven Documents Available from: https://d3js.org/. |
| [3] | L. Kozlowski, Gravity can graph your internet clicks for new customer snapshots, http://www.forbes.com/sites/lorikozlowski/2013/11/13/brand-graphs-a-new-snapshot-of-consumers/#7adbf713a2d1, forbes. com 11. 13. 2013. Web 6. 1. 2016. |
| [4] |
Krumpal I. (2013) Determinants of social desirability bias in sensitive surveys: A literature review. Qual. Quant. 47: 2025-2047. 
|
| [5] | V. Kumar, Building a Taste Graph: The basic principles, http://bigdata-madesimple.com/category/tech-and-tools/analytics/, bigdata-madesimple. com 12. 23. 2014. Web 6. 1. 2016. |
| [6] | S. Pearman, Delicious interest graphs: Taco bell and whole foods, http://www.gravity.com/blog/delicious-interest-graphs-taco-bell-and-whole-foods/, Gravity. com 8. 12. 2013. Web 6. 1. 2016. |
| [7] | S. Pearman, What Your Electric Car Says About You, http://www.gravity.com/blog/what-your-electric-car-says-about-you/, Gravity. com 7. 31. 2013. Web 6. 15. 2016. |
| [8] |
Shneiderman B. (1996) The eyes have it: A task by data type taxonomy for information visualizations. IEEE Symposium on Visual Languages Proceedings : 336-343.
|
| [9] | A. Taylor, Snow Fight: Skiing versus Snowboarding, http://www.gravity.com/blog/snow-fight-skiing-versus-snowboarding/, Gravity. com 2. 17. 2015. Web 6. 1. 2016. |
| [10] | E. R. Tufte, The Visual Display of Quantitative Information 2nd edition, Graphics Press, Cheshire, Conn., 2001. |
| [11] | C. Ware, Information Visualization: Perception for Design Elsevier, Waltham, MA, 2013. |
| [12] |
N. Yau,
Visualize This John Wiley & Sons, Indianapolis, Indiana, 2011.
10.1002/9781118722213 |
| [13] |
Yu J., Cooper H. (1983) A quantitative review of research design effects on response rates to questionnaires. J. Mark. Res. 20: 36-44.
|
| [14] |
T. Zhou, J. Ren, M. Medo and Y. -C. Zhang, Bipartite network projection and personal recommendation Phys. Rev. E 76 (2007), 046115.
10.1103/PhysRevE.76.046115 |


Figures(8)

Ana Jofre, Lan-Xi Dong, Ha Phuong Vu, Steve Szigeti, Sara Diamond. 2017: Rendering website traffic data into interactive taste graph visualizations, Big Data and Information Analytics, 2(2): 107-118. doi: 10.3934/bdia.2017003


 DownLoad: