Review

Circular economy in Singapore: waste management, food and agriculture, energy, and transportation

  • Received: 29 January 2024 Revised: 16 April 2024 Accepted: 22 April 2024 Published: 10 May 2024
  • Singapore, as a small but advanced urban economy, has achieved a high-quality living environment and has become an example of a high-density and sustainable city. To maintain that status, Singapore has set a goal of achieving net zero carbon emissions by mid-century and reducing waste sent to landfills by 30% by 2030. To achieve this goal, the Government has laid out a comprehensive plan for implementing a circular economy model across all economic sectors. It includes a set of measures tailored to its unique city-state conditions that will necessarily require the joint effort of authorities, industry, companies, academia, and citizens. This article reviewed and analyzed the strategies and policies that Singapore has devised to implement such a model in four sectors identified as the highest priority by the Association of Southeast Asian Nations Economic Community: waste management, food and agriculture, energy, and transportation. The analysis aimed to provide information to close the gap between aspirations and reality by identifying factors that allow progress toward planned objectives, as well as externalities and barriers that act in the opposite direction. For this endeavor, a gap analysis was carried out to look into the interconnections between the natural environment, regulatory framework and policies, governance, infrastructure, technology and innovation, and societal habits. In general, the institutional framework necessary for the transition into a resilient and resource-efficient nation is already in place, while enforcement and monitoring mechanisms to assess progress are under construction. Singapore has learned how to develop policies that are flexible and can adapt to technological, economic, and social changes, as well as threats posed by climate change, and unexpected challenges. Still, success will be determined by Singaporeans' ability to change their work-life balance paradigm for their own sake and happiness.

    Citation: Erik Velasco. Circular economy in Singapore: waste management, food and agriculture, energy, and transportation[J]. Urban Resilience and Sustainability, 2024, 2(2): 110-150. doi: 10.3934/urs.2024007

    Related Papers:

    [1] Laines Canepa José Ramón, Sosa Olivier José Aurelio, Padilla-Rivera Alejandro, Hernández Barajas José Roberto, Morales-Rodríguez Neil Ebeth Meled, Burelo Ramos Carlos Manuel, Espinosa de los Monteros Alejandra Elvira, Núñez-Nogueira Gabriel . Transformation of plastic debris to microplastics: An approximate analysis of mangrove environments. Urban Resilience and Sustainability, 2024, 2(4): 348-364. doi: 10.3934/urs.2024018
    [2] Fasil Kebede Tesfaye, Ayitenew Mogninet Getaneh, Mequanint Birhan . The management of sustainable energy sources in the mechanical sector. Urban Resilience and Sustainability, 2023, 1(2): 138-145. doi: 10.3934/urs.2023010
    [3] Tatyana P. Kalikhman . The economic situation and ways to solve the environmental problems in the city of Ust-Kut. Urban Resilience and Sustainability, 2024, 2(2): 203-214. doi: 10.3934/urs.2024010
    [4] Fairuz Amanina, Zul Ilham . Placemaking strategies in greening Universiti Malaya Main Library. Urban Resilience and Sustainability, 2024, 2(1): 76-92. doi: 10.3934/urs.2024005
    [5] Prakeerth Anam, B. Madhusudhana Rao, SS. Asadi . Computer-based analysis for design and schedule management for commercial buildings. Urban Resilience and Sustainability, 2023, 1(1): 37-47. doi: 10.3934/urs.2023003
    [6] Cheikh Cisse . At the crossroads of datas: Using artificial intelligence for efficient and resilient planning in African cities. Urban Resilience and Sustainability, 2023, 1(4): 309-313. doi: 10.3934/urs.2023019
    [7] Francis Deng, Armin Mehdipour, Ali Soltani . Construction quality control of concrete structures in architectural engineering—A case in Shanghai, China. Urban Resilience and Sustainability, 2024, 2(3): 256-271. doi: 10.3934/urs.2024013
    [8] Marcello Magoni, Rachele Radaelli . The Climate Transition Strategy of the city of Brescia (Italy). Urban Resilience and Sustainability, 2023, 1(3): 163-187. doi: 10.3934/urs.2023012
    [9] Lilis Sri Mulyawati, Luky Adrianto, Kadarwan Soewardi, Handoko Adi Susanto, Suryo Kusumo, Fery Kurniawan . Assessing sustainability of coastal tourism based special economic zone (SEZ) in Indonesia: The case of Tanjung Lesung Coastal Area, Banten Province, Indonesia. Urban Resilience and Sustainability, 2023, 1(2): 107-117. doi: 10.3934/urs.2023008
    [10] Aibin Yan, Dinghan Zheng . Restoration and integration of the Huang Family Garden within the contemporary urban fabric of Shanghai. Urban Resilience and Sustainability, 2024, 2(1): 27-44. doi: 10.3934/urs.2024003
  • Singapore, as a small but advanced urban economy, has achieved a high-quality living environment and has become an example of a high-density and sustainable city. To maintain that status, Singapore has set a goal of achieving net zero carbon emissions by mid-century and reducing waste sent to landfills by 30% by 2030. To achieve this goal, the Government has laid out a comprehensive plan for implementing a circular economy model across all economic sectors. It includes a set of measures tailored to its unique city-state conditions that will necessarily require the joint effort of authorities, industry, companies, academia, and citizens. This article reviewed and analyzed the strategies and policies that Singapore has devised to implement such a model in four sectors identified as the highest priority by the Association of Southeast Asian Nations Economic Community: waste management, food and agriculture, energy, and transportation. The analysis aimed to provide information to close the gap between aspirations and reality by identifying factors that allow progress toward planned objectives, as well as externalities and barriers that act in the opposite direction. For this endeavor, a gap analysis was carried out to look into the interconnections between the natural environment, regulatory framework and policies, governance, infrastructure, technology and innovation, and societal habits. In general, the institutional framework necessary for the transition into a resilient and resource-efficient nation is already in place, while enforcement and monitoring mechanisms to assess progress are under construction. Singapore has learned how to develop policies that are flexible and can adapt to technological, economic, and social changes, as well as threats posed by climate change, and unexpected challenges. Still, success will be determined by Singaporeans' ability to change their work-life balance paradigm for their own sake and happiness.


    The city-state of Singapore is widely recognized for its environmental achievements and often cited as a model of a high-density, livable, and sustainable city. Through a unique strategy based on integrated urban and industrial planning, strict enforcement programs, pragmatic and cost-effective policies, and a flexible approach to changes in technology have allowed Singapore to achieve a dynamic economy and a high-quality living environment. Since its inception as an independent nation, Singapore understood the importance of solving environmental problems for the physical and mental well-being of its population, as well as being a key strategy for convincing foreign investors that it is a well-planned and sustainable city [1].

    Despite increased urbanization and industrialization, Singapore has been able to simultaneously achieve a clean environment, social inclusion, and economic progress. Nevertheless, Singapore recognizes the need to replace the current linear economic model of "take-make-dispose" by a circular one, in which reducing consumption and production of resources is a priority. This new model focuses on designing waste out of the resource ecosystem and maximizing the value of resources by keeping them in use for as long as possible. Singapore has already embraced the circular economy approach in some sectors, achieving success in closing a number of resource loops. For instance, Singapore is able to endlessly recycle water, reusing it again and again. Every drop of used water is collected and treated, turning much of it into drinking water again [2].

    In such a context, the circular economy approach has become part of Singapore's national agenda. The steps to follow are outlined in the Zero Waste Masterplan and the Singapore Green Plan (SGP) 2030 [3,4]. The former blueprint highlights the need of new policies to adopt a circular economy model of waste and resource management practices, and to shift towards more sustainable production and consumption, with the aim of building a sustainable, resource-efficient, and climate-resilient nation [3]. The latter charts bold and concrete sectoral initiatives and targets to support efforts to attain net-zero carbon emissions, and implement the 2030 Agenda for Sustainable Development and the Paris Agreement [4].

    The SGP 2030 and Zero Waste Masterplan draw the path to develop a sustainable and circular economy tailored to Singapore's unique geographic, economic, and social conditions [3,4]. Both blueprints propose a new way of doing business, producing goods, and providing services considering the well-being of the entire society. They consider the threats and constraints imposed by a changing climate and limited natural resources. They recognize the need of developing new capabilities to produce more with less, as well as of changing the citizens' mindsets and behaviors to reduce consumption, enhance recycling and reuse, and take care for the environment, aiming to build a sustainable society.

    The government understands that in order to achieve a sustainable economy, the joint participation of citizens, industry, companies, academia, and authorities is required. That is why the public sector is taking the lead under GreenGov.SG, a sustainability movement launched to support the SGP 2030 [4,5]. Under this initiative, the public sector will strive to attain ambitious sustainability targets in carbon abatement and resource efficiency, and be a positive influence and enabler of green efforts.

    Singapore aspires to achieve net zero carbon emissions by mid-century, becoming a pioneer in technological and policy solutions for sustainable development, and playing a crucial role as a clean-tech hub and testbed for new green technologies.

    In many aspects, Singapore is a living laboratory, whose experiences could be valuable to other cities, especially those in Southeast Asia and the tropics, throughout the world. Hence, Singapore recognizes the importance of working creatively to have a positive impact at home and beyond its shores. Singapore must develop innovative economic, social welfare, governance, and environmental strategies in collaboration with the entire Association of Southeast Asian Nations (ASEAN) Economic Community (AEC) to build a resilient region against the threats of climate change, environmental pollution, biodiversity loss, critical resource constraints, and current and future economic challenges. The positive outcomes of the SGP 2030 and Zero Waste Masterplan will depend on Singapore's ability to extend its successful story of sustainable development and cooperation with its neighbors to achieve a regional circular economy.

    This article reviews the strategies and policies that Singapore has implemented to become a zero-waste and net zero carbon emissions nation based on a model of circular economy tailored to its unique conditions as a city-state. It also examines the progress made so far and the challenges encountered along the way. The review aims to provide insight into how Singapore's institutional framework has contributed the country's transformation into a resilient and resource-efficient nation seeking sustainable and inclusive economic growth. The article focuses on four sectors identified as the highest priority to accelerate environmental sustainability in the ASEAN region: waste management, food and agriculture, energy, and transportation [6]. Water, manufacturing, construction, financial markets, digital technology, and others are also relevant sectors and should be examined in future work.

    The article begins with a brief overview of Singapore's economy and urbanization. The institutional organization and legal framework that Singapore has developed to achieve its environmental sustainability goals are then presented. The main core of the article is the analysis of the strategies and policies that Singapore has implemented to achieve a circular economy in the aforementioned priority sectors. The purpose of this article is to provide insight into how Singapore can bridge the gap between aspirations and reality. The regulatory policy framework, operational principles, enabling institutions, and citizen habits are all examined in order to identify the economic, political, and social factors that may hinder, or even nullify, the initiatives and mechanisms that allow for a smooth transition toward continuous sustainable development. The information examined is expected to provide insight for other cities, especially those in the tropics, contribute to the development of best practices and strategies, and foster international collaboration and partnerships to achieve a sustainable world based on a circular economy.

    As of 2023, Singapore's total population was almost 5.92 million, of which 4.15 million (70% of the total population) were citizens and permanent residents with a median age of 42 years [7]. Singapore's 734 km2 of land area means a population density of 8062 people per km2. Singapore has transformed from a developing nation to a developed one in less than 60 years since gaining independence in 1965, due to smart, bold, and timely economic, industrial, and social policies, as well as promoting innovation and advances in technology [8]. Its per capita gross domestic product (GDP) increased from $428 in 1960 to $82,807 in 2022 (US dollars) [9].

    This economic growth together with a dynamic governance have enabled Singapore to build a modern city, making the best use of its limited land space following an integrated master planning system [10]. This system embodies the key principles to make Singapore a livable and resilient city while maintaining a competitive economy, building a sustainable environment, and ensuring a high quality of life for its citizens. As a city-state, Singapore must provide not only for housing, business, social, and recreational needs, but also for activities that are typically located outside a city, for instance, seaports and airports, water catchment areas, and utilities such as waste treatment plants and power stations. Singapore has considered all land-use demands comprehensively, and through a continuous land reclamation process has expanded its land by 25% since independence, while its built-up area has increased by a factor of four reaching over 420 km2, primarily at the expense of forest and farm areas.

    From its earliest days as an independent nation, Singapore has prioritized the construction of high-rise public housing to meet demands of a population that has tripled its size since then. Today, around 65% of the population lives in high-rise public housing developments like the ones shown in Figure S1, down from a high of 88% in 2000 [7]. In 2020, the Housing and Development Board (HDB) introduced the 10-year plan Green Towns Program to make HDB states more sustainable and livable. The program focuses on reducing energy consumption by harnessing solar energy to power common services (e.g., lifts, lights, and water pumps) and installing smart LED lighting in common areas. The program also proposes to recycle rainwater for the washing of common areas and watering plants, mitigating the risk of flooding, as well as intensify greenery and apply cool coatings on building facades, roofs, and pavement to reduce urban warming and improve thermal comfort for residents [11]. The goal is to reduce energy consumption in HDB towns by 15% from 2020's levels by 2030.

    Some of the general industrial areas (e.g., electronics, manufacturing, etc.) are located within residential estates, but most of the heavy industries (e.g., oil refining, petrochemical, steelworks, etc.) are concentrated in a large industrial estate in the western part of the island that includes several reclaimed offshore islands. The commercial and business center is located in the southern part of Singapore and primarily consists of shopping malls, hotels, and entertainment complexes. The central business district, which houses the financial center and includes numerous tall skyscrapers, is located in the center of the southern part.

    Nine percent of Singapore's land has been set aside for parks and natural reserves [12]. Over 25% of the urban landscape is covered by vegetation and over 80% of the road network is covered by green canopy [13,14]. Singapore's moniker "City in a Garden" stems from the fact that greenery covers around half of its land area.

    Singapore has implemented strong regulations to manage environmental pollution based on a Long-Term Plan using a pragmatic and cost-effective approach that considers environmental, economic, and social factors [12]. The Long-Term Plan guides Singapore's development over the next 40–50 years. It ensures that there is sufficient land available to meet the needs of long-term population and economic growth, balanced with a good quality of life and a sense of well-being for everyone, while maintaining a clean and green environment (Figure 1). This plan is reviewed every 10–15 years to ensure that it remains relevant in meeting the needs and aspirations of current and future generations, taking into account evolving trends and the ever-changing global environment. It is translated to medium-term strategies through a Master Plan that is reviewed every five years. At the time of writing, the Urban Redevelopment Authority (URA) was inviting the public to take part in conversations to draft a new Master Plan for 2025 that would consider four major themes: Shaping a Happy Healthy City, Enabling Sustainable Growth, Strengthening Urban Resilience, and Stewarding Our Nature and Heritage.

    Figure 1.  Singapore's Development Concept Plan based on a Long-Term Plan that is reviewed every 10–15 years and translated to medium-term strategies through a Master Plan that is reviewed every five years. The Concept Plan takes into account strategic land use, transportation, the environment, and economic and social aspects. Source: Singapore City Gallery (https://www.ura.gov.sg/).

    The Ministry of Sustainability and the Environment (MSE), previously named the Ministry of the Environment and Water Resources (MEWR), has the task of ensuring a clean and sustainable environment, with resilient supplies of safe food and water. It formulates, reviews, and implements strategic policies to address key concerns on Singapore's environment. The Ministry works alongside three statutory boards: the National Environment Agency (NEA), the National Water Agency (PUB), and the Food Agency (SFA). NEA implements MSE's policies and develops and leads programs to improve and sustain a clean environment, promotes sustainability and resource efficiency, maintains high public health standards, provides timely and reliable meteorological information, and encourages a vibrant hawker culture. PUB is the national water agency, which manages Singapore's water supply, water catchment, and used water in an integrated way. From April 2020, PUB also took on the responsibility of protecting Singapore's coastline from sea-level rise. SFA oversees food safety and security, bringing together all functions related to food provision and resilience.

    The environmental agenda of Singapore has evolved from addressing issues such as pollution control, sewerage, drainage, and environmental health in the 1970s, to developing strategies to achieve sustainability and become a net zero carbon emissions nation, with major initiatives in carbon mitigation, coastal protection, zero waste, and a circular economy, as well as food and water security.

    Since independence, Singapore has pursued quality, inclusive, and sustainable growth. The Singapore Green Plan issued in 1992 was the country's first formal plan to balance environmental and development needs. It outlined the policy directions Singapore would take to become a model green city by 2000 [15]. New environmental concerns on the city-island, such as transboundary air pollution and climate change, were included in a second plan launched in 2002 [16]. An extensive review was conducted in 2005, releasing a revised version in 2006, targeting the policy route for the next six years. The SGP 2012 moved towards attaining environmental sustainability from just being clean and green [17]. In 2009, it was replaced by the Sustainable Singapore Blueprint (SSB), a new framework to guide Singapore's sustainable development efforts up to 2030 [18]. It set higher targets than those in the SGP 2012 with the vision of making Singapore a livable and lively city by boosting resource efficiency, enhancing urban environments, building capabilities, and fostering community action. A review of the SSB was carried out in 2014, culminating in the release of the SSB 2015 [12]. The SSB 2015 outlined a national vision with new and bold plans to create a more livable and sustainable future for Singaporeans, which were aligned with international initiatives promoted by organizations such as the World Health Organization (WHO) and Intergovernmental Panel on Climate Change (IPCCC).

    Singapore's legislation includes the regulatory framework required to implement the policies outlined in those documents. In 1999, parliament passed the Environmental Pollution Control Act [19]. This act consolidated previous laws relating to air, water, and noise pollution control into a single act with the aim of providing a stronger legislative framework for the overall control of the environmental pollution from any industrial or trade premises. This act was revised in December 2002 to specify emission standards and testing methods. It was renamed as the Environmental Protection and Management Act (EPMA), and after 29 amendments, its regulations are still in place.

    On the global stage, Singapore has adopted the United Nations' 2030 Agenda for Sustainable Development and its 17 Sustainable Development Goals, as well as the Paris Agreement to address climate change [20,21]. Singapore has pledged to reduce its emission intensity by 36% below 2005 levels by 2030, stabilize its carbon emissions at 65 Mt CO2 eq, and halve its emissions from its peak to 33 Mt CO2 eq by 2050, with a view to achieving net zero carbon emissions as soon as viable in the second half of the century [22].

    Moving towards a vision of a zero-waste nation, the inaugural Zero Waste Masterplan, launched in 2019, maps out Singapore's strategies to embrace a circular economy approach to waste and resource management practices, and shifting toward more sustainable production and consumption [3]. While waste-to-energy (WTE) incineration technology allows for up to a 90% reduction in waste volume, Singapore's only landfill, Semakau Landfill, will run out of space by 2035 at current waste disposal rates. In land-scarce Singapore, there is a pressing need to transition toward a circular economy in which resources are recovered from waste. This will reduce the carbon footprint of incineration and extend the lifespan of the Semakau Landfill. To catalyze this transition, the government introduced the landmark Resource Sustainability Act (RSA) to impose regulatory measures to address priority waste streams of electrical and electronic waste (e-waste), food waste, and packaging waste including plastics [23].

    In February 2021, still in the midst of the COVID-19 pandemic, the government launched the Singapore Green Plan 2030 to chart the country's way toward a more sustainable future seeking a faster economic recovery, bringing new business and job opportunities in the context of a greener development. This new plan will continue to strengthen Singapore's efforts in areas such as building a green city, investing in green energy, developing a green economy and green jobs, adapting to sea-level rise, improving food resilience, and enabling a green citizenry that consumes and wastes less [4]. The SGP 2030 is a multi-agency effort spearheaded by four ministries in addition to the MSE, including the Ministry of Education, Ministry of Trade and Industry, Ministry of Transport, and Ministry of National Development.

    It is important to point out that the government recognizes that, in addition to a robust legal framework and institutional structure, it is necessary to support the advancement of applied science in close partnership with industry and academia in order to find solutions toward the outlined circular economy model. That is why the MSE is committed to investing in research and development, and developing science and technology capabilities to address the complex challenges posed by climate change, environmental sustainability, water, and food security. Figure 2 shows a chart of the programs and policies that Singapore is currently implementing to achieve a circular economy for the four sectors discussed in this article. The logos of the institutions involved in their application are also included. Readers will find in the Supplementary Material (SM) a table listing the blueprints and documents that describe such programs and policies, as well as a second table listing the laws and regulations enacted for that purpose. Photographs of Singapore’s infrastructure and lifestyle are also included in the SM to make the content easier to assimilate for both non-specialist and non-Singaporean readers.

    Figure 2.  Singapore's institutional framework to achieve a circular economy in the sectors of waste management, food and agriculture, energy, and transportation. The programs and policies implemented for such an endeavor are included, as well as the logos of the institutions in charge of their application.

    The following sections discuss Singapore's policies, plans, and actions to build a circular economy. These sections focus on four sectors identified as priorities to accelerate sustainability in the ASEAN region: waste management, food and agriculture, energy, and transportation. The discussion is based on a gap analysis of the strategies implemented to become a resilient and resource-efficient nation seeking sustainable and inclusive economic growth. The objective is to identify the factors and institutional actions that have enabled the transition toward a circular economy, as well as the externalities and barriers that have acted in the opposite direction.

    The article examines the regulatory and institutional framework, operating principles, enabling institutions, and citizen habits in order to identify areas of opportunity for closing the gap between aspirations and reality. It looks into the convergence, consistency, and coordination of authorities and society, national policies, and local actions. The stakeholders' engagement with the community and communication mechanisms are also examined, as are the transparency, commitment, and cooperation between both parties. Attention is also paid to regional and international commitments, as well as cooperation support.

    The aim is to provide a general assessment of the economic and social drivers, circumstances and innovations, and institutional feasibility of implementing a circular economy model in Singapore considering its unique circumstances as an island city-state. By no means is the article seeking to rate the actions and progress on the matter. The author recognizes that there are no quantitative indicators to assess the effectiveness of policies and actions to reconcile economic growth with environmental concerns. As a result, the purpose of this article is only to provide scientific and technical insight to guide the actions that public and private sectors can take to help achieve a circular economy.

    All blueprints, programs, policies, and initiatives prepared and implemented by Singapore's government agencies involved in building a circular economy model in the four selected sectors, as well as laws enacted by parliament in this regard, were thoroughly reviewed and analyzed. No official document accessible to the public was excluded. News and opinions about government strategies in the mainstream media were also reviewed. To support the discussion on the needs and challenges to implement such a model, selected peer-reviewed literature on the topic was used. Only relevant references were included to highlight key gaps and challenges to address with future research. The material presented here was complemented with observations and comments from representatives assigned by the Ministry of Sustainability and the Environment, and the Singapore Food Agency. The draft was also shared with the other government agencies involved, but they did not respond.

    A narrative structure is used to introduce and discuss the strategies designed and implemented to achieve a circular economy, which closely follows the five-information-level framework proposed by Iacovidou et al. [24]. This is a framework based on five interconnected components that must be considered to support transitions to circular economy, namely, natural environment and provisioning services; governance, regulatory framework, and political landscape; technology, infrastructure, and innovation; business activities and the market; and human patterns and societal needs. This holistic approach simplifies systemic complexity by examining the relationships between processes, values, and actors in the value chain, and their dependence on cultural, spatial, and temporal characteristics.

    Singapore has an efficient waste management collection system that protects public health, and the amount of waste that ends up littering the environment is low. General waste is collected daily, and recyclable items three times per week by public or private waste collectors. Citizens are responsible for disposing of general and recycling waste in separate bins. To reduce the volume of waste that goes to the only active landfill, as much as feasible is incinerated. Through incineration, waste volume is reduced up to 90% and excess heat from waste-to-energy incineration plants provides about 2% of Singapore's electricity supply. However, it is not sufficient to pursue a circular economy model as stated in the Zero Waste Masterplan [3].

    Current policies are based on reducing and recycling waste as much as possible. Although they have been effective in reducing overall waste generation, they must be adjusted to speed up the process. Singapore has set ambitious targets to increase overall recycling rates to 70% and reduce daily waste-to-landfill per capita by 30% by 2030 in order to extend Semakau Landfill's lifespan beyond 2035 [3]. Under the SGP 2030, this goal will be prioritized to achieve a 20% reduction in waste-to-landfill per capita by 2026. In 2022, 7.39 million tonnes of solid waste were generated, with the domestic and non-domestic sectors accounting for 25% and 75%, respectively [25]. Total waste amounted to 7.81 million tonnes in 2016, and consistently decreased until 2022, when it increased 6% over the previous year.

    To achieve the targets mentioned above, the waste increase in 2022 must be reversed and the decreasing trend observed in previous years accelerated in concert with circularity-promoting initiatives to close as many resource loops as possible. Since 2016, overall recycling rates of 55–60% have been achieved by focusing on individual waste streams. As seen in Figure 3, construction and demolition waste as well as ferrous and nonferrous metals are nearly all recycled. However, the recycling of plastic, textiles, and leather has not exceeded 10% [25]. The recycling rate of paper and cardboard has decreased in recent years, reaching 37% in 2022. Similarly, recycling rates of waste food and glass also show no significant progress. In 2022, they did not reach 20%.

    Figure 3.  Recycling rates by type of waste reported by the National Environmental Agency [25]. The figures on the right indicate the amount of generated waste in 2022 in thousands of tonnes. The category of Others includes stones, ceramics, and other materials.

    Singapore has decided on an integrated waste management system to sort recyclable material at waste-to-energy facilities. Residents of public high-rise apartments and private landed housing estates have easy access to commingled recycling bins for paper, plastic, metal, and glass waste (Figure S2). Although these bins specify which items can and cannot be recycled, approximately 40% of the items deposited are not suitable for recycling [26]. In the end, around 87% of Singapore's domestic waste is incinerated, with the resulting ash and other non-incinerable waste ending up at Semakau Landfill. Singapore is a party to the Basel Convention on the Control of Transboundary Movement of Hazardous Wastes and their Disposal, hence exporting incineration ash is not possible [27]. As a result, stronger legislation and improved recycling standards are required to transition to a circular economy. Improved waste management in households and commercial facilities can promote a domestic market for recycled materials.

    Authorities and organizations are implementing campaigns to reduce the demand for single-use items and recycle used plastic, but it is unclear how effective these initiatives will be in the long run. From 2021, firms are required to report the amount of material used to pack their products, and submit plans to reduce, reuse, and recycle (3R) packing waste [25]. Companies that supply regulated goods, such as manufacturers and importers of packaged products, as well as retailers such as supermarkets, are required to report data on the packaging that they introduce into Singapore on an annual basis under the Mandatory Packaging Reporting (MPR) scheme. To begin, the MPR requirements apply to companies with an annual revenue of more than SG$7.25 million. The MPR lays the foundation for an Extended Producer Responsibility (EPR) framework for managing packaging waste.

    Singapore has imposed a minimum charge of five cents per disposable carrier bag at larger supermarkets since 2023 to reduce their use. Similarly, as the first phase of the EPR framework for packaging waste, a Beverage Container Return scheme will be implemented in the following years.

    A new Integrated Waste Management Facility (Tuas Nexus IWMF) is being built. When completed in 2025, it is expected to meet Singapore's long-term solid waste management needs [28]. It will be able to incinerate 5,800 tonnes of incinerable waste per day, sort 250 tonnes of household recyclables per day using automated equipment, and treat and co-digest 400 tonnes of food waste with 800 tonnes per day of dewatered sludge from a nearby water reclamation plant (WRP). The co-location of two facilities, the IWMF and WRP, will optimize land use and improve energy and resource recovery from solid waste and used water.

    Plastic waste is most likely Singapore's most difficult waste management challenge. Polyethylene terephthalate (PET) bottles, Styrofoam containers, and plastic bags are the most common sources of plastic waste, accounting for roughly one-third of all domestic waste [29]. A survey found that each resident uses 3–4 disposable plastic items per day, adding up to about 1.8 billion nationally each year [30]. There is a lack of awareness about what can be recycled, highlighting the importance of campaigns to educate on the importance of reducing single-use items. Creative campaigns that encourage the public to reduce the use of disposables, cultivate good recycling practices, and guide them on what can and cannot be recycled are welcome (e.g., "Say YES to Waste Less" and "Recycle Right", https://www.cgs.gov.sg/).

    New regulations should focus on reducing plastic use and requiring plastic packaging and products to be redesigned so that they retain their value and are more recyclable in local and regional markets. Bans on certain types of plastics and products made from composite materials (composed of more than one type of material that is not physically separable) should also be considered.

    It does not appear feasible that Singapore will be able to stop its massive use of plastic in the near future, even by implementing best recycling practices, and thus will need to find a solution to manage plastic waste disposal. For example, the COVID-19 pandemic increased Singaporeans' reliance on food delivery services, leading to an increase in plastic waste. Before the pandemic, more than half of Singaporeans admitted to ordering food delivery at least once a week. According to food delivery companies and online surveys, there was a 70–80% increase during the two-month COVID-19 lockdown, resulting in an additional 1334 tonnes of disposable plastic waste [31,32,33]. These surveys also found that people today are more willing to use food delivery and take-out services. Therefore, it is critical to develop strategies to encourage customers to reduce single-use plastic packaging by using and bringing their own food containers.

    Based on the available technology, it is necessary to determine whether incineration is the best solution when all environmental and social costs associated with waste management are considered [34]. The cost of improving management operations, developing efficient domestic and regional recycling industries, and designing safe disposal methods must be considered when determining the best strategies to mitigate environmental and social impacts, as well as public health risks associated with an economy based on cheap plastic. Investments must be calculated and evaluated in light of the evident and hidden costs of continuing to use plastic in an indiscriminate manner in the present and future. Policymakers must keep in mind that over 4000 chemical compounds found in plastics are hazardous, some of these compounds are known to leach into food, water, and the environment, posing risks to human and ecosystem health [35]. In light of this, Singapore could explore policies that tax plastic consumption, as well as taxes based on product sales to cover the costs of disposal or recycling. An accurate estimate of the domestic cost of using plastic would assist authorities in determining the benefit of enacting taxation schemes.

    Textile waste also represents a major challenge. According to the NEA, Singapore generated over 254,000 tonnes of textile waste in 2022, with only 2% being recycled (down from 4% in 2021). Used textiles go to incinerators, in part because there are relatively few facilities for people to recycle. Indeed, recycling textiles, from fiber to fiber, can only happen with 100% cotton and in large volumes. Synthetic materials and mixed materials are harder to recycle. Textile recycling requires the manual separation of fibers, as well as buttons and zips. Different fibers are not easy to identify by eye, and overall, such manual processes are time-consuming and not a profitable business [36]. However, social enterprises and clothing-swap movements have emerged in recent years, contributing to the solution by collecting fashion textiles and apparels for reuse, upcycling, and recycling (e.g., Cloop, https://cloop.sg/; SG Recycle, https://www.sgrecycle.com/; and The Fashion Pulpit, https://www.thefashionpulpit.com/). Recycling bins can be found in community centers and wet markets where people can drop off their unwanted clothes (Figure S3). The success of these initiatives will depend on whether they can be scaled up and on people's behavior. It is important to encourage people to buy less, choose well, and make their clothes last, challenging the trend of fast fashion (i.e., cheap, trendy clothing that samples ideas from the catwalk and turns them into garments at breakneck speed to meet consumer demand).

    Every week, each household discards 2.5 kg of avoidable food waste [3]. Over the last decade, the amount of food waste generated has increased by about 20%. Food waste accounted for 44% of total domestic waste disposed of in 2022, but only 18% of food waste was recycled [25]. To reduce food waste, consumers must practice smart food purchasing, storage, and preparation habits. The NEA guidebooks for reducing food waste in retail food establishments, supermarkets, and food manufacturing establishments, as well as consumer guidelines, are promising steps to avoid food waste from the start [37,38,39,40]. Similarly, pilot projects to test the feasibility of using on-site systems to treat food waste at hawker centers and markets, as well as the partnership of authorities and the private sector to segregate food waste in large commercial and industrial buildings have yielded positive results [41]. Premises that generate large amounts of food waste, such as hotels, malls, supermarkets, food manufacturers, food caterers, schools, and hospitals, will gradually be required to segregate their food waste for treatment over the course of 2024 and 2025.

    Singapore imports more than 90% of its food from about 180 countries [42]. Table 1 lists the major sources of supply for the most commonly consumed food items, as well as the associated per capita consumption and import volumes. An environmental impact study that took into account where Singapore's food comes from and a per capita consumption of 367 kg (46% fruits and vegetables, 25% grains, 29% meats, eggs, and seafood) without accounting for sugar and cooking oil, but accounting for food waste, determined an associated carbon footprint in terms of a carbon dioxide equivalent (CO2 eq) of 954 kg per capita in 2018 [43]. This figure is consistent with the 5.39 Gg CO2 eq at the country level (i.e., 960 kg CO2 eq per capita) estimated based on the food-miles concept, which considers the distance traveled by food products from the points of production to the points of consumption [44]. In both cases, the carbon footprint associated with food consumption is equivalent to about 10% of the total greenhouse gas (GHG) emissions reported in the official emissions inventory on a per capita basis (9.8 tons CO2 eq) [45]. However, when considering the carbon emissions associated with the production of all goods consumed by an average dweller, no matter if the emissions occurred outside Singapore, the carbon footprint associated with food consumption is equivalent to about 3.5% of the carbon footprint of every person, 27.7 tons CO2 eq [46].

    Table 1.  Per capita consumption, import volumes, and three major sources of supply for Singapore's most commonly consumed food items.
    Food item Per capita consumption
    (kg per year) [47]
    Import volume
    (Thousand tonnes per year)
    Top 3 suppliers
    Fruits [42] 72 433 Malaysia, China, South Africa
    Leafy vegetables [47] 16 80 China, Malaysia, Singapore
    Other vegetables [47] 82 479 Australia, China, Malaysia
    Chicken [42] 36 214 Brazil, Malaysia, USA
    Duck [47] 2 12 Ireland, Malaysia, Thailand
    Pork [42] 22 128 Brazil, Indonesia, Australia
    Mutton [42] 2 15 Australia, New Zealand, Ireland
    Beef [42] 4 39 Brazil, Australia, USA
    Hen shell eggs [42] 388 pieces 2138-million pieces Malaysia, Singapore, Poland
    Fish [47] 16 100 Malaysia, Indonesia, Vietnam
    Other seafood [47] 6 34 China, Indonesia, Malaysia
    Rice [48] 45 347 India, Thailand, Vietnam
    Wheat [49] 46 253 Japan, Malaysia, Sri Lanka
    Sugar [50] 57 314 Australia, Malaysia, Thailand
    Cooking oil [49] 5 262 Australia, Indonesia, Malaysia

     | Show Table
    DownLoad: CSV

    The results of that study accounted for GHG emissions from production, processing, and transportation stages, but not from retail distribution and consumption stages [43]. Emissions from all material and resource inputs, waste, food loss, and by-products were taken into account. Thus, it was found that food production and processing were responsible for more than 80% of GHG emissions. Red meats (pork, mutton, and beef) had the greatest environmental impact. Despite accounting for about 7% of the annual food consumption by weight, they contributed 40% of GHG emissions. This is due to the fact that they are mostly transported by air. Therefore, frozen meat should take precedence over chilled meat. However, if chilled or fresh meat is preferred, it must come from a country close to Singapore. In contrast, fruits and vegetables accounted for 46% of the annual food consumption and contributed less than 11% of GHG emissions. The study also found that adopting an optimal health diet of 50% fruits and vegetables, 25% grains, and 25% meats, eggs, and seafood could reduce GHG emissions per capita by around 16%.

    To reduce GHG emissions from transportation, the vast majority of food should be sourced within the ASEAN Economic Community, and produced locally as much as possible. Food should be transported by land or sea and come from sources with sustainable production and processing chains. Singapore could take advantage of its status as a major commercial hub for ASEAN by acting as a regional distributor of regional food items.

    The SGP 2030 aims to meet 30% of Singapore's nutritional needs through local production by 2030 in order to ensure a more resilient food supply [4]. This will necessitate increasing the capability and capacity of the local agri-food industry. However, only local production of fish, shrimp, hen eggs, and leafy vegetables can be realistically scaled up. About one percent of Singapore's land area is available for farming purposes. Urban farming is an option, but meeting such an ambitious target will be difficult, not to mention the large carbon footprint it entails. Depending on the crop and site, urban farming can emit up to six times as much carbon as conventional agriculture [51]. Fish, bivalves, and shrimp production, on the other hand, may have greater potential through an improved aquaculture industry [52], and their consumption would help reduce the country's carbon footprint. Replacing meat with some types of sustainably sourced seafood can help reduce carbon emissions without compromising nutrition. Farmed bivalves and shellfish, such as mussels and clams, and small surface-dwelling (pelagic) fish, which include anchovies and mackerel, generate less GHG emissions and are more nutrient dense than beef, pork, and chicken [53].

    During the last two years, the government has set aside over US$120 million to encourage research and development in sustainable urban food production. Some initial testbed projects have included commercial rooftop farming and placing farms in underutilized spaces. The Food Agency has supported innovative projects such as the Sky Green's 9-meter-tall system that allows vegetables to grow vertically outdoors (https://www.skygreens.com/), as well as Sustenir Agriculture's indoor controlled environment agriculture farm that enables control of all aspects of the environment to optimize crop growth (https://sustenir.com/). The SFA's website "From SG to SG" showcases other examples of local farms that are tapping into technology and employing sustainable practices to increase production and improve product quality (https://www.sfa.gov.sg/fromSGtoSG/).

    Initiatives to optimize land space for agriculture includes the master planning of a high-tech agri-food zone in the district of Lim Chu Kang, which is already occupied by farms. The objective is to raise the production in a sustainable and resource-efficient manner in existing plots by developing infrastructure to support productive farming, and establishing shared facilities such as waste treatment plants or packing facilities to achieve economies of scale (https://www.ourfoodfuture.gov.sg/). The Food Agency is also studying the expansion of sustainable fish farming in the deeper southern waters to boost local fish production. There are also plans to unlock the potential of sea-based fish farming through more productive, sustainable, and climate-resilient management methods and practices [54].

    Another significant initiative is the Sungei Kadut Eco-Agri-Food District's Innovation Park. By bringing together high-tech urban farming in both agriculture and aquaculture, as well as associated research and development activities, this industrial park will serve as a pilot cluster to spur innovation in the agri-food tech ecosystem (https://estates.jtc.gov.sg/sked/).

    The National Parks Board (NParks) is inviting enthusiastic citizens to grow their own edible vegetables in small plots set up in parks as part of the SGP 2030. At the time of writing, over 2400 allotment plots were available in 28 parks across the island (Figure S4). According to the Edible Horticulture Masterplan, there are plans to include allotment gardens in residential states, as well [55]. The initiative has received a positive response, is a fun and rewarding activity, and helps to embed the concept of a circular economy within the community. However, the food production from these community gardens is limited and does not count towards official production figures and targets.

    Shifting consumer preferences in favor of a more sustainable diet based on food items of local and regional origin will help to build a circular model while also boosting regional economies and avoiding carbon emissions associated with transportation. Origin of production labelling paired with nutritional information could be an effective strategy for empowering consumers with information to choose a healthy and environmentally friendly option [56]. Singapore already has labelling schemes for healthy packed foods and locally produced fresh foods (Figure 4), which could be modified to include food products from the ASEAN region that are produced in a sustainable and resource-efficient manner.

    Figure 4.  Labelling schemes for healthy packed foods and locally produced fresh foods (Healthier Choice Symbol and SG Fresh Produce, Singapore Food Agency).

    Companies are encouraged to produce healthy food products and become eligible for the Healthier Choice Symbol, which is a voluntary labelling scheme that allows them to inform about the healthy ingredients in their products and reach more consumers. Today, this label has been granted to about 4000 different food products [57]. Similarly, the SG Fresh Produce badges are granted to locally produced fresh products such as fish, eggs, leafy vegetables, mushrooms, and more (https://www.sfa.gov.sg/fromSGtoSG). There are three tiers to these badges. The 1-star badge is granted to locally grown fresh produce from SFA-licensed farms. The 2-star badge applies to fresh produce from local farms certified to the Good Agriculture Practice (GAP) standard. While the 3-star badge is for local produce that is not only fresh and high-quality, but also clean and green certified. It means that the produce is grown in GAP-certified local farms that additionally employ sustainable and resource-efficient practices, with minimal waste generation. The government could form alliances with retailers, encouraging them to prioritize locally or regionally produced food on their shelves, and even offer discounts and promotions through subsidies and tax breaks.

    Singapore's successful transformation into a developed nation has been supported by an energy policy framework that is flexible enough to deal with the ever-evolving global energy landscape [58]. This framework has evolved from viewing energy as a commodity required for economic growth to the need to ensure supply security, which has resulted in the diversification of fuel sources and suppliers, and, more recently, as a matter of national security due to the threats posed by climate change.

    Carbon dioxide is the most significant GHG emitted in Singapore, primarily due to the burning of fossil fuels such as oil and natural gas to meet energy demands in industry, buildings, households, and transportation. Given Singapore's limited potential for alternative energy sources such as solar and wind power, improving energy efficiency has been the primary strategy to reduce carbon emissions in all sectors of the economy. In the face of an expanding economy and a growing population, Singapore's efforts are focused on using energy more efficiently rather than increasing energy production.

    The National Climate Change Secretariat (NCCS, https://www.nccs.gov.sg/) coordinates the Inter-Ministerial Committee on Climate Change, and spearheads the actions to promote energy efficiency through legislation, incentives, and public education with support of the NEA, EMA, Building Construction Authority (BCA), and Land Transport Authority (LTA).

    The main mechanisms used to improve energy efficiency are pricing, energy conservation, efficiency in energy production, diversification of fuel supplies, and the development of alternative energy sources.

    The energy price is determined by market forces to ensure that it is used efficiently, and electricity and gas tariffs are reviewed on a regular basis to ensure that they reflect total costs. Energy conservation is achieved through infrastructure and distribution system improvements, the development of energy-optimized industrial clusters, financial incentives, energy efficiency regulations for buildings, households, and industries, and support for clean transportation technologies. Energy efficiency is achieved through market competition in the generation and sale of electricity. Diversification of energy supplies has been achieved by allowing new energy alternatives to enter the market, developing renewable energy sources, investing in energy research and development, and increasing natural gas imports from countries other than Malaysia and Indonesia through the construction of liquefied natural gas (LNG) facilities. Singapore aims to become a major LNG trading hub by promoting cooperation and integration throughout the ASEAN region.

    These policies have been effective in reducing energy intensity, which implies improved energy efficiency. However, as shown in Figure 5, they have not reduced net carbon emissions or moderated energy consumption. Energy consumption has increased about 14-folds over the last 50 years, although its growth has slowed since 2005. Energy intensity has decreased by about a third since then, while CO2 emissions have remained relatively constant. Energy intensity has declined as a result of decreased reliance on fossil fuels as a percentage of the GDP, the introduction of cleaner technologies, a relative decline in manufacturing's share of the GDP relative to that of less energy-intensive services as income rises, and conservation practices. However, the biggest improvement came when oil was replaced by natural gas for electricity generation two decades ago. Natural gas, which has lower carbon content per unit of electricity generated, now accounts for more than 95% of Singapore's fuel mix for electricity generation [59].

    Figure 5.  Singapore's historical energy consumption and intensity, and the associated CO2 emissions. (a) Total energy consumption by source in mega-tonnes of oil equivalent (Mtoe). (b) GDP (billion SG$), energy intensity (Mtoe/million SG$), energy efficiency index, and energy consumption relative to 2005. The GDP is at market prices of 2021 as reported by the Department of Statistics Singapore (https://www.singstat.gov.sg/). (c) CO2 emissions from fuel combustion. (d) Electricity generation by type of source. (e) Oil and oil products consumption by type of fuel. Energy and CO2 emissions data were obtained from the International Energy Agency (IEA) World Energy Balances 2019 (https://www.iea.org). The energy intensity was computed as the amount of energy consumed in Mtoe per million SG$ of GDP. The energy efficiency index includes energy used for electricity generation as calculated by Su et al. [60].

    Although all economic sectors have had some success in improving energy efficiency and conservation, the changes have not been homogeneous. Through a decomposition analysis, Su et al. found that industries have improved energy efficiency by 18% since 2005 while increasing energy consumption by 27% [60]. Similarly, the commercial sector has improved energy efficiency by 30%, but increased energy consumption by 52%. In the transportation sector, energy efficiency improvements and changes in demand structure have resulted in reductions of 23% and 14% in energy consumption for passenger and freight transportation, respectively, despite increases in demand. In the residential sector, a shift toward larger housing and the acquisition of new types of household appliances (e.g., clothes dryers, vacuum cleaners, and massage chairs) have prevented a net reduction in energy consumption [61]. Finally, structural changes in the power generation sector have brought the largest reductions in energy consumption, mostly due to the previously mentioned shift from oil to natural gas for power generation.

    The net effect of improving energy efficiency in all economic sectors has not reduced the total energy consumption; nevertheless, it has increased only by half of what it would have increased without energy efficiency improvements.

    To quantify how effective changes in energy efficiency have been in total energy consumption without considering other economic and social factors, Su et al. constructed a composite index of energy efficiency that shows a slower rate of improvement when compared to that given by the reduction in Singapore's energy intensity since 2005 (Figure 5b). The gap between these two indicators shows the effects of structural changes in the economy, as well as differences in the growth of activity and demand for service in comparison to the GDP [62].

    The combustion of fossil fuels is Singapore's primary source of GHG emissions. According to the latest national emissions inventory of GHG based on 2018 data, fossil fuel combustion accounts for 91% of the total emissions (53,313 Gg CO2 eq [63]). This figure is consistent with that provided by the International Energy Agency, as shown in Figure 5c. Electricity generation accounts for 38% of all emissions. The industrial sector contributes another 38%, with land transport accounting for around 15%.

    With limited access to alternative energy sources, natural gas will remain Singapore's principal energy source for the foreseeable future. Nevertheless, the SGP 2030 states that low-carbon energy sources must start topping on energy needs across all economy sectors. For such an endeavor, the EMA launched the Four Switches plan to drive Singapore's energy supply transformation toward sustainability [64]. The first switch is to scale up the use of available renewable energy sources. The second switch aims to build regional power grids to increase low-carbon electricity. The third switch involves exploring emerging low-carbon alternatives such as hydrogen, as well as carbon capture and utilization. Through the fourth switch, the government will continue to work with companies to promote the adoption of more efficient power generation technologies.

    Solar energy remains Singapore's most promising renewable energy source, while improved energy storage systems should mitigate its intermittent nature. Solar photovoltaic systems are being installed on rooftops as well as offshore spaces, reservoirs, walkways, and vacant lots. Today, Singapore is one of the most solar-dense cities in the world. For the first half of 2023, the total solar energy capacity installed was 1006 MWp (power output under optimal conditions) [59]. It should reach 1.5 and 2 GWp by 2025 and 2030, respectively. This would be enough to meet around 2% and 3% of the projected electricity demand, and generate enough electricity to power 260,000 and 350,000 households a year, respectively. This is a commendable effort, but it covers only a small fraction of the country's total electricity demand (Figure 5d). Furthermore, solar power is subject to weather conditions. Frequent cloudiness, high temperature, and high humidity reduce the efficiency of photovoltaic cells, limiting Singapore's ability to host a significant solar energy capacity [65,66]. Here, energy storage becomes critical. Current plans aim to increase the energy storage capacity to 200 MW, allowing it to power over 16,000 households per day beyond 2025. This amount of energy, however, will not make the solar energy system self-sufficient, necessitating the use of natural gas as a backup power source.

    Other two important constraints for an effective transition to solar energy in Singapore are a lack of space to build large solar arrays and the short- and long-term environmental impacts of installing photovoltaic panels. According to the roadmap for solar photovoltaic energy in Singapore, only 36.8 km2 across the island can be used to deploy solar photovoltaic arrays [67]. Of this, 62% would be on buildings, including roofs and facades. The balance would be shared between temporary land-based installations (temporary because the land is zoned for another use), floating installations on reservoirs and unused near-shore sea areas, and panels installed above land, canals, and roads. The costs would vary depending on the option, and none are cheap when compared to installing arrays on large tracts of unused open land.

    The photovoltaic industry is still young in Singapore, and has not yet experienced problems in managing the waste generated by photovoltaic panels that have reached their useful life (20–25 years). However, an initial estimate suggested that up to 5,000 tonnes of photovoltaic waste could be roughly generated between 2022 and 2024, with the possibility of increasing exponentially in a few years' time [68]. Under the NEA Resource Sustainability Act, companies that import and sell solar panels must provide free take-back services for their customers when the panels reach the end of their useful life. Solar panels are made of potentially recyclable materials, such as aluminum, glass, and silicon, but their separation is costly. In addition, Singapore's photovoltaic waste is small when compared to other countries. Therefore, it might be more cost-effective to have large-scale regional recycling centers to collect photovoltaic waste from all ASEAN countries. However, a comprehensive life cycle analysis to evaluate the environmental impact of photovoltaic panels on a large scale in the local and regional contexts is missing. Initial assessments at the building scale suggest positive benefits [69,70,71].

    Similarly, no rigorous study has evaluated the impact on the local climate of changing the albedo of the urban surface by installing solar panels, nor the long-term ecological impacts of floating solar farms on aquatic ecosystems. The deployment of floating solar panels, "floatovoltaics" in short, on reservoirs and sea waters holds much promise in Singapore, and there has been a rapid rise in installation, even though there are still unknowns about potential environmental impacts, along with social, technical, and economic aspects [72]. Initial assessments conducted by PUB suggest minimal impacts on water quality and biodiversity with appropriate planning and design. Floatovoltaics have proven to perform 5–15% better than typical rooftop solar arrays due to the cooler temperature of the reservoir environment [73]. A 45-hectare floating solar farm was recently put into operation, producing 60 MWp and making it one of the world's largest inland floating solar systems (Figure S5) [74].

    An alternative to increase the share of renewable energy is to import electricity from other countries. Such imports could include electricity (via cable connections) generated by wind power, bioenergy, hydropower, geothermal, and even nuclear energy.

    Singapore is currently exploring ways to leverage bilateral and regional cooperation to tap on regional power grids for renewable sources. These include small-scale trials to import 100 MW (1.5% of peak demand) of electricity from Malaysia, and another 100 MW through a joint commitment with Lao PDR, Thailand, and Malaysia to integrate a cross-border network under the ASEAN Power Grid program [75]. As of the end of 2023, EMA had issued conditional approvals to import 1, 2, and 1.3 GW from Cambodia, Indonesia, and Vietnam, respectively, with the intention of importing at least 4 GW by 2035, accounting for roughly 30% of its electricity demand [76].

    Cross-border power integration would improve electricity security, affordability, and sustainability in Southeast Asia. However, there are a number of technical and institutional challenges to overcome, such as the harmonization of energy grids, the development of regulatory frameworks in line with domestic utility boards, and the willingness of countries to sell surplus energy while avoiding sovereignty interferences [77]. This will require a cooperative culture in which governments exchange information and align policies aiming to build fair and honest institutional trade capacities that benefit everyone. Strict transboundary environmental governance will be needed to prevent social and environmental risks to communities and ecosystems that provide the energy resources [78,79].

    The hydropower development along the Mekong River basin is an example of how the environmental and social impacts have outweighed the benefits of a regional source of renewable energy. The construction of dams has degraded the river basin's sustainability, threatened biodiversity, and endangered millions of people's livelihood. The existing dams have had a significant impact on the seasonal patterns of the Mekong River flow and associated flood pulses, affecting agricultural production and fishery yield. Communities have been displaced and denied access to lands, forests, and rivers crucial to their livelihoods [80,81,82,83]. Singapore will need to ensure that the dams used to generate the electricity it will import have undergone comprehensive environmental and social assessments that take into account cumulative impacts on communities and the ecosystem.

    Singapore is currently studying emerging technologies, such as low-carbon hydrogen and carbon capture, utilization, and storage, as alternatives to decarbonize the power sector [76]. Hydrogen is considered a clean fuel as it does not produce CO2 when burned, but only if it is produced from renewable resources or extracted from geologic sources. Most hydrogen today is produced from natural gas; a cleaner option is splitting water with electrolysers, but it is approximately 2.5 times as expensive [84]. Green technologies to store and generate hydrogen are still nascent and expensive, but they have been considered as an alternative to achieve net zero carbon emissions in the medium to long term, as costs come down as more plants are built [85,86]. Similarly, processes are still being developed to capture CO2 produced from emission sources such as power plants and refineries, convert it into usable products (e.g., construction materials, chemicals, and synthetic fuels), or transport and deposit it in storage sites to prevent it from entering the atmosphere [87,88]. One major issue with the latter is that the CO2 stream's purity must exceed 95% in order to reduce the costs of compression and storage.

    It is unclear when and where low-carbon hydrogen will be produced at economies of scale, or how it will be transported to Singapore in a secure and cost-effective way. Similarly, while there are still questions about whether the extraction of natural hydrogen, a potential non-fossil renewable fuel, will be commercially viable in the near future [89], Singapore has recognized that low-carbon hydrogen can be a major decarbonization pathway to meet its net zero carbon emission commitments by 2050. So, it is already working with international partners to incentivize the exploration of geological hydrogen wells and accelerate the development of hydrogen supply chains, while developing local capabilities and infrastructure to be ready to integrate hydrogen when it becomes commercially available [90].

    Geothermal, biomethane, nuclear fission, and nuclear fusion technologies are all expected to be low-carbon supply alternatives in the future. As with hydrogen, Singapore should collaborate with industry and research partners to develop these technologies and build capabilities to adapt them as soon as they prove suitable in the local context.

    Future generations of small fission modular reactors and advances in nuclear fusion technology hold promise for unlocking low-carbon and low-radiation energy, allowing to cover up to 10% of the country's needs through nuclear energy by 2050, as recently determined by a study commissioned by Singapore's government [76]. Small modular reactors (with a total capacity of up to 300 MW) show particular promise. They offer flexibility in plant design and maintenance, making them suitable for use alongside other clean alternatives. Fast neutron reactors operate with enough energy to cause the fission of many heavy atoms, potentially eliminating both nuclear waste and reliance on uranium as the only fuel source [91].

    The Energy Conservation Act went into effect in 2013 with the target of increasing energy conservation for large energy users (companies that consume over 54 TJ or more of energy per year) through regular energy monitoring and reporting, as well as the implementation of structured energy management systems [92]. Originally, the objectives were to improve companies' energy performance to make them more competitive in the global economy, to complement existing schemes that help them invest in energy efficiency, and to ensure a coordinated approach to setting energy efficiency standards across all industries. In 2017, the Act was amended to include more energy management practices as part of Singapore's efforts to meet its pledge under the Paris Agreement on Climate Change to increase energy intensity by 36% from 2005 levels by 2030 by achieving energy efficiency improvement rates of 1–2% per year, similar to those achieved by leading developed countries. The amendments include strengthening GHG emission measurements and reporting requirements, requiring companies to develop energy efficiency improvement plans, conducting periodic energy efficiency opportunity assessments, and establishing minimum energy efficiency standards for common industrial equipment and systems. To phase out inefficient common industrial equipment and systems, Minimum Energy Performance Standards (MEPS) for induction motors and Minimum Energy Efficiency Standards (MEES) for water-cooled chilled systems were recently introduced [93].

    The government also works to create a cleaner industrial ecosystem by providing co-funding support and voluntary partnership programs for companies. The Energy Efficiency Fund (E2F) supports companies in the industrial sector to be more energy efficient [93]. Companies can receive co-funding support for projects such as the resource efficient design of new facilities or major expansions, carry out energy assessments for their existing facilities to identify potential areas for energy efficiency improvement, adopt energy efficient equipment or technologies, switch to water-cooled chillers using refrigerants with low global warming potential, and implement energy management information systems to effectively manage energy use in a structured manner.

    Singapore became the first Southeast Asian country to levy a carbon tax in 2019. The initial carbon tax rate was set at SG$5 per tonne CO2 eq, by 2024 and 2026 it will raise to SG$25 and SG$45 per tonne CO2 eq, respectively, with the aim of reaching SG$50–80 per tonne CO2 eq by 2030. The goal is to provide a strong price signal and incentive for industries to reduce their carbon footprint in line with national climate objectives. The carbon tax currently applies on facilities emitting 25,000 tonne CO2 eq or more annually, and it covers all large emitters such as oil refineries and power generation plants, which contribute to 80% of the national GHG emissions [94]. The revenue will be used to support decarbonization efforts and the transition to a green economy, as well as to mitigate the impact on low-income households. On average, households will see a SG$4 increase in their monthly utilities bill, which should have a minor impact on most of them. However, the carbon tax will have an impact on downstream industries and businesses (e.g., transportation, retailers, workshops, restaurants, etc.), which may end up passing the additional cost to consumers, ultimately affecting households' expenditure. Therefore, the government must ensure that the carbon tax does not cause an excessive increase in the cost of living while also maintaining the competitiveness of local companies.

    The Building Construction Authority's Green Mark Scheme is the backbone of Singapore's strategies to increase energy efficiency in buildings [95]. It is a rating system designed specifically for the tropics to evaluate and set benchmarks for environmental sustainability in buildings. The Green Mark Scheme is part of Singapore's Green Building Masterplan [96], and it seeks to encourage developers and owners to construct and maintain greener buildings. The design of a building has direct impact on energy efficiency. Existing buildings can be retrofitted with green designs to improve their energy efficiency. Table 2 lists the main programs and incentive schemes implemented by the BCA to support these strategies.

    Table 2.  Schemes and programs developed to encourage the implementation of innovative solutions to improve energy efficiency in Singapore's buildings as part of the 80-80-80 plan in 2030.
    Scheme/Program Description
    Green Mark Scheme 2021 [95] Provides a robust and leading method for assessing and verifying buildings' environmental performance, assisting designers and building owners in delivering and demonstrating high performing and sustainable buildings. It is based on best practices, climate science, analyses of large building performance data sets, and global thought leadership. The scheme aims to further stretch building outcomes to reduce environmental impacts, with a focus on whole-life carbon, health and well-being, resilience, intelligence, and maintenance.
    Building Retrofit Energy Efficiency Pilot Scheme [97] Enables building owners with limited financial resources to go green by encouraging financial institutions to provide financing for energy efficiency retrofits. The BCA shares the risk of loan default with participating financial institutions that make loans to building owners and energy service companies carrying out green retrofits.
    Built Environment Transformation Gross Floor Area Incentive Scheme [97] Aims to increase adoption of enhanced Construction Industry Transformation Map standards in areas of digitalization, productivity, and sustainability in private sector developments. It applies to both residential and non-residential developments.
    Super Low Energy Buildings Program [98] Encourages firms to go beyond the current Green Mark Standards. A Super Low Energy Building must be powered by renewable energy sources, both on-site and off-site, with the former being prioritized.
    Building Energy Benchmarking Report [99] Commercial building owners must disclose data on energy consumption and efficiency to improve transparency and raise awareness about the energy performance of their buildings.
    GreenGov.SG initiative [4,95] All new and existing public buildings (upon major retrofit) must meet Green Mark Platinum Super Low Energy standards or equivalent, where feasible. New public sector buildings must obtain Green Mark certification, including Green Mark Platinum for new buildings with an air-conditioned area greater than 5000 m2.
    Green Buildings Innovation Cluster Program [100] Promotes the development and implementation of promising energy-efficient building technologies and solutions in the tropics. It uses an integrated research, development, and demonstration hub to provide a platform for out-of-lab research results, encouraging building owners, consultants, and stakeholders to adopt innovative technologies in upcoming projects or existing buildings.

     | Show Table
    DownLoad: CSV

    The Green Mark Scheme consists of a set of standards that developers and owners must meet to achieve a 28% improvement in energy efficiency over 2005 building codes. These standards, which apply to both new and existing buildings undergoing major retrofitting works (with a gross floor area of 2000 m2 or more), help buildings achieve energy savings ranging from 20% to 40% over their lifetimes. The scheme is aligned with the United Nations' Sustainable Development Goals, emphasizing designing for maintainability, reducing embodied carbon throughout the buildings' life cycle using smart technologies, enhancing buildings' resilience to climate change, and creating healthier environments for building users.

    The 80-80-80 plan was launched as part of Singapore's Green Plan 2030 to speed up the transition to a low-carbon built environment, with a focus on three targets. The first target is to have at least 80% of buildings (by floor area) green by 2030. By the end of 2022, 55% of Singapore's buildings had been greened. The second target is for 80% of new developments (by floor area) to be classified as Super Low Energy Buildings by 2030. These buildings must improve their energy efficiency by at least 60% over 2005 building codes. While the third target seeks to increase energy efficiency from 65% to 80% (over 2005 levels) for best-in-class green buildings by 2030.

    The government works to increase the role of households in climate change mitigation by designing energy-efficient public housing real estates that include innovative features such as solar panels on rooftops to power common services such as lifts and lights, together with public programs to encourage people to choose more efficient electrical appliances and adopt energy-saving habits.

    In general, air conditioners, water heaters, and refrigerators account for 52% of household energy consumption [101]. To encourage the use of more energy-efficient appliances, Minimum Energy Performance Standards (MEPS) and Mandatory Energy Labelling Schemes (MELS) have been introduced for air conditioners, refrigerators, televisions, clothes driers, and lamps [93]. MEPS eliminate energy inefficient models from the market, whereas MELS enable consumers to make more informed purchasing decisions. Since the introduction of both, the average energy efficiency of air conditioners and refrigerators has increased by about 13% and 26%, respectively. In 2020, NEA and PUB introduced the Climate-friendly Household Program to encourage households to purchase energy-efficient appliances and water-efficient shower fittings by providing vouchers to low-income residents [102].

    Several public campaigns have been launched to encourage people to save energy at home while reducing electricity bills (https://www.climate-friendly-households.gov.sg). However, many residents are reluctant to modify their habits. The most recent household energy consumption study revealed slow progress in energy-saving actions [101]. For example, only 54% of households set their air conditioners to 25 ℃ or higher. Those who do not believe the amount of money saved is insignificant. The ongoing initiative to install advanced electricity meters at residential premises is expected to reverse this situation and encourage consumers to be more energy efficient. These meters allow households to track their electricity consumption every half-hour via a mobile application and get a better idea of where and when they can start reducing their usage [103]. As of the end of 2020, about 400,000 such meters had been installed throughout Singapore; by 2026, the remaining 1.1 million homes will have them installed.

    Singapore envisions a street layout that prioritizes walking, cycling, and public transportation, with autonomous vehicles complementing those transport modes in the future. The Land Transport Master Plan (LTMP) 2040 describes the strategies to meet such a vision [104]. Seventy-five percent of all peak-period journeys will be made on public transportation, up from 67% nowadays. All journeys to the nearest neighborhood center will take less than 20 minutes by a combination of walking, cycling, and riding public transportation, while nine out of ten peak-period journeys should take less than 45 minutes. The goal is to make walking, cycling, and public transportation so convenient, fast, and comfortable that commuters will prefer them over private commutes. More space will be reserved for public transportation, active mobility, and community uses. The streetscape will change so that people can easily walk and cycle to nearby bus stops, train stations, and other amenities. The rail and bus networks will grow, providing more connections while improving accessibility, reliability, and comfort. Figure 6 shows the current transportation trends, including ridership and travel time.

    Figure 6.  Transportation trends. (a) Ridership proportion and (b) travel time by transport mode among Singapore residents commuting to work [105]. (c) Average daily ridership by transport mode. Private vehicle ridership data are released every 4–5 years as part of the Household Interview Travel Survey [106,107]. The 2020 data in (a) and (b) do not account for temporary arrangements made due to COVID-19 restrictions, unlike data in (c). Taxi data in (c) include taxis, cars, and private-hire cars. The rail network consists of the Massive Rapid Transit (MRT) and Light Rail Transit (LRT) systems.

    In 2020, 57.7% of residents took trains and buses to get to work, which is up from 54.6% in 2010 (Figure 6a). The share of those who relied solely on a car for their work commutes dropped from 24.8% to 21.9%, while the proportion who travelled only by taxi or private-hire car increased from 1.3% to 3.0%. The share of residents who used other modes of transportation, such as motorcycles and private chartered buses, also decreased. About 9.8% of residents did not need any transportation to get to work in 2020, up from 7.5% in 2010; however, fewer people were cycling, with the proportion dropping to 1.6% from 2.1% and 4.7% in the previous 10 and 20 years, respectively [105].

    While connectivity has improved, those who take the bus or train to work now travel longer distances than a decade ago. The median travel time to work increased from 30 minutes in 2010 to 37 minutes in 2020 for those commuting by public bus, and from 40 minutes to 45 minutes for those commuting by train (Figure 6b). Those who take the train and bus clocked 60 minutes in 2020, up from around 50 minutes in 2010 and 45 minutes in 2005. The corresponding travel time by car was 30 minutes in 2020, the same as 10 and 15 years before [105]. According to the Moovit Public Transit Index, the average one-way commute time including walk, waiting, and travel times on public transport is 47 minutes nowadays, with 30.8% spending up to 30 minutes and 19.9% spending one to two hours. Singapore residents commute from an average distance of 7.7 km, while 21.6% travel 12 km in a single direction by public transport. Seventy-two percent of commuters must transfer at least once in their daily trips, with an average wait time of 9 minutes at bus stops and train stations [108].

    A higher frequency of buses and trains, and in turn less crowded units and shorter waiting time at stations, in concert with clean, comfortable, and safe vehicles with better accessibility for people with needs (wheelchairs, ramps, etc.), closer bus stops and train stations to peoples' homes and workplaces, accurate and reliable arrival times according to published schedules, and affordable cost fares, have contributed to increased public transportation ridership (Figure 6c). However, commuting by public transport still entails longer travel times compared to using private transportation (Figure 6b). One factor could be that more people now live farther away from their workplaces. New train lines and longer trunk bus routes could have also enabled more people to travel longer distances by public transportation. In contrast, traffic congestion has not worsened; the vehicular fleet has increased just 3.0% in 10 years, reaching a maximum of 947,704 vehicles in 2023, while the road network has expanded less than 6% [109]. The introduction of new public bus routes with direct connections and fewer stops along priority corridors (e.g., express lines and bus rapid transit systems), as well as the continued expansion of the rail network, will reduce commuting times.

    Ridership on public transport fell by about 34% in 2020 as a consequence of the measures taken to curb the spread of COVID-19, and by 2023, it had not returned to previous levels (Figure 6c). Vehicular traffic only experienced a drastic drop (51%) during the lockdown period (April 7–June 1, 2020). Less than two months after the lockdown, Singapore's streets had already returned to pre-pandemic congestion levels [110]. The 56 days of the lockdown cut on average 40% of CO2 emission from vehicular traffic, but it was just a temporary relief, as it meant a reduction of only 7% in annual emissions [111]. An effective mitigation pathway will require an integrated life cycle assessment involving all transport modes and main strategies to reduce travel demand, promote a modal shift from private to public transportation, and improve vehicles efficiency by testing different technologies and scenarios [112].

    The Land Transport Authority (LTA) spearheads the operation and maintenance of transport infrastructure and systems, as well as harnesses technology to build a connected and integrated city by clean public transport and active transport modes that support a healthy lifestyle. The rail and bus networks are the backbone of Singapore's land transportation (Figure S6).

    The rail network (Massive Rapid Transit, MRT) currently covers 230 km and is expected to grow to 360 km by 2030. According to the planned expansion, 8 out of 10 households will be within a 10-minute walk of a train station [113]. In addition, three light rail lines (Light Rail Transit, LRT) covering 29 km connect residents living in residential states to the nearest MRT station. Today, 140 well-equipped, modern, and clean stations on six MRT lines serve over 3.2 million passengers daily. Eleven of these stations are designated as Integrated Transport Hubs, with connections to bus interchanges.

    Almost 6,000 public buses ply the roads; 50% are double-decker buses, and the majority are powered by diesel engines under Euro Ⅴ or Ⅵ emission standards [114]. More than 350 routes cover the city, with commuters waiting no more than 8 minutes to board a bus during peak hours and no more than 15 minutes during off-peak hours. Electric buses account for 1% of the fleet, but 360 new electric buses will be gradually introduced from 2025. By 2030, they are expected to make up half of the fleet, and the goal is to have a complete bus fleet that runs entirely on cleaner energy [115].

    Significant efforts have been made to make trains and buses the preferred commuting choice. The government recognizes that good public transportation is essential for all aspects of Singapore's life. LTA owns the rail operating assets, while rail operators run and give maintenance to trains and stations, focusing on providing reliable and comfortable commutes. Similarly, new buses have been introduced into the system through a new bus service program in which LTA owns the buses and operating assets, such as depots, as well as the fleet management and ticketing systems, while private companies operate the service [116]. In the last decade, bus and train capacities have increased by 20% and 50%, respectively [113].

    On average, a typical Singapore family using public transport on a daily basis spends 4.8% of their disposable income on transportation [117]. The fare structure is fully integrated, so there are no additional boarding fees when transferring between trains and buses. Bus and train fares are based on the distance travelled and charged in a granular manner (i.e., each fare band after the initial 3.2-km fare increases in denominations of 1 km). The fare is adjusted using a Network Capacity Factor, which caps the maximum allowable fare while accounting for changes in operating costs arising from network capacity adjustments versus commuter demand. Children, students, senior citizens, national servicemen, people with disabilities, and those on workfare income supplements are all eligible for concession rates. The government provides economic assistance to renew operating assets and subsidizes the system operation. This translates to more than SG$1.00 in subsidies per journey [118], making public transportation affordable for everyone.

    Singapore commuters value public transportation highly. The most recent annual survey on public transportation customer satisfaction revealed that 93% of commuters were satisfied with the service provided by buses and trains [119]. Commuters are generally satisfied with safety and security, reliability, service information, accessibility at bus stops and train stations, and customer services, but are somewhat dissatisfied with waiting and travel time, and comfort. Therefore, the commuting experience will improve by addressing crowding, commuting distance, and time pressures. Enjoyable commutes boost people's moods, which in turn improves their work attitudes and performance, as well as their interactions with others [120].

    Controlling the rate of vehicle population growth, restricting car ownership, and managing traffic congestion by charging vehicles entering specific roads are examples of Singapore's private transportation management measures.

    Restricting car use and reducing car ownership have controlled the environmental impact of private transportation, while road-pricing schemes have kept the city free of traffic congestion. Because charges are levied on a per-use basis, the negative externalities of road congestion caused by drivers are accounted for, encouraging commuters to use public transportation or alternative routes and travel times.

    Singapore was the first city to implement an electronic toll in 1998, with rates varying depending on the hour, location, traffic volume, and vehicle characteristics. The Electronic Road Pricing (ERP) system has proven to be an effective tool that forces drivers to become part of the solution rather than the problem. Current plans anticipate making the scheme more flexible, charging motorists according to the distance travelled on congested roads, rather than charging all motorists the same amount as long as they pass a gantry. Several studies have evaluated its effectiveness in managing traffic congestion as a unique example of innovation in the public sector [121,122,123].

    The number of vehicles on the roads is also controlled by the cost of owning a car. In addition to the sales tax, registration fee, an excise duty, and other special taxes, a Certificate of Entitlement (COE) is needed to get the legal right to own a car for a period of ten years [124]. The cost of this certificate is determined by demand, and it often exceeds the cost of the car itself. The CEO was introduced in 1990 as part of a Vehicle Quota System (VQS) limiting vehicle growth to 3% per year. Since 2018, the annual growth rate for private cars and motorcycles has been set at 0%, while the fleets of good vehicles and buses are set to a growth rate of 0.25%.

    Traffic pollution has been controlled through regulatory measures governing fuel composition, vehicle emission standards, vehicle inspection and maintenance programs, and scrapping old cars. Leaded gasoline was phased out in 1999. Since 2017, the use of ultra-low or near sulfur free (10 ppm) diesel and gasoline is mandatory. Every gasoline vehicle registered for the first time must meet the exhaust emission standards set by the Environmental Protection and Management (Vehicular Emissions) regulations. Emission standards have been tightened over the years to keep up with advances in vehicle technology. From 2018, all new diesel and gasoline vehicles have to meet Euro Ⅵ emission standards or equivalent [125]. Motorcycles are tightened to Euro Ⅳ standards.

    All vehicles are required to undergo mandatory periodic inspections to ensure that they meet the emission standards stipulated in the regulations. The inspection schedule is determined by the vehicle's age and type, with older and diesel-powered vehicles having shorter inspection intervals [125].

    To encourage early retirement of older vehicles, motorists receive a rebate for the COE and registration fee for a new car when they deregister vehicles with still valid COEs. The rebate is calculated based on the amount originally paid for the COE and its remaining validity. Owners have to send their cars for scrapping or exporting. This rebate works as a mechanism for controlling car population because with each deregistered car, a new car is registered.

    Despite the effectiveness of public policies aimed at restricting car ownership, Singapore has paradoxically created an environment that encourages car ownership. The success in keeping the city free of traffic has, ironically, encouraged residents to own cars. Commuters who drive can save at least 30 minutes per trip (Figure 6b). Trips on public transportation are at least twice as long as those in private vehicles, which encourages car ownership. In contrast to other large cities, parking is not an issue. Carparks in public housing states are abundant, and the government subsidizes their cost.

    Similarly, motorists do not have difficulty finding vacant lots to park their vehicles in office and commercial buildings. Furthermore, owing a car in Singapore is tagged to one's wealth and class, thus many Singaporeans aspire to own a car. Making cars even more expensive and taking away carparking subsidies may not be an option for the government. However, in line with the vision of a "Car-Lite Singapore" introduced as part of the Sustainable Singapore Blueprint for 2015 to reduce reliance on cars and shift to public transportation, cycling, walking, and car-sharing services [126], it may be time to start reducing the number of annual COEs available for bidding to gradually reduce private car ownership.

    The taxi population has plummeted by 50.8%, from 27,695 units in 2013 to 13,620 in 2023. Meanwhile, the number of private-hire cars has nearly quintupled, increasing from 16,396 to 81,754, becoming the primary driver of demand. The dramatic increase of private-hire cars has also reduced the private car population by 5.8%, from 607,292 in 2013 to 572,014 in 2023 [109].

    Currently, taxis account for 14% of total ridership, while private-hire cars account for 86%. To compensate for this situation, a new regulatory framework was released in 2020, granting taxi drivers the ability to sign up with any ride-hailing company to provide fixed-fare rides [127]. The main difference between taxis and private-hire cars now is that taxis can pick up street-hail rides. However, the future of the taxi industry is uncertain.

    This situation creates an opportunity to improve public transportation, as well as to develop new transportation schemes for people looking for alternative ways to commute without owning a car. A good example is BlueSG, Singapore's first large-scale electric-car-sharing service (Figure S7). BlueSG is a private initiative supported by the LTA and Singapore's Development Board that provides access to a network of shared vehicles 24 hours a day all year round at 380 self-service charging stations located in public housing, downtown, and shopping malls throughout the city (www.bluesg.com.sg). It is a promising initiative, but the number of charging stations where cars must be parked after completing a trip should be significantly increased. If commuters cannot park close to their destination, there is no point in renting a car. Additionally, rental rates must become competitive. Nowadays, it is cheaper to call a private-hire car than to drive a BlueSG car.

    Singapore plans to phase out internal combustion engine vehicles by 2040. According to the SGP 2030, new registrations of diesel cars and taxis will end in 2025, and all new car and taxi registrations will be of cleaner-energy models starting in 2030 [4].

    For passenger vehicles, the most promising clean energy option is electric vehicles. The share of electric vehicles in new car registration increased from 0.2% in 2020 to 18% in 2023, with a current count of approximately 11,000 electric vehicles, which is still a modest number when compared to the overall vehicular fleet; however, more than half of the taxi fleet has already switched to hybrid models. To accelerate the adoption of electric vehicles, an ambitious program has been launched to build charging points closer to people's homes. The target is to build 60,000 charging points nationwide, with 40,000 in public car parks, and 20,000 in private premises. There are currently 2,200 charging points, but not all of them are open to the public.

    Electric vehicles are low-maintenance and cheaper to drive than gasoline cars, but they still need to achieve economies of scale. They cost more than gasoline cars, even though there are various incentives and rebates currently available in Singapore [128]. Another drawback is the time required to recharge their batteries. Fast chargers are still limited throughout the city, but they even take 40–50 minutes to charge a small electric car's battery from zero to 80%. When it comes to lithium-ion batteries, we must also consider the electronic waste that could be generated in the absence of effective recycling management, as well as the environmental risk and human rights issues associated with the extraction of the raw materials used in their construction, such as cobalt and lithium [129,130].

    The absence of tailpipe emissions will reduce personal exposure to airborne pollutants in traffic microenvironments [131,132,133,134], but it won't completely eliminate traffic pollution. Non-exhaust emissions (i.e., brake abrasion, tire wear, and resuspension of road dust) will continue; studies have shown that electrification has little impact on particle emissions [135]. Similarly, Singapore generates most of its electricity from natural gas, although it is one of the cleanest fossil fuels, which still emits CO2 when burned as any other type of fossil fuel. This is without accounting for methane leaks into the atmosphere during the extraction of the gas [136]. At the end, carbon emissions would simply shift from cars to power plants. In terms of urban warming, electric engines produce less waste heat than internal combustion engines; however, the complete electrification of Singapore's vehicular fleet is unlikely to lead to a reduction in the near-surface temperature due to the typical atmospheric conditions of the city [137].

    For these reasons, electric private vehicles should not be seen as the solution to reducing carbon emissions and addressing mobility needs. In many ways, they behave similarly to conventional cars, with nearly identical environmental and social consequences. They take up the same amount of road space and do not reduce traffic congestion, road traffic accidents will continue, and electric vehicles will eventually jeopardize the vision of a "Car-Lite Singapore".

    Currently, only about half of short journeys (<20 minutes) are completed on foot or bicycle. The proportion of residents walking to work has increased slightly, but not the proportion of cyclists; 9.8% and 1.6% of residents walk and cycle to work, respectively (Figure 6a). Thus, there is room to increase active mobility by expanding the network of cycling paths throughout the city, and building convenient and covered paths for pedestrians to reach everyday amenities in their neighborhoods.

    The SGP 2030 aims to triple cycling paths' lengths to 1,320 km from 460 km in 2020. Similarly, over 200 km of covered walkways have been built to connect schools, healthcare facilities, and other public amenities within a 400-meter radius of train stations, and within a 200-meter radius of bus interchanges and selected bus stops as part of the Walk2Ride program [138]. Also, a number of innovations in urban infrastructure have been made to improve accessibility and safety for pedestrians and cyclists, such as providing bicycle parking lots at public transportation nodes and public housing void decks, installing 40 lifts at overhead bridges, and constructing 50 silver zones with features to enhance walkability for the elderly.

    It is true that significant efforts are being made to expand and improve active mobility. Every day, more neighborhoods are connected by paths for pedestrians and cyclists. However, the response has been disappointing, as many commuters are reluctant to consider cycling as an option for daily transport (Figure 6a).

    Singapore residents walk on average 1.2 km to get around each day with public transportation, while 14% walk more than 2 km per day; but very few ride a bicycle to complete their trips, with 74% of commuters refusing to ride one [108]. Only one-third of those who claim to ride a bicycle often do so to complete the first and last leg of their trips. Many people consider it is unsafe since there are not enough dedicated bicycle lanes, which is true in many areas of the city. Most cycling paths have been built within and between residential states, but they do not connect to workplaces. Many paths have been built for recreational purposes, i.e., Park Connectors [139], but without taking into account daily commutes.

    Nowadays, cyclists compete for space with pedestrians and drivers. They can ride on roads, footpaths, and sidewalks causing chaos and putting everyone in danger. There has been much debate about it, and a concrete solution has not been found [140]. There appears to be a fear of returning to street layouts similar to those of the 1960s and 1970s, when cycling was the predominant mode of transportation and several roads had dedicated bicycle lanes next to footpaths. A set of rules and a code of conduct for cyclists are in place seeking the safe sharing of public paths among various users [141,142]. However, it is unclear if these rules are enough to solve the problem and encourage the use of bicycles on a regular basis [143].

    Bold policies are needed to give priority to pedestrians over cyclists, and cyclists over motorists. These policies will undoubtedly lead to the opening of exclusive lanes for cyclists along main throughfares to the detriment of motorists, but will align with the vision of a "Car-Lite Singapore".

    Cycling became popular during and after the COVID-19 pandemic. Surveys show that it tripled in popularity [144]. Singaporeans increasingly view cycling as more than just a sport or recreation, so now is probably the best time to transform the layout of Singapore's streets and build a comprehensive cycling network that allows people to ride almost anywhere at speeds of 7–8 km in half an hour.

    The cycling network will require the implementation of a system of docked shared bicycles properly integrated into the train and bus networks, with dedicated racks close to people's homes and workplaces. Dockless bicycle-sharing platforms have already proven to be inefficient (Figure S8). Thousands of dockless shared bicycles flooded the city in 2017, eventually clogging sidewalks. One year later, LTA passed a bill requiring all operators to take steps to ensure that their customers practice responsible parking. This included requiring users to scan a unique QR code at the parking location as proof of correct parking [145]. Failure to do so resulted in additional charges on top of the rental fee, as well as bans on future rentals. Only two of the eight initial operators remain on the market, and they have yet to be taken to the ground.

    The statistics in Figure 6 do not account for the use of lorries to transport migrant workers. Over 440,000 low-wage workers are transported daily from dormitories to workplaces in sectors such as construction, manufacturing, and cleaning [146]. They are seated in the back of these vehicles, without seat belts or other safety features to protect them in the event of a collision. They are also exposed to bad weather; in the event of rain, they become soaked. It is common to see lorries overloaded with workers, equipment, and materials. Many employers claim that exclusive bus transportation for their workers would raise the operation costs for their business [147].

    It is urgent to address the system flaws that force migrant workers to take inappropriate and dangerous transportation. They must be transported safely, comfortably, and with dignity. Additional costs cannot be used as an excuse to avoid hiring buses and minivans for their transportation. Authorities must recognize migrant workers as equals rather than as production factors. They are part of Singapore's society.

    Trucks, which account for 16.7% of all vehicular traffic in Singapore, are the primary mode of transportation for goods. An estimated 4,000 trucks make over 20,000 delivery trips daily and take up approximately 25% of Singapore's road space [126]. As part of the Infocomm Media 2025 Plan, the government is testing new technologies and models to consolidate and coordinate a comprehensive logistics system, leading to a more efficient use of delivery trucks and increased productivity in the sector, and contributing to the vision of a "Car-Lite City". The implementation of an in-mall distribution model, offsite consolidation centers, and federated lockers and collection points is expected to reduce the number of trucks on the road by a quarter, delivery manpower by 40%, and delivery waiting and queuing time by 65% [148].

    The in-mall model employs services provided by a third-party in-mall operator to perform centralized receiving of goods on behalf of tenants before redistributing them at scheduled times. This reduces wait time and allows delivery trucks to achieve much faster turnaround times at the docks by ensuring that goods are received in a coordinated manner. The initial application of this model in selected malls was well-received, reporting significant time savings and increased efficiency.

    The consolidation of freight distribution in offsite centers equipped with advanced sorting processes aims to maximize the efficiency of each delivery trip before delivering goods to shopping malls and other destinations. Combining same-destination deliveries will reduce truckload utilization, and therefore trips generation [149].

    In anticipation of continued changes in retail patterns and rapid growth of e-commerce, Singapore is already deploying a nationwide network of parcel lockers in public locations to speed up home deliveries and lower operating costs. Currently, over 1,000 lockers have been installed. This system allows for 6–10 times the number of drop-offs completed by a local courier company in one day [149].

    New schemes based on the so called "Industry 4.0" model for Singapore's logistics ecosystem are under consideration [150]. These schemes propose new models based on emerging technologies that will transform the logistics market, and movement of goods. However, the benefits of the models already tested have not been disclosed. Before moving forward with even more advanced freight transportation models, they must be thoroughly evaluated in terms of their effectiveness toward a circular economy model.

    Singapore began its journey toward circularity about 50 years ago, when the first plans and strategies for sustainable water management were drawn, eventually closing the water loop and ensuring that everyone had access to clean water at home. Science and technology have been key in unlocking water solutions, as well as community efforts to keep water use sustainable and efficient [2]. The current challenge is to extend circularity's success to all other sectors of the economy and daily life activities, while the city as a whole continues to serve as a hub for trade, manufacturing, banking and commerce, transportation and shipping, energy and infrastructure, technological development, education, and culture.

    The implementation of a circular approach in all economic sectors will contribute to building a sustainable society in which all citizens can find the conditions to forge a successful future while taking into account the well-being of everyone, including transient workers who are essential to Singapore's urban landscape.

    Singapore must reassess its economy, production, and consumption rhythms along with its ASEAN neighbors and beyond to achieve a fully circular economy. Singapore's economy is dependent on regional development, as well as the choreography of actions that move the regional and global economy and, inevitably, have an impact on the environment.

    It is still too early to evaluate Singapore's efforts to achieve a balance between economic growth, social equity, and environmental sustainability as a whole. However, it is safe to say that Singapore has the foundations in place to meet its ambitious environmental goals, as well as the confidence to make them a reality. Singapore has drawn the institutional framework to build a circular system to become a zero-waste and zero-carbon-emitting nation by mid-century. Enforcement is currently under construction. Nevertheless, there are still aspects to consider and policies to refine. The framework for implementing a circular system must be constantly evolving in order to face the threats posed by a changing climate, a society exposed to technological advances, and a myriad of political and economic challenges.

    Similar to enforcement, the development of metrics and monitoring tools to assess progress in implementing policies to achieve circularity are still under construction. Singapore has set clear timelines for turning circular, but mechanisms to assess its progress have yet to be defined. Periodic assessment of the benefits gained from moving to a circular system in all economic sectors could help avoid delays and risks in the implementation of such an approach.

    Note that Singapore's circularity cannot be compared to that of other countries because it is a city-state and thus a one-of-a-kind example. Nonetheless, Singapore's success and experience in designing and implementing circular economy policies could serve as a model for other high-density and rapidly expanding ASEAN cities, as well as any city in the tropics in general. Singapore can be used as an example to gain a better understanding of what a circular city might be [151]. Although there are no mechanisms in place to assess a city's level of circularity, Singapore can be considered a city leading the way in the transition to a circular economy in sectors such as water, urban mobility, housing and infrastructure, and energy efficiency. In sectors such as recycling, food waste, and renewable energy, for example, new policies and financial incentives have been enacted, the results of which shall be seen in the near future.

    Singapore, a small but advanced urban economy, has achieved a high-quality living environment. It has learned to integrate urban and transportation planning, solve energy and food supply issues, and merge environment and health with social inclusion and economic progress. However, Singaporeans should not take these achievements for granted forever. The COVID-19 pandemic demonstrated that unexpected events can easily break the current framework. The pandemic exposed our society's flaws and showed the need for more ambitious and concrete action plans to build resilient and inclusive nations in harmony with the environment. We need to replace the current linear economic model of "take-make-dispose" with a circular one that prioritizes reductions in resource production and products consumption.

    This is a hard task for a society that relentlessly strides toward material success. Excessive consumerism has become a typical feature of Singapore's culture (Figure S9). Singapore's society is characterized as being excessively materialistic, self-centered, and competitive [152]. It is not a secret that material wealth and possessions are seen as status symbols in Singapore; consider the infamous "five Cs", which many Singaporeans still aspire to: cash, car, credit card, condominium, and country club membership. True, some of these aspirations resonate less with younger Singaporeans today, but they are still deeply ingrained in Singapore's society.

    Singaporeans need to explore their relationship with the natural world in order to solve environmental problems. They need to change their mindset and realize that the environment is not "out there", but rather that they are a part of it. It is time to reconsider what is at stake if they continue to live a life full of material aspirations consuming the world around them. Despite being at the forefront of innovation and technology, as well as an example of governance, Singapore is still figuring out how to curb its excessive consumerism in order to reduce its environmental footprint. Ultimately, innovative and bold policies, sound science, and well-chosen technology can lead to circularity, but it will not be possible without a strong commitment from the entire society.

    Environmental problems must also be examined from the perspectives of the social sciences, humanities, education, communication, and arts. Scientists and scholars must develop clear and simple messages, and work closely with journalists, who are the ideal vehicle for communicating scientific and technical information to a lay audience. The media has the power to educate, influence, and drive changes in mindset and action across all sectors of society, including citizens of all ages and idiosyncrasies.

    The most challenging aspect to achieve circularity is the human component. Sustainable development must be based on culture. Singaporeans need to cultivate an appreciation for the landscape that they have built and start looking for their own happiness to achieve a stable and peaceful future. Singaporeans do not have time to enjoy the clean and safe landscape that they have built due to the hustle and bustle of everyday life (Figure S10). They are exposed to a highly competitive environment from a young age, and grow up getting used to being stressed all the time [153]. Studies have found that they wake up exhausted even after 7–8 hours of sleep [154,155]. In addition, during and after the COVID-19 pandemic, the boundaries between work and home have blurred, resulting in increased stress and less rest. An unhappy, stressed, and tired society will never work together to achieve meaningful and long-term environmental solutions. Singaporeans must change their work-life balance paradigm, not only to be able to work collectively to implement a circular system, but also for their own sake and happiness.

    The author declares that he has not used artificial intelligence (AI) tools in the creation of this article.

    This study was supported by the Economic Research Institute for ASEAN and East Asia (ERIA, ERIA-PDD/PI-1-2-2-2103/10/FY21). The author acknowledges the Ministry of Sustainability and the Environment and the Singapore Food Agency for their comments and information provided. The comments and suggestions from Intan Murnira Ramli of ERIA are also greatly appreciated, as well as those of two anonymous reviewers and the editor.

    The author declares that there are no competing interests.


    [1] Lim WD, Tan GH (2018) A Resilient Singapore. Singapore: Centre for Liveable Cities Singapore. Available from: https://www.clc.gov.sg/research-publications/publications/books/view/a-resilient-singapore.
    [2] Public Utilities Board (PUB) (2018) Our water, our future. Available from: https://www.pub.gov.sg/resources/publications.
    [3] Ministry of the Environment and Water Resources (MEWR) (2019) Zero Waste Masterplan Singapore. Available from: https://www.towardszerowaste.gov.sg.
    [4] Singapore Government (2021) Singapore Green Plan 2030. Available from: https://www.greenplan.gov.sg.
    [5] Ministry of the Environment and Water Resources (MEWR) (2023) GreenGov.SG Report for financial year 2022. Available from: https://www.mse.gov.sg/files/resources/greengovsg-report-fy2022.pdf.
    [6] Secretariat ASEAN (2021) Framework for circular economy for the ASEAN Economic Community. Available from: https://asean.org.
    [7] Department of Statistics Singapore (DOS) (2023) Population trends. Available from: https://www.singstat.gov.sg.
    [8] Hartmann D, Zagato L, Gala P, et al. (2021) Why did some countries catch-up, while others got stuck in the middle? Stages of productive sophistication and smart industrial policies. Struct Chang Econ Dyn 58: 1–13. https://doi.org/10.1016/j.strueco.2021.04.007 doi: 10.1016/j.strueco.2021.04.007
    [9] World Bank (2024) GDP per Capita (Current US$) Data—World Bank open data. Available from: https://data.worldbank.org/indicator/NY.GDP.PCAP.CD.
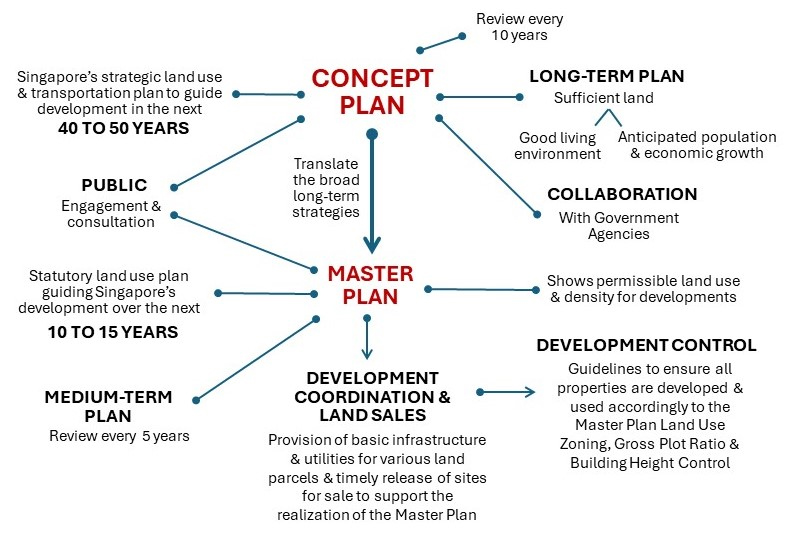
    [10] Urban Redevelopment Authority (URA) (2019) Master Plan 2019. Available from: https://www.ura.gov.sg/Corporate.
    [11] Housing and Development Board (HDB) (2019) Green Towns Programme. Available from: https://www.hdb.gov.sg.
    [12] Ministry of the Environment and Water Resources (MEWR), Ministry of National Development (MND) (2015) Sustainable Singapore Blueprint 2015. Available from: https://www.nccs.gov.sg.
    [13] Gaw LYF, Yee ATK, Richards DR (2019) A high-resolution map of Singapore's terrestrial ecosystems. Data 4: 116. https://doi.org/10.3390/data4030116 doi: 10.3390/data4030116
    [14] Richards DR, Edwards PJ (2017) Quantifying street tree regulating ecosystem services using Google Street View. Ecol Indic 77: 31–40. https://doi.org/10.1016/j.ecolind.2017.01.028 doi: 10.1016/j.ecolind.2017.01.028
    [15] Ministry of the Environment and Water Resources (MEWR) (1992) The Singapore Green Plan: Action Programmes.
    [16] Ministry of the Environment and Water Resources (MEWR) (2002) The Singapore Green Plan 2012.
    [17] Ministry of the Environment and Water Resources (MEWR) (2006) The Singapore Green Plan 2012, 2006 edition.
    [18] Ministry of the Environment and Water Resources (MEWR), and Ministry of National Development (MND) (2009) A lively and liveable Singapore: Strategies for sustainable growth. Available from: https://www.nccs.gov.sg.
    [19] Singapore Attorney General's Chambers (2021) Environmental Protection and Management Act 1999. Available from: https://sso.agc.gov.sg/act/epma1999.
    [20] United Nations, Paris Agreement, United Nations Climate Change, Twenty-first session of the Conference of the Parties, 2015. Available from: https://unfccc.int.
    [21] United Nations, Transforming our world: the 2030 Agenda for Sustainable Development, United Nations, General Assembly, Seventieth session, 2015. Available from: https://www.un.org/sustainabledevelopment.
    [22] Ministry of Sustainability and the Environment (MSE) (2020) Singapore's Climate Action Plan. Available from: https://www.mse.gov.sg/resources.
    [23] Singapore Attorney General's Chambers (2021) Resource Sustainability Act 2019. Available from: https://sso.agc.gov.sg/Act/RSA2019.
    [24] Iacovidou E, Hahladakis JN, Purnell P (2021) A systems thinking approach to understanding the challenges of achieving the circular economy. Environ Sci Pollut Res 28: 24785–24806. https://doi.org/10.1007/s11356-020-11725-9 doi: 10.1007/s11356-020-11725-9
    [25] National Environment Agency (NEA) (2023) Waste statistics and overall recycling. Available from: https://www.nea.gov.sg/our-services/waste-management/waste-statistics-and-overall-recycling.
    [26] Recycle Right Citizen's Workgroup (2019) Nine citizen proposals to improve household recycling in Singapore. Available from: https://www.towardszerowaste.gov.sg.
    [27] National Environment Agency (NEA) (2023) Chemical and Hazardous Waste—Basel Convention. Available from: https://www.nea.gov.sg.
    [28] National Environment Agency (NEA) (2019) Integrated Waste Management Facility (IWMF). Available from: https://www.nea.gov.sg/our-services/waste-management.
    [29] Tan E (2018) Enough trash talk, Singapore. It's time to stop passing the buck on plastics. Eco-Business. Available from: https://www.eco-business.com/opinion/enough-trash-talk-singapore-its-time-to-stop-passing-the-buck-on-plastics.
    [30] Singapore Environment Council (2018) Consumer plastic and plastic resource ecosystem in Singapore. Available from: https://sec.org.sg.
    [31] Deliveroo (2021) Food delivery platforms deliver more than just food; serves up happiness in a time of uncertainty. Available from: https://sg.deliveroo.news/news/food-delivery-survey-2021.html.
    [32] Singapore Management University (SMU) (2021) Takeaways beats deliver as preferred way to get food here. Available from: https://ise.smu.edu.sg/resources/press.
    [33] Elangovan N (2020) Singapore households generated additional 1334 tonnes of plastic waste during circuit breaker: Study. Available from: https://www.todayonline.com/singapore/singapore-households-generated-additional-1334-tonnes-plastic-waste-during-circuit-breaker.
    [34] Khoo HH (2019) LCA of plastic waste recovery into recycled materials, energy and fuels in Singapore. Resour Conserv Recycl 145: 67–77. https://doi.org/10.1016/j.resconrec.2019.02.010 doi: 10.1016/j.resconrec.2019.02.010
    [35] Wagner M, Monclús L, Arp HPH, et al. (2024) State of the science on plastic chemicals - Identifying and addressing chemicals and polymers of concern. Zenodo. Available from: http://dx.doi.org/10.5281/zenodo.10701706.
    [36] Nature (2022) How fast fashion can cut its staggering environmental impact. Nature 609: 653–654. https://doi.org/10.1038/d41586-022-02914-2 doi: 10.1038/d41586-022-02914-2
    [37] Agri-Food and Veterinary Authority of Singapore (AVA), National Environmental Agency (NEA) (2017) Food waste minimization guidebook for food retail and establishments. Available from: https://www.towardszerowaste.gov.sg/foodwaste.
    [38] Agri-Food and Veterinary Authority of Singapore (AVA), National Environmental Agency (NEA) (2017) Food waste minimization guidebook for supermarkets. Available from: https://www.towardszerowaste.gov.sg/foodwaste.
    [39] Agri-Food and Veterinary Authority of Singapore (AVA), National Environmental Agency (NEA) (2017) Food waste minimization guidebook for food manufacturing establishments. Available from: https://www.towardszerowaste.gov.sg/foodwaste.
    [40] National Environment Agency (NEA) (2017) Love your food—A handy guide to reducing food wastage and saving money. Available from: https://www.towardszerowaste.gov.sg/foodwaste.
    [41] National Environment Agency (NEA), Singapore's National Water Agency (PUB) (2019) Co-digestion of food waste and used water sludge enhanced biogas for greater energy generation. Available from: https://www.nea.gov.sg.
    [42] Singapore Food Agency (SFA) (2022) Singapore food statistics. Available from: https://www.sfa.gov.sg.
    [43] Deloitte (2019) Environmental impact of food in Singapore. Available from: https://www.ecosperity.sg/en/ideas/environmental-impact-of-food-in-singapore.html.
    [44] Li M, Jia N, Lenzen M, et al. (2022) Global food-miles account for nearly 20% of total food-systems emissions. Nat Food 3: 445–453. https://doi.org/10.1038/s43016-022-00531-w doi: 10.1038/s43016-022-00531-w
    [45] Ministry of Sustainability and the Environment (MSE) (2022) Key environmental statistics 2021. Available from: https://www.mse.gov.sg/resources.
    [46] Our World in Data (2023) Per capita consumption-based CO2 emissions—Global Carbon Project. Available from: https://ourworldindata.org/grapher/consumption-co2-per-capita.
    [47] Singapore Food Agency (SFA) Growing our food future, Annual Report 2020/21. Available from: https://www.sfa.gov.sg.
    [48] Goldstein Market Intelligence (2021) Singapore rice industry: market analysis, size, trends share, key players, demand & growth, by distribution channel with COVID-19 impact. Available from: https://www.goldsteinresearch.com/report/singapore-rice-industry-outlook.
    [49] Agri-Food and Veterinary Authority of Singapore (AVA) (2019) Staying true to our values, Annual Report 2018/2019. Available from: https://www.sfa.gov.sg.
    [50] IndexMundi (2022) Agriculture production, supply, and distribution. Available from: https://www.indexmundi.com/agriculture.
    [51] Hawes JK, Goldstein BP, Newell JP, et al. (2024) Comparing the carbon footprints of urban and conventional agriculture. Nat Cities 1: 164–173. https://doi.org/10.1038/s44284-023-00023-3 doi: 10.1038/s44284-023-00023-3
    [52] Shen Y, Ma K, Yue GH (2021) Status, challenges and trends of aquaculture in Singapore. Aquaculture 533: 736210. https://doi.org/10.1016/j.aquaculture.2020.736210 doi: 10.1016/j.aquaculture.2020.736210
    [53] Bianchi M, Hallström E, Parker RWR, et al. (2022) Assessing seafood nutritional diversity together with climate impacts informs more comprehensive dietary advice. Commun Earth Environ 3: 188. https://doi.org/10.1038/s43247-022-00516-4 doi: 10.1038/s43247-022-00516-4
    [54] Lim HS, Jiang J, Tan YW (2020) The Singapore aquaculture industry—contributing to Singapore's food security. Word Aquaculture Society Magazine. Available from: https://www.was.org/articles/The-Singapore-Aquaculture-Industry-Contributing-to-Singapores-Food-Security.aspx.
    [55] National Parks Board (NPark) (2017) Gardening with edibles. Available from: https://www.nparks.gov.sg/gardening/gardening-with-edibles.
    [56] 
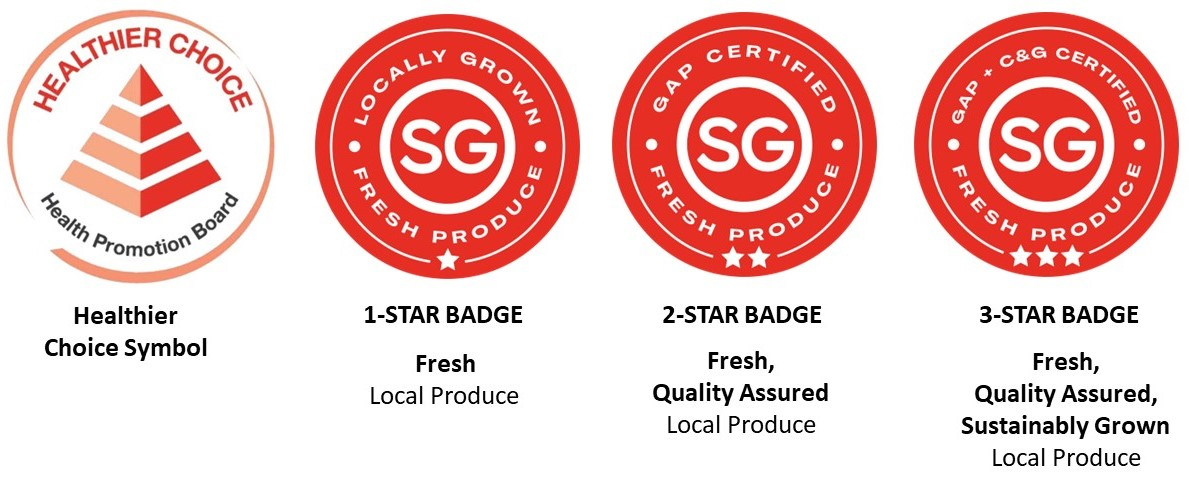
Camilleri AR, Larrick RP, Hossain S, et al. (2019) Consumers underestimate the emissions associated with food but are aided by labels. Nat Clim Chang 9: 53–58. https://doi.org/10.1038/s41558-018-0354-z doi: 10.1038/s41558-018-0354-z
    [57] Health Promotion Board (HPB) (2024) Healthier choice symbol. Available from: https://hpb.gov.sg/food-beverage/healthier-choice-symbol.
    [58] Chang Y (2015) Energy and environmental policy. Singapore Econ Rev 60: 1550039. https://doi.org/10.1142/S0217590815500393 doi: 10.1142/S0217590815500393
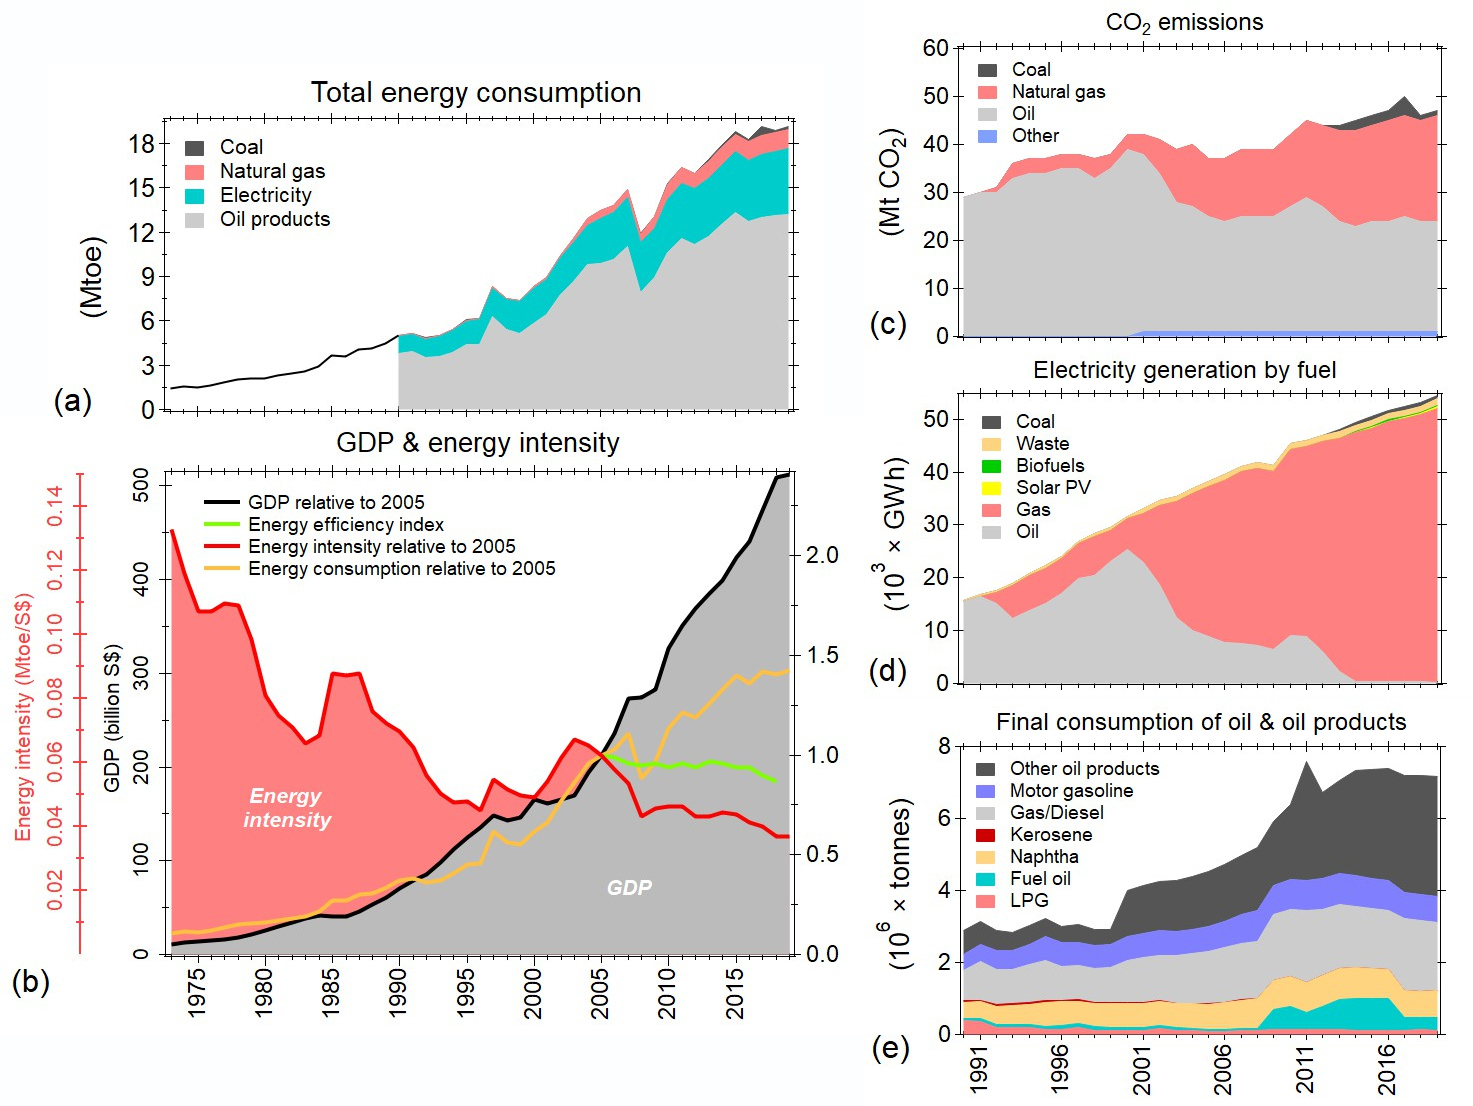
    [59] Energy Market Authority (EMA) (2023) Singapore energy statistics 2023. Available from: https://www.ema.gov.sg/singapore-energy-statistics.
    [60] Su B, Goh T, Ang BW, et al. (2022) Energy consumption and energy efficiency trends in Singapore: The case of a meticulously planned city. Energy Policy 161: 112732. https://doi.org/10.1016/j.enpol.2021.112732 doi: 10.1016/j.enpol.2021.112732
    [61] Department of Statistics Singapore (DOS) (2019) Report on the household expenditure survey 2017/18. Available from: https://www.singstat.gov.sg.
    [62] Ang BW, Goh T (2018) Bridging the gap between energy-to-GDP ratio and composite energy intensity index. Energy Policy: 119: 105–112. https://doi.org/10.1016/j.enpol.2018.04.038 doi: 10.1016/j.enpol.2018.04.038
    [63] National Environmental Agency (NEA) (2022) Singapore's fifth national communication and fifth biennial update report. Available from: https://www.nea.gov.sg/our-services/climate-change-energy-efficiency/climate-change/national-communications-and-biennial-update-reports.
    [64] Energy Market Authority (EMA) (2022) Beyond the current. Available from: https://www.beyondthecurrent.gov.sg.
    [65] Ye JY, Reindl T, Aberle AG, et al. (2014) Performance degradation of various PV module technologies in tropical Singapore. IEEE J Photovolt 4: 1288–1294. https://doi.org/10.1109/JPHOTOV.2014.2338051 doi: 10.1109/JPHOTOV.2014.2338051
    [66] Mekhilef S, Saidur R, Kamalisarvestani M (2012) Effect of dust, humidity, and air velocity on efficiency of photovoltaic cells. Renew Sustain Energy Rev 16: 2920–2925. https://doi.org/10.1016/j.rser.2012.02.012 doi: 10.1016/j.rser.2012.02.012
    [67] Solar Energy Research Institute of Singapore (SERIS) (2020) Update of the solar photovoltaic (PV) roadmap for Singapore. Available from: https://www.seris.nus.edu.sg.
    [68] Tan C (2018) Singapore could see 5,000 tonnes of solar panel waste in next 2 years. Straits Times. Available from: https://www.straitstimes.com/singapore/environment/singapore-could-see-5000-tonnes-of-solar-panel-waste-in-next-2-years.
    [69] Patil RA, Shabunko V, Ramakrishna S (2021) Renewable energy and circular economy: Application of life cycle costing to building integrated solar energy systems in Singapore, In: Liu, L., Ramakrishna, S. Author, An Introduction to Circular Economy, Singapore: Springer, 201–208. https://doi.org/10.1007/978-981-15-8510-4-11
    [70] Kosorić V, Lau SK, Tablada A, et al. (2018) General model of Photovoltaic (PV) integration into existing public high-rise residential buildings in Singapore—Challenges and benefits. Renew Sustain Energy Rev 91: 70–89. https://doi.org/10.1016/j.rser.2018.03.087 doi: 10.1016/j.rser.2018.03.087
    [71] Luo W, Khoo YS, Kumar A, et al. (2018) A comparative life-cycle assessment of photovoltaic electricity generation in Singapore by multicrystalline silicon technologies. Sol Energy Mater Sol Cells 174: 157–162. https://doi.org/10.1016/j.solmat.2017.08.040 doi: 10.1016/j.solmat.2017.08.040
    [72] Almeida RM, Schmitt R, Grodsky SM, et al. (2022) Floating solar power could help fight climate change—let's get it right. Nature 606: 246–249. https://doi.org/10.1038/d41586-022-01525-1 doi: 10.1038/d41586-022-01525-1
    [73] Public Utilities Board (PUB) Sustainability report FY2020/21. Available from: https://www.pub.gov.sg.
    [74] Sembcorp Energy Singapore (2022) Sembcorp Tengeh Floating Solar Farm. Available from: https://www.sembcorpenergy.com.sg.
    [75] Energy Market Authority (EMA) (2023) Our clean energy future. Available from: https://www.ema.gov.sg.
    [76] Energy Market Authority (EMA) (2022) Charting the energy transition to 2050. Available from: https://www.ema.gov.sg.
    [77] Wong R, Onn LP (2022) The intractable challenges facing energy trade in Southeast Asia. ISEAS Perspective 19. Available from: https://www.iseas.edu.sg/category/articles-commentaries/iseas-perspective.
    [78] Yong ML (2022) Transboundary environmental publics and hydropower governance in the Mekong River Basin: a contested politics of place, scale and temporality. Environ Policy Gov 32: 292–304. https://doi.org/10.1002/eet.1973 doi: 10.1002/eet.1973
    [79] Middleton C, Dore J (2015) Transboundary water and electricity governance in mainland Southeast Asia: Linkages, disjunctures and implications. Int J Water Gov 3: 93–120. https://doi.org/10.7564/14-IJWG54 doi: 10.7564/14-IJWG54
    [80] Ziv G, Baran E, Nam S, et al. (2012) Trading-off fish biodiversity, food security, and hydropower in the Mekong River Basin. Proc Natl Acad Sci 109: 5609–5614. https://doi.org/10.1073/pnas.120142310 doi: 10.1073/pnas.120142310
    [81] Pokhrel Y, Burbano M, Roush J, et al. (2018) A review of the integrated effects of changing climate, land use, and dams on Mekong River hydrology. Water 10: 266. https://doi.org/10.3390/w10030266 doi: 10.3390/w10030266
    [82] Hecht JS, Lacombe G, Arias ME, et al. (2019) Hydropower dams of the Mekong River basin: A review of their hydrological impacts. J Hydrol 568: 285–300. https://doi.org/10.1016/j.jhydrol.2018.10.045 doi: 10.1016/j.jhydrol.2018.10.045
    [83] Soukhaphon A, Baird IG, Hogan ZS (2021) The impacts of hydropower dams in the Mekong River Basin: A review. Water 13: 265. https://doi.org/10.3390/w13030265 doi: 10.3390/w13030265
    [84] International Renewable Energy Agency (IRENA) (2020) Green hydrogen cost reduction: Scaling up electrolysers to meet the 1.5 ℃ climate goal. Available from: https://www.irena.org.
    [85] Jain IP (2009) Hydrogen the fuel for 21st century. Int J Hydrog Energy 34: 7368–7378. https://doi.org/10.1016/j.ijhydene.2009.05.093 doi: 10.1016/j.ijhydene.2009.05.093
    [86] Edwards PP, Kuznetsov VL, David WIF, et al. (2008) Hydrogen and fuel cells: Towards a sustainable energy future. Energy Policy 36: 4356–4362. https://doi.org/10.1016/j.enpol.2008.09.036 doi: 10.1016/j.enpol.2008.09.036
    [87] Fernandez JR, Garcia S, Sanz-Perez ES (2020) CO2 capture and utilization editorial. Ind Eng Chem Res 59: 6767–6772. https://doi.org/10.1021/acs.iecr.0c01643 doi: 10.1021/acs.iecr.0c01643
    [88] Bui M, Adjiman CS, Bardow A, et al. (2018) Carbon capture and storage (CCS): the way forward. Energy Environ Sci 11: 1062–1176. https://doi.org/10.1039/C7EE02342A doi: 10.1039/C7EE02342A
    [89] Hand E (2023) Hidden hydrogen. Science 379: 630–636. https://doi.org/10.1126/science.adh1477 doi: 10.1126/science.adh1477
    [90] Energy Market Authority (EMA) (2022) Singapore's national hydrogen strategy. Available from: https://www.mti.gov.sg/Industries/Hydrogen.
    [91] Mazzucchi N (2022) Nuclear power can help the democratic world achieve energy independence. Nature 606: 841. https://doi.org/10.1038/d41586-022-01733-9 doi: 10.1038/d41586-022-01733-9
    [92] Singapore Attorney General's Chambers (2021) Energy Conservation Act 2013. Available from: https://sso.agc.gov.sg/Act/ECA2012.
    [93] National Environment Agency (NEA) (2022) Energy efficiency. Available from: https://www.nea.gov.sg/our-services/climate-change-energy-efficiency/energy-efficiency.
    [94] National Climate Change Secretariat (NCCS) (2022) Carbon tax. Available from: https://www.nccs.gov.sg/singapores-climate-action/mitigation-efforts/carbontax.
    [95] Building and Construction Authority (BCA) (2022) Green Mark 2021. Available from: https://www1.bca.gov.sg/buildsg/sustainability/green-mark-certification-scheme/green-mark-2021.
    [96] Building and Construction Authority (BCA) (2014) 3rd Green Building Masterplan. Available from: https://www1.bca.gov.sg.
    [97] Building and Construction Authority (BCA) (2021) Green Mark Incentive Schemes. Available from: https://www1.bca.gov.sg/buildsg/sustainability/green-mark-incentive-schemes.
    [98] Building and Construction Authority (BCA) (2021) Super Low Energy Programme. Available from: https://www1.bca.gov.sg/buildsg/sustainability/super-low-energy-programme.
    [99] Building and Construction Authority (BCA) (2021) Building Energy Benchmarking. Available from: https://www1.bca.gov.sg/buildsg/sustainability/regulatory-requirements-for-existing-buildings/bca-building-energy-benchmarking-and-disclosure.
    [100] Building and Construction Authority (BCA) (2021) Green Buildings Innovation Cluster Programme. Available from: https://www1.bca.gov.sg/buildsg/buildsg-transformation-fund/green-buildings-innovation-cluster-gbic-programme.
    [101] National Environmental Agency (NEA) (2019) Household energy consumption study 2017. Available from: https://www-nea-gov-sg-admin.cwp.sg/our-services/climate-change-energy-efficiency/energy-efficiency/household-sector/past-initiatives.
    [102] National Environmental Agency (NEA), Singapore's National Water Agency (PUB) (2021) Climate Friendly Households Programme. Available from: https://www.climate-friendly-households.gov.sg.
    [103] Energy Market Authority (EMA) (2019) Empowering households to be more energy efficient. Available from: https://www.ema.gov.sg.
    [104] Land Transport Authority (LTA) (2019) Land Transport Master Plan 2040. Available from: https://www.lta.gov.sg.
    [105] Department of Statistics Singapore (DOS) (2021) Census of Population 2020. Available from: https://www.singstat.gov.sg/publications/reference/cop2020/cop2020-sr2.
    [106] Land Transport Authority (LTA) (2018) Public consultations commence for the next Land Transport Plan. Available from: https://www.lta.gov.sg.
    [107] Land Transport Authority (LTA) (2013) Household interview travel survey 2012. Available from: https://www.lta.gov.sg.
    [108] Moovit (2023) Global public transport report 2022. Available from: https://moovitapp.com/insights.
    [109] Singapore Department of Statistics (2024) Transport statistics. Available from: https://www.singstat.gov.sg.
    [110] TomTom International BV (2022) Singapore traffic index. Available from: https://www.tomtom.com.
    [111] Velasco E (2021) Impact of Singapore's COVID-19 confinement on atmospheric CO2 fluxes at neighborhood scale. Urban Clim 37: 100822. https://doi.org/10.1016/j.uclim.2021.100822 doi: 10.1016/j.uclim.2021.100822
    [112] Milovanoff A, Minet L, Cheah L, et al. (2021) Greenhouse gas emission mitigation pathways for urban passenger land transport under ambitious climate targets. Environ Sci Technol 55: 8236–8246. https://doi.org/10.1021/acs.est.0c06671 doi: 10.1021/acs.est.0c06671
    [113] Ministry of Transport (2017) The future of your bus rides. Available from: https://www.mot.gov.sg.
    [114] Land Transport Authority (LTA) (2022) Annual Vehicle Statistics 2021. Available from: https://www.lta.gov.sg.
    [115] Land Transport Authority (LTA) (2023) Towards a green transport vision, LTA Sustainability Report 2022/23. Available from: https://www.lta.gov.sg.
    [116] Land Transport Authority (LTA) (2017) Completion of the Bus Service Enhancement Programme (BSEP). Available from: https://www.lta.gov.sg.
    [117] Public Transport Council (2018) International benchmarking study of public transport fares. Available from: https://www.ptc.gov.sg.
    [118] Public Transport Council (PTC) (2021) 2021 Fare review exercise. Available from: https://www.ptc.gov.sg.
    [119] Public Transport Council (PTC) (2023) Public transport customer satisfaction survey 2022. Available from: https://www.ptc.gov.sg.
    [120] Lim V, Lua E, Teo T (2023) The bright side of commuting: the impact of commute enjoyment on post-commute recovery and work. Acad Manage Proc 2023: 12676. https://doi.org/10.5465/AMPROC.2023.130bp doi: 10.5465/AMPROC.2023.130bp
    [121] Quirapas-Franco MA, Aboagye-Gyan R, Gul MF (2018) Sources, drivers and barriers of innovation in Singapore's Electronic Road Pricing. Asian J Public Aff 11: e3. http://dx.doi.org/10.18003/ajpa.201810 doi: 10.18003/ajpa.201810
    [122] Agarwal S, Koo KM (2016) Impact of electronic road pricing (ERP) changes on transport modal choice. Reg Sci Urban Econ 60: 1–11. https://doi.org/10.1016/j.regsciurbeco.2016.05.003 doi: 10.1016/j.regsciurbeco.2016.05.003
    [123] Chia NC, Phang SY (2001) Motor vehicle taxes as an environmental management instrument: the case of Singapore. Environ Econ Policy Stud 4: 67–93. https://doi.org/10.1007/BF03353917 doi: 10.1007/BF03353917
    [124] Land Transport Authority (LTA) (2021) Certificate of Entitlement (COE). Available from: https://onemotoring.lta.gov.sg.
    [125] Singapore Attorney General's Chambers (2022) Road Traffic (Motor Vehicles, Construction and Use) Rules 1999. Available from: https://sso.agc.gov.sg/SL/RTA1961-R9.
    [126] Centre for Livable Cities (2016) Creating livable cities through Car-Lite urban mobility. Available from: https://www.clc.gov.sg.
    [127] Land Transport Authority (LTA) (2020) Commencement if the new Point-to-Point transport regulatory framework. Available from: https://www.lta.gov.sg.
    [128] Land Transport Authority (LTA) (2021) Electric vehicles: our vision. Available from: https://www.lta.gov.sg/content/ltagov/en/industry_innovations/technologies/electric_vehicles.html.
    [129] Richter JL (2022) A circular economy approach is needed for electric vehicles. Nat Electron 5: 5–7. https://doi.org/10.1038/s41928-021-00711-9 doi: 10.1038/s41928-021-00711-9
    [130] Harper G, Sommerville R, Kendrick E, et al. (2019) Recycling lithium-ion batteries from electric vehicles. Nature 575: 75–86. https://doi.org/10.1038/s41586-019-1682-5 doi: 10.1038/s41586-019-1682-5
    [131] Tan SH, Roth M, Velasco E (2017) Particle exposure and inhaled dose during commuting in Singapore. Atmos Environ 170: 245–258. https://doi.org/10.1016/j.atmosenv.2017.09.056 doi: 10.1016/j.atmosenv.2017.09.056
    [132] Velasco E, Segovia E (2023) Effectiveness of equipping bus stop shelters with cooling and filtering systems in a city with tropical climate. Smart Sustain Built Environ 2023. https://doi.org/10.1108/SASBE-03-2023-0063 doi: 10.1108/SASBE-03-2023-0063
    [133] Velasco E, Segovia E (2021) Determining a commuters' exposure to particle and noise pollution on double-decker buses. Aerosol Air Qual Res 21: 210165. https://doi.org/10.4209/aaqr.210165 doi: 10.4209/aaqr.210165
    [134] Velasco E, Tan SH (2016) Particle exposure while sitting at bus stops of hot and humid Singapore. Atmos Environ 142: 251–263. https://doi.org/10.1016/j.atmosenv.2016.07.054 doi: 10.1016/j.atmosenv.2016.07.054
    [135] Harrison RM, Allan J, Carruthers D, et al. (2021) Non-exhaust vehicle emissions of particulate matter and VOC from road traffic: A review. Atmos Environ 262: 118592. https://doi.org/10.1016/j.atmosenv.2021.118592 doi: 10.1016/j.atmosenv.2021.118592
    [136] International Energy Agency (IEA) (2022) Global methane tracker 2022. Available from: https://www.iea.org/reports/global-methane-tracker-2022.
    [137] Mussetti G, Davin EL, Schwaab J, et al. (2022) Do electric vehicles mitigate urban heat? The case of a tropical city. Front Environ Sci 10: 810342. https://doi.org/10.3389/fenvs.2022.810342 doi: 10.3389/fenvs.2022.810342
    [138] Land Transport Authority (LTA) (2021) Walking and cycling infrastructure. Available from: https://www.lta.gov.sg.
    [139] National Parks Board (NParks) (2020) Know our recreational connectivity. Available from: https://www.nparks.gov.sg.
    [140] Centre for Liveable Cities (2021) Transport: overcoming constraints, sustaining mobility. Available from: https://www.clc.gov.sg.
    [141] Singapore Attorney General's Chambers (2018) Active Mobility Act 2017. Available from: https://sso.agc.gov.sg/SL/AMA2017-S251-2018.
    [142] Land Transport Authority (LTA) (2024) Rules and code of conduct. Available from: https://www.lta.gov.sg.
    [143] The Straits Times (2021) Cyclist versus pedestrians in battle of the sidewalks. Available from: https://www.straitstimes.com/singapore/battle-of-the-sidewalks-cyclists-versus-pedestrians.
    [144] Sport Singapore (2021) National Sports Participation Survey. Available from: https://data.gov.sg/dataset/top-sport-physical-activity-by-sg-residents-overall.
    [145] Land Transport Authority (LTA) (2018) LTA to commence license applications for bicycle-sharing operators. Available from: https://www.lta.gov.sg.
    [146] Ministry of Manpower (MOE) (2024) Foreign workforce numbers. Available from: https://www.mom.gov.sg.
    [147] Rice Media (2021) When will we start ferrying migrant workers like human beings?. Available from: https://www.ricemedia.co/author/wimby.
    [148] Infocom Media Development Authority (IMDA) (2016) Digitalization initiatives in support of the logistics industry transformation map. Available from: https://www.imda.gov.sg.
    [149] Infocom Media Development Authority (IMDA) (2020) Federated locker and collection points programme. Available from: https://www.imda.gov.sg.
    [150] Ernst and Young Advisory Pte. Ltd (2020) Study of the impact of industry 4.0 on Singapore's logistic workforce. Available from: https://www.ssg-wsg.gov.sg.
    [151] Carrière S, Weigend Rodríguez R, Pey P, et al. (2020) Circular cities: The case of Singapore. Built Environ Proj Asset Manag 10: 491–507. https://doi.org/10.1108/BEPAM-12-2019-0137 doi: 10.1108/BEPAM-12-2019-0137
    [152] A-Advantage Consulting (2018) Singapore national values assessment (NVA) 2018. Singapore: Lee Kuan Yew School of Public Policy. Available from: https://lkyspp.nus.edu.sg/docs/default-source/ips/nva-2018-press-release-(2018july30).pdf.
    [153] Smart Nation and Digital Government Office (SNDG), the Government Technology Agency (GovTech) (2019) Work-life harmony in Singapore. A Citizens' Panel Report. Available from: https://www.ideas.gov.sg.
    [154] The Straits Times (2021) Why are S'poreans waking up exhausted even after 7 hour of sleep?. Available from: https://www.straitstimes.com/life/getting-enough-rest-dont-just-sleep-on-it.
    [155] Visvalingam N, Sathish T, Soljak M, et al. (2020) Prevalence of and factors associated with poor sleep quality and short sleep in a working population in Singapore. Sleep Health 6: 277–287. https://doi.org/10.1016/j.sleh.2019.10.008 doi: 10.1016/j.sleh.2019.10.008
  • urs-02-02-007-s001.pdf
  • Reader Comments
  • © 2024 the Author(s), licensee AIMS Press. This is an open access article distributed under the terms of the Creative Commons Attribution License (http://creativecommons.org/licenses/by/4.0)
通讯作者: 陈斌, bchen63@163.com
  • 1. 

    沈阳化工大学材料科学与工程学院 沈阳 110142

  1. 本站搜索
  2. 百度学术搜索
  3. 万方数据库搜索
  4. CNKI搜索

Metrics

Article views(6752) PDF downloads(391) Cited by(0)

Other Articles By Authors

/

DownLoad:  Full-Size Img  PowerPoint
Return
Return

Catalog