Type 2 diabetes (T2D) is one of the top non-communicable diseases in Kenya and prevention strategies are urgently needed. Intervening to reduce obesity is the most common prevention strategy. However, black populations develop T2D at lower obesity levels and it is unclear which anthropometric cut-offs could provide the best predictive ability for T2D risk. This study, therefore, aimed to determine the optimal anthropometric cut-offs and their predictive ability of T2D in Kenya.
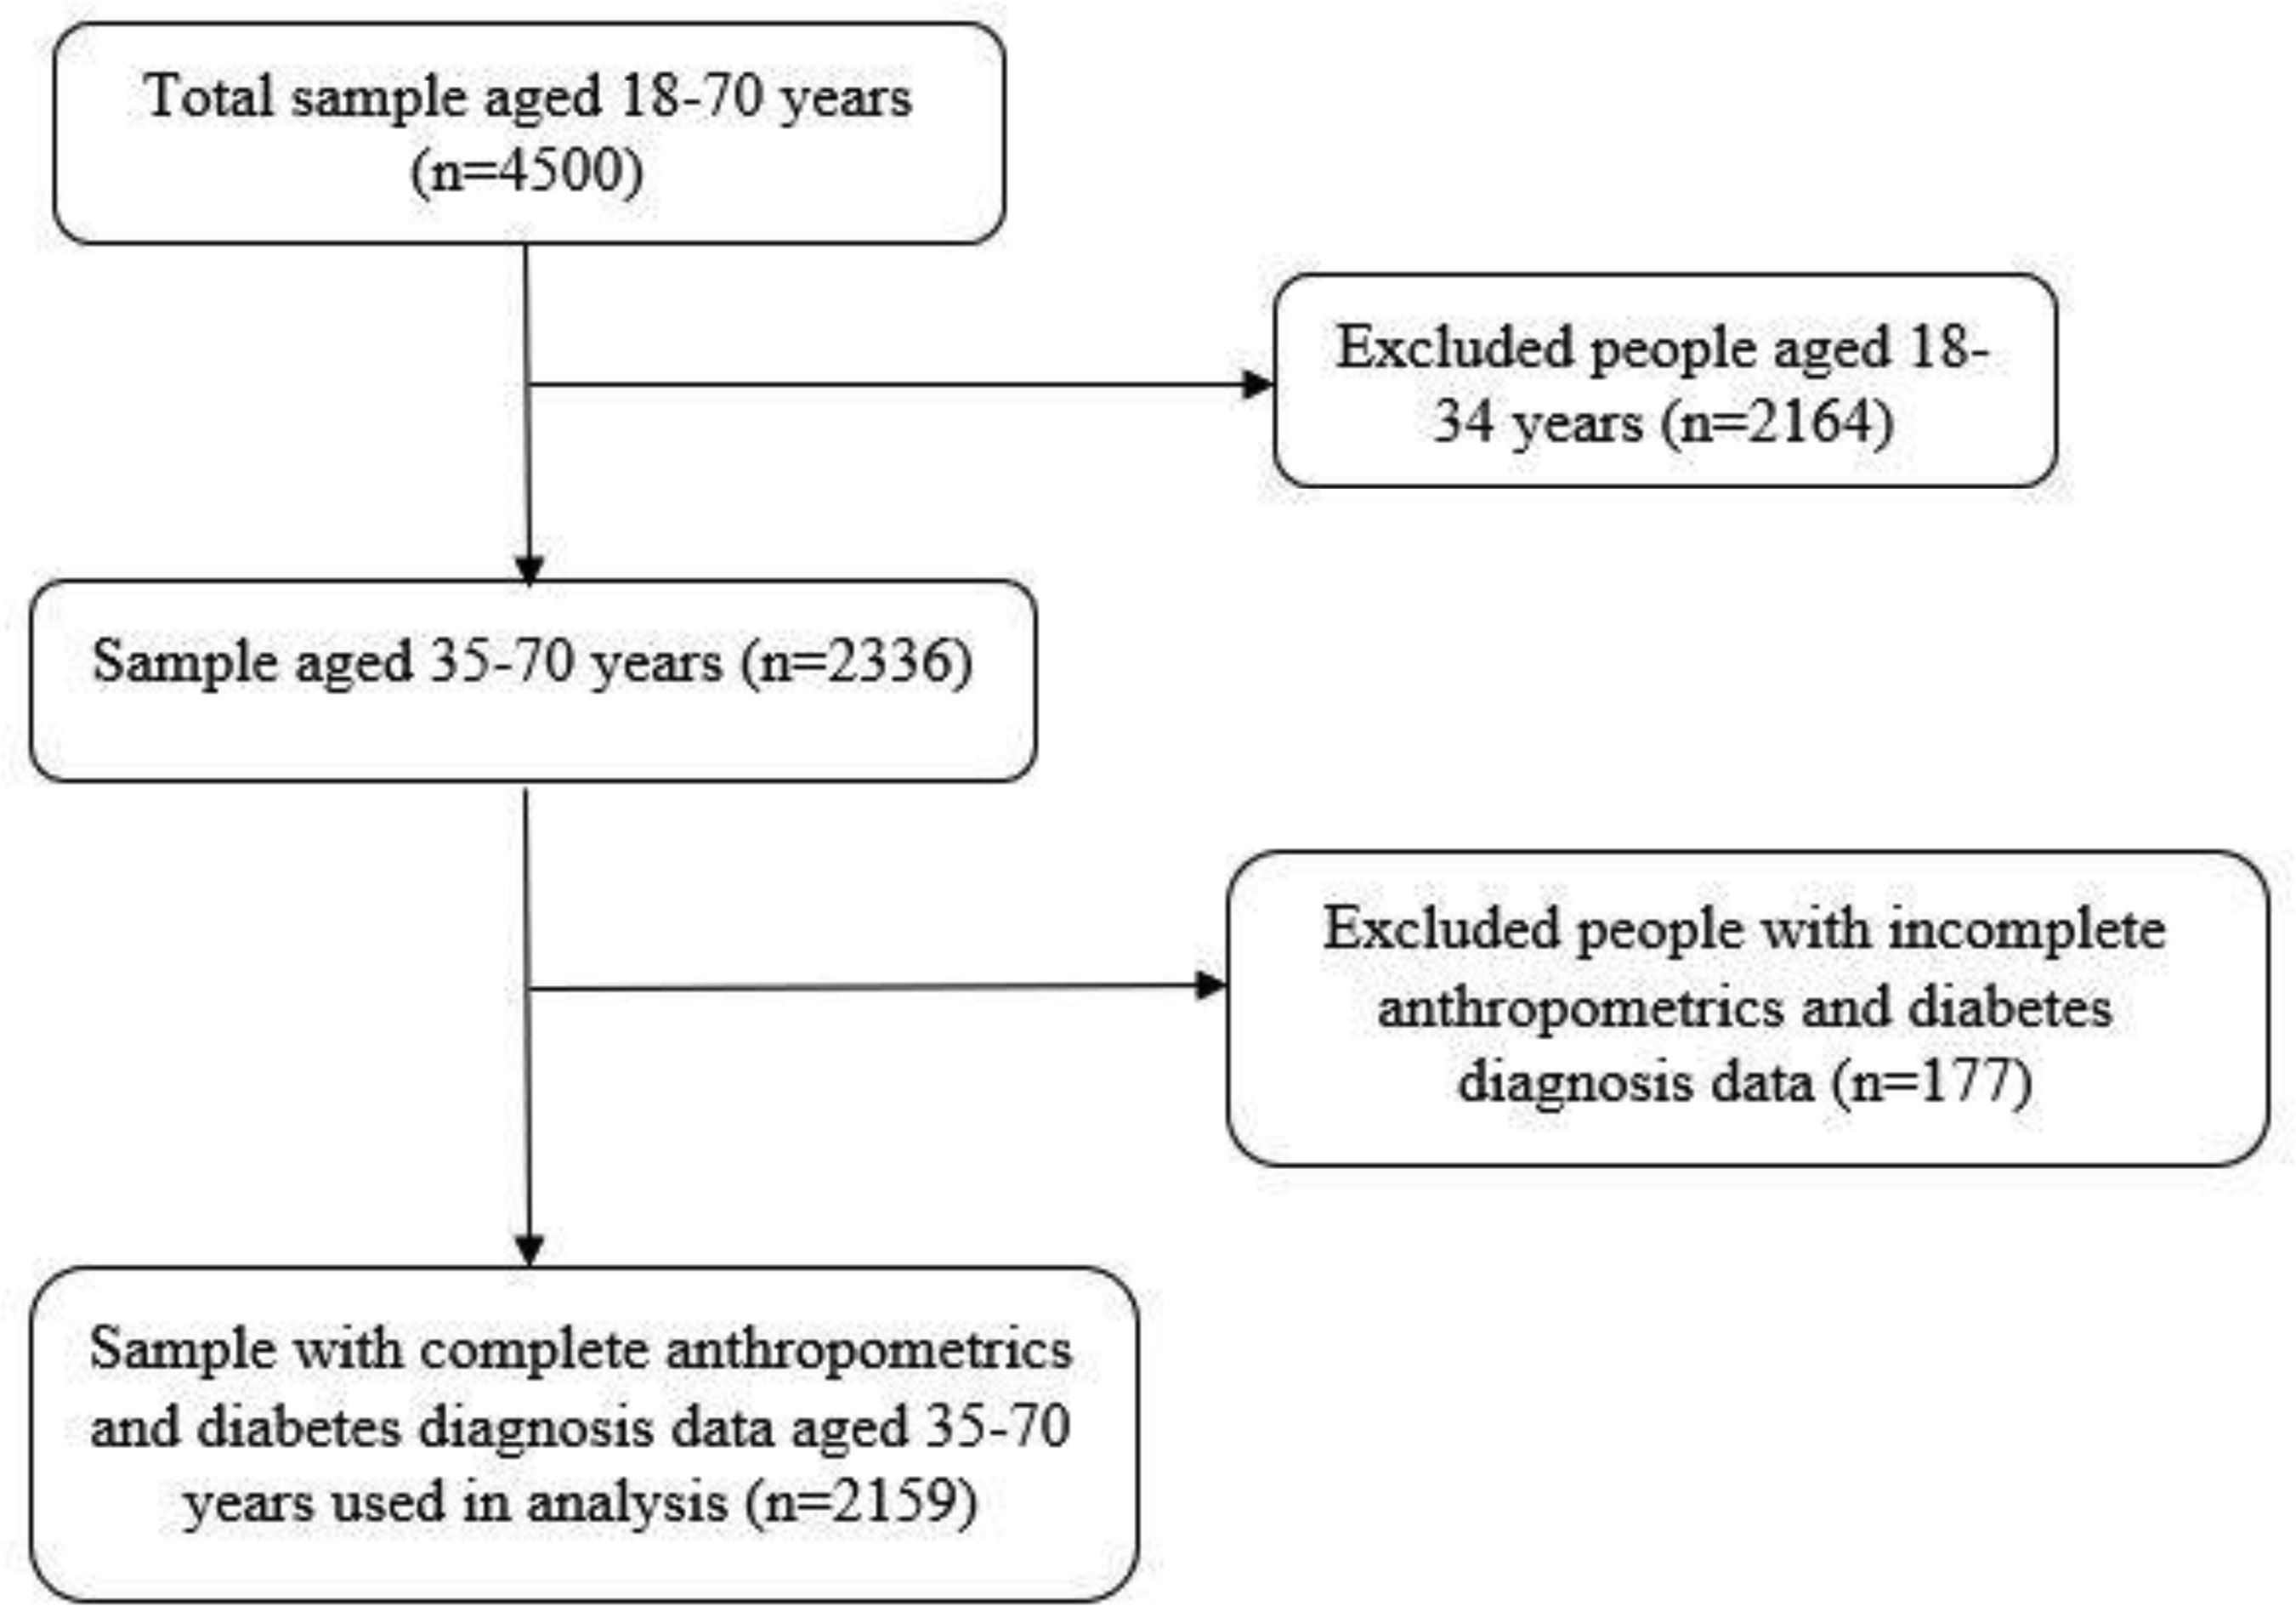
The study included 2159 participants (59% women) aged 35–70 years from the Kenya STEPwise survey conducted in 2014. Five anthropometric indices were used—body mass index (BMI), waist circumference (WC), waist to hip ratio (WHR), waist to height ratio (WHtR) and waist divided by height0.5(WHt.5R). Diabetes was defined as a fasting blood glucose of ≥7.0 mmol/l or a previous diagnosis by a health worker. Optimal anthropometric cut-offs and their receiver operating characteristics, such as the area under the curve (AUC), were computed.
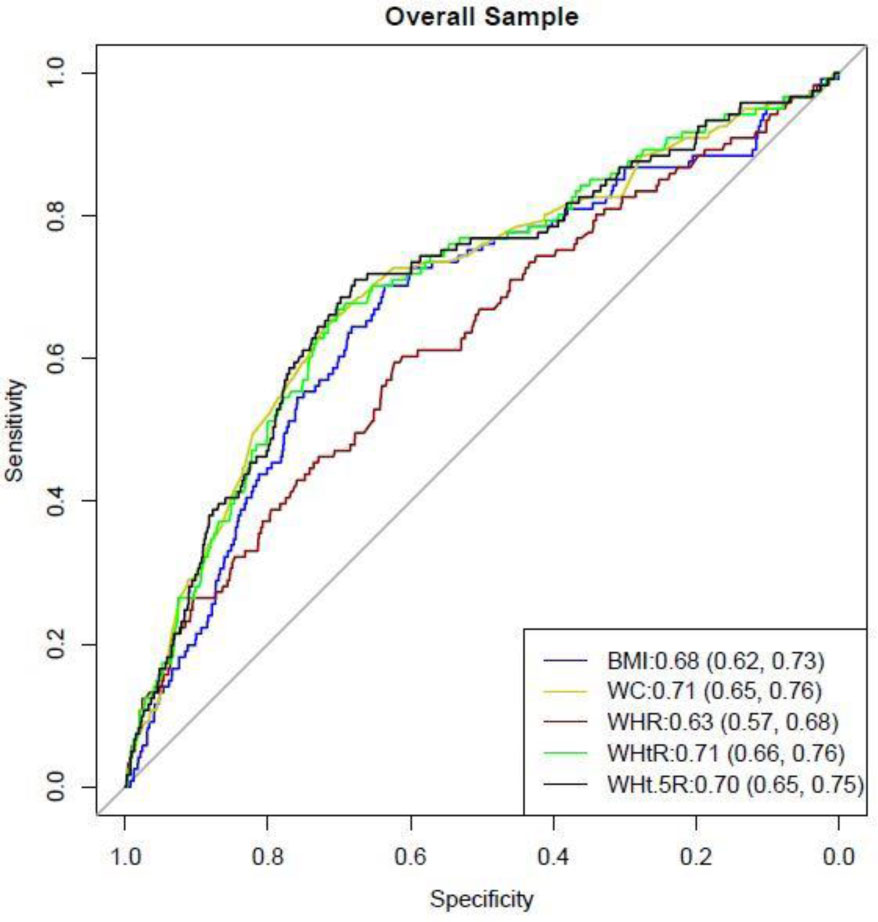
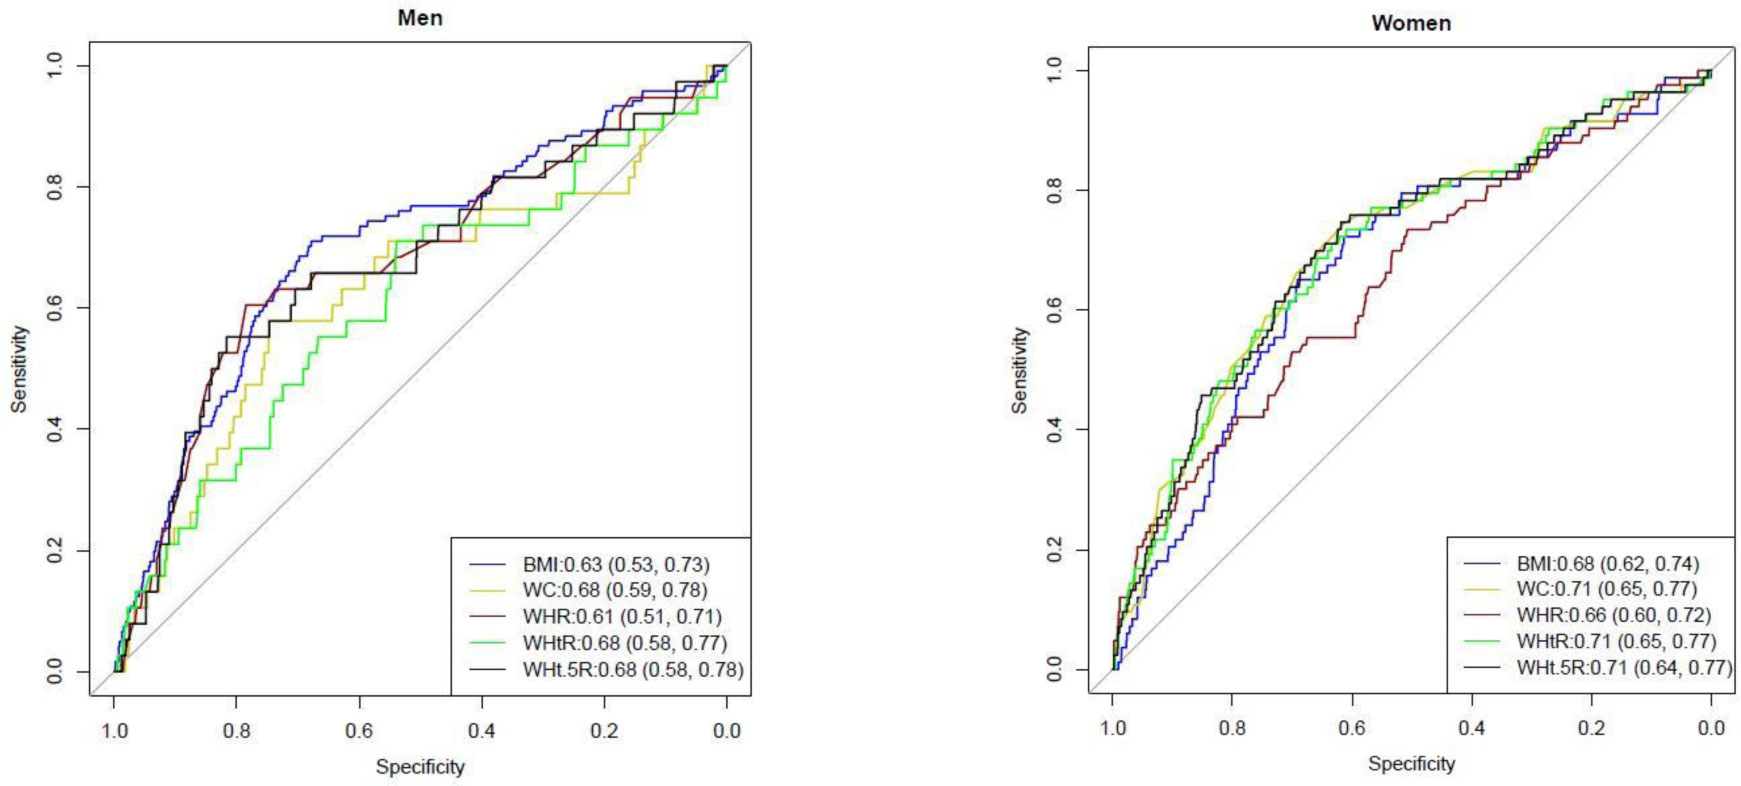
Overall, the optimal cut-off for BMI, WC, WHR, WHtR and WHt.5R were 24.8 kg.m−2, 90 cm, 0.88, 0.54 and 6.9. On disaggregation by sex, the optimal cut-off for BMI, WC, WHR WHtR and WHt.5R was 27.1 kg.m−2, 87 cm, 0.85, 0.55 and 6.9 in women, and 24.8 kg.m−2, 91 cm, 0.88, 0.54 and 6.9 in men. Overall, WC (AUC 0.71 (95% confidence interval 0.65, 0.76)) WHtR (AUC 0.71 (0.66, 0.76)) and WHt.5R (AUC 0.70 (0.65,0.75)) had a better predictive ability for T2D than BMI (AUC 0.68 (0.62, 0.73)).
WC, WHtR and WHt.5R were better predictors of T2D than BMI and should be used for risk stratification in Kenya. A WC cut-off of 87cm in women and 91cm in men, a WHtR cut-off of 0.54 or a WHt.5R of 6.9 in both men and women should be used to identify individuals at an elevated risk of T2D.
Citation: Anthony Muchai Manyara. Optimal cut-offs of five anthropometric indices and their predictive ability of type 2 diabetes in a nationally representative Kenyan study[J]. AIMS Public Health, 2021, 8(3): 507-518. doi: 10.3934/publichealth.2021041
Type 2 diabetes (T2D) is one of the top non-communicable diseases in Kenya and prevention strategies are urgently needed. Intervening to reduce obesity is the most common prevention strategy. However, black populations develop T2D at lower obesity levels and it is unclear which anthropometric cut-offs could provide the best predictive ability for T2D risk. This study, therefore, aimed to determine the optimal anthropometric cut-offs and their predictive ability of T2D in Kenya.
The study included 2159 participants (59% women) aged 35–70 years from the Kenya STEPwise survey conducted in 2014. Five anthropometric indices were used—body mass index (BMI), waist circumference (WC), waist to hip ratio (WHR), waist to height ratio (WHtR) and waist divided by height0.5(WHt.5R). Diabetes was defined as a fasting blood glucose of ≥7.0 mmol/l or a previous diagnosis by a health worker. Optimal anthropometric cut-offs and their receiver operating characteristics, such as the area under the curve (AUC), were computed.
Overall, the optimal cut-off for BMI, WC, WHR, WHtR and WHt.5R were 24.8 kg.m−2, 90 cm, 0.88, 0.54 and 6.9. On disaggregation by sex, the optimal cut-off for BMI, WC, WHR WHtR and WHt.5R was 27.1 kg.m−2, 87 cm, 0.85, 0.55 and 6.9 in women, and 24.8 kg.m−2, 91 cm, 0.88, 0.54 and 6.9 in men. Overall, WC (AUC 0.71 (95% confidence interval 0.65, 0.76)) WHtR (AUC 0.71 (0.66, 0.76)) and WHt.5R (AUC 0.70 (0.65,0.75)) had a better predictive ability for T2D than BMI (AUC 0.68 (0.62, 0.73)).
WC, WHtR and WHt.5R were better predictors of T2D than BMI and should be used for risk stratification in Kenya. A WC cut-off of 87cm in women and 91cm in men, a WHtR cut-off of 0.54 or a WHt.5R of 6.9 in both men and women should be used to identify individuals at an elevated risk of T2D.
Body Mass Index
Waist Circumference
Waist-to-Height Ratio
Waist-to-Hip Ratio
waist divided by height0.5
Receiver Operating Curve
Type 2 Diabetes
Area Under the Curve
Sub-Saharan Africa
Confidence Intervals
Standard Deviation
World Health Organisation

| [1] |
Pastakia SD, Pekny CR, Manyara SM, et al. (2017) Diabetes in sub-Saharan Africa–from policy to practice to progress: targeting the existing gaps for future care for diabetes. Diabet Metab Synd Ob 10: 247. doi: 10.2147/DMSO.S126314

|
| [2] |
Dunkley AJ, Bodicoat DH, Greaves CJ, et al. (2014) Diabetes Prevention in the Real World: Effectiveness of Pragmatic Lifestyle Interventions for the Prevention of Type 2 Diabetes and of the Impact of Adherence to Guideline Recommendations. Diabetes Care 37: 922-933. doi: 10.2337/dc13-2195
|
| [3] |
Bellou V, Belbasis L, Tzoulaki I, et al. (2018) Risk factors for type 2 diabetes mellitus: An exposure-wide umbrella review of meta-analyses. PloS One 13: e0194127. doi: 10.1371/journal.pone.0194127
|
| [4] |
Nuttall FQ (2015) Body Mass Index: Obesity, BMI, and Health: A Critical Review. Nutr Today 50: 117-128. doi: 10.1097/NT.0000000000000092
|
| [5] |
Sattar N, Gill JMR (2014) Type 2 diabetes as a disease of ectopic fat? BMC Med 12: 123. doi: 10.1186/s12916-014-0123-4
|
| [6] |
Ashwell M, Gunn P, Gibson S (2012) Waist-to-height ratio is a better screening tool than waist circumference and BMI for adult cardiometabolic risk factors: systematic review and meta-analysis. Obes Rev 13: 275-286. doi: 10.1111/j.1467-789X.2011.00952.x
|
| [7] |
Nevill AM, Duncan MJ, Lahart IM, et al. (2017) Scaling waist girth for differences in body size reveals a new improved index associated with cardiometabolic risk. Scand J Med Sci Sports 27: 1470-1476. doi: 10.1111/sms.12780
|
| [8] |
Baldé NM, Diallo I, Baldé MD, et al. (2007) Diabetes and impaired fasting glucose in rural and urban populations in Futa Jallon (Guinea): prevalence and associated risk factors. Diabetes Metab 33: 114-120. doi: 10.1016/j.diabet.2006.10.001
|
| [9] |
Frank LK, Heraclides A, Danquah I, et al. (2013) Measures of general and central obesity and risk of type 2 diabetes in a Ghanaian population. Trop Med Int Health 18: 141-151. doi: 10.1111/tmi.12024
|
| [10] |
Haregu TN, Oti S, Egondi T, et al. (2016) Measurement of overweight and obesity an urban slum setting in sub-Saharan Africa: a comparison of four anthropometric indices. BMC Obes 3: 46. doi: 10.1186/s40608-016-0126-0
|
| [11] |
Mbanya V, Kengne A, Mbanya J, et al. (2015) Body mass index, waist circumference, hip circumference, waist–hip-ratio and waist–height-ratio: Which is the better discriminator of prevalent screen-detected diabetes in a Cameroonian population? Diabetes Res Clin Pract 108: 23-30. doi: 10.1016/j.diabres.2015.01.032
|
| [12] |
Tesfaye T, Shikur B, Shimels T, et al. (2016) Prevalence and factors associated with diabetes mellitus and impaired fasting glucose level among members of federal police commission residing in Addis Ababa, Ethiopia. BMC Endocr Disord 16: 68. doi: 10.1186/s12902-016-0150-6
|
| [13] |
Woldegebriel AG, Fenta KA, Aregay AB, et al. (2020) Effectiveness of Anthropometric Measurements for Identifying Diabetes and Prediabetes among Civil Servants in a Regional City of Northern Ethiopia: A Cross-Sectional Study. J Nutr Metab 2020: 8425912. doi: 10.1155/2020/8425912
|
| [14] | Mayige M (2014) Derivation and validation of a simple risk score for undiagnosed diabetes for Tanzania and other African populations: Newcastle University . |
| [15] |
Ntuk UE, Gill JM, Mackay DF, et al. (2014) Ethnic-specific obesity cutoffs for diabetes risk: cross-sectional study of 490,288 UK biobank participants. Diabetes Care 37: 2500-2507. doi: 10.2337/dc13-2966
|
| [16] | Division of Non Communicable diseases Kenya STEPwise survey for non-communicable diseases risk factors 2015 report (2015) .Available from: https://www.health.go.ke/wp-content/uploads/2016/04/Steps-Report-NCD-2015.pdf. |
| [17] | Suastika K, Dwipayana P, Semadi MS, et al. (2012) Age is an important risk factor for type 2 diabetes mellitus and cardiovascular diseases. Glucose Tolerance 67-80. |
| [18] |
Diaz-Valencia PA, Bougnères P, Valleron AJ (2015) Global epidemiology of type 1 diabetes in young adults and adults: a systematic review. BMC Public Health 15: 255. doi: 10.1186/s12889-015-1591-y
|
| [19] | WHO Obesity: preventing and managing the global epidemic: World Health Organization (2000) .Available from: https://apps.who.int/iris/handle/10665/42330. |
| [20] | WHO Definition and diagnosis of diabetes mellitus and intermediate hyperglycaemia: report of a WHO/IDF consultation (2006) .Available from: https://apps.who.int/iris/handle/10665/43588. |
| [21] | Bunn A, Korpela M An Introduction to dplR (2019) .Available from: http://r.meteo.uni.wroc.pl/web/packages/dplR/vignettes/intro-dplR.pdf. |
| [22] | López Ratón M, Rodríguez Álvarez MX, Cadarso Suárez CM, et al. OptimalCutpoints: an R package for selecting optimal cutpoints in diagnostic tests; 2014 American Statistical Association, Available from: https://www.jstatsoft.org/article/view/v061i08. |
| [23] | Robin X, Turck N, Hainard A, et al. (2021) Display and Analyze ROC Curves. Package ‘pROC’ Available from: https://cran.r-project.org/web/packages/pROC/pROC.pdf. |
| [24] |
Kibirige D, Lumu W, Jones AG, et al. (2019) Understanding the manifestation of diabetes in sub Saharan Africa to inform therapeutic approaches and preventive strategies: a narrative review. Clin Diabetes Endocrinol 5: 2. doi: 10.1186/s40842-019-0077-8
|
| [25] | WHO Waist circumference and waist-hip ratio: report of a WHO expert consultation, Geneva, 8-11 December 2008 (2011) .Available from: https://www.who.int/publications/i/item/9789241501491. |
| [26] |
Lee MJ, Wu Y, Fried SK (2013) Adipose tissue heterogeneity: implication of depot differences in adipose tissue for obesity complications. Mol Aspects Med 34: 1-11. doi: 10.1016/j.mam.2012.10.001
|
| [27] |
Ekoru K, Murphy G, Young E, et al. (2018) Deriving an optimal threshold of waist circumference for detecting cardiometabolic risk in sub-Saharan Africa. Int J Obes 42: 487-494. doi: 10.1038/ijo.2017.240
|
| [28] |
Ashwell M, Gibson S (2014) A proposal for a primary screening tool: ‘Keep your waist circumference to less than half your height’. BMC Med 12: 207. doi: 10.1186/s12916-014-0207-1
|
| [29] |
Ashwell M, Gibson S (2016) Waist-to-height ratio as an indicator of ‘early health risk’: simpler and more predictive than using a ‘matrix’ based on BMI and waist circumference. BMJ Open 6: e010159. doi: 10.1136/bmjopen-2015-010159
|
| [30] |
Ashwell M, Hsieh SD (2005) Six reasons why the waist-to-height ratio is a rapid and effective global indicator for health risks of obesity and how its use could simplify the international public health message on obesity. Int J Food Sci Nutr 56: 303-307. doi: 10.1080/09637480500195066
|
| [31] |
Caleyachetty R, Barber TM, Mohammed NI, et al. (2021) Ethnicity-specific BMI cutoffs for obesity based on type 2 diabetes risk in England: a population-based cohort study. Lancet Diabetes Endocrinol 9: 419-426. doi: 10.1016/S2213-8587(21)00088-7
|
| [32] |
Darko SN, Meeks KAC, Owiredu WKBA, et al. (2021) Anthropometric indices and their cut-off points in relation to type 2 diabetes among Ghanaian migrants and non-migrants: The RODAM study. Diabetes Res Clin Pract 173: 108687. doi: 10.1016/j.diabres.2021.108687
|
Figures(3) / Tables(3)

Anthony Muchai Manyara. Optimal cut-offs of five anthropometric indices and their predictive ability of type 2 diabetes in a nationally representative Kenyan study[J]. AIMS Public Health, 2021, 8(3): 507-518. doi: 10.3934/publichealth.2021041


 DownLoad: