Research article
Special Issues
Nutritional Status and Obesity Prevalence in People with Gender Dysphoria
-
1.
Biomedical Science Department, Alcala University, Alcalá de Henares, Madrid 28806, Spain;
-
2.
Nutrition Department, Guadalajara Campus, Valle de Atemajac University, Guadalajara 28014, Mexico;
-
3.
Endocrinology and Nutrition, Gender Unit, Ramón y Cajal Hospital, Madrid 28806, Spain
-
Received:
20 May 2014
Accepted:
28 July 2014
Published:
06 August 2014
-
-
-
-
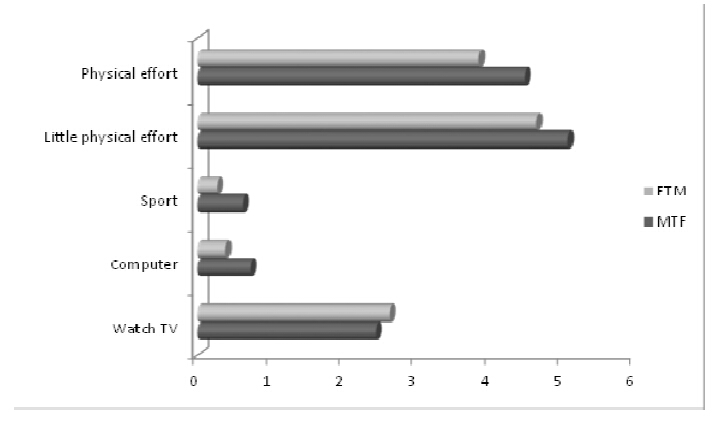
Gender dysphoria is a condition that involves a failure to adapt and a body dissatisfaction that makes these individuals especially susceptible to eating disorders. The aim of this paper was to ascertain the nutritional status, dietary behaviour and lifestyle and their effect on overweight/obesity prevalence of the people with gender dysphoria.Methods: A longitudinal study on 157 individuals from the Gender Disorder Unit at the Ramón y Cajal Hospital (Madrid) who are undergoing hormonal treatment has been carried out. Usual dietary intake, physical activity habits and socioeconomic parameters were evaluated. The anthropometric parameters determined were weight, height, body-mass index (BMI), waist and hip circumference and body fat content. Results: The mean of the population eats a large number of servings of food, which leads to high levels of energy intake: 3,614.32 ± 1,314 kcal/day. These intakes are related to the physical activity performed. The average diet among this population is unbalanced, with a high consumption of fats, especially saturated fats and cholesterol. The breakfast is skipped by 16% of the population. Together with cross-hormone treatment, this dietary habitsand lifestylelead to an increase in body fat, especially in the female to male group whose overweight andobesity prevalence increase (22.72% vs 34.85%). Conclusion: This population suffers a change of their nutritional status due to a variation in their eating behaviour and lifestyle. This increase in the obesity prevalencemake it susceptible to chronic diseases and cardiovascular disorders. It is therefore necessary to include nutrition education courses in the comprehensive treatment programme (anatomical, psychological, etc.) for these individuals.
Citation: MaríaVictorinaAguilarVilas, GabrielaRubalcava, AntonioBecerra, MaríaCarmenMartínezPara. Nutritional Status and Obesity Prevalence in People with Gender Dysphoria[J]. AIMS Public Health, 2014, 1(3): 137-146. doi: 10.3934/publichealth.2014.3.137
-
Abstract
Gender dysphoria is a condition that involves a failure to adapt and a body dissatisfaction that makes these individuals especially susceptible to eating disorders. The aim of this paper was to ascertain the nutritional status, dietary behaviour and lifestyle and their effect on overweight/obesity prevalence of the people with gender dysphoria.Methods: A longitudinal study on 157 individuals from the Gender Disorder Unit at the Ramón y Cajal Hospital (Madrid) who are undergoing hormonal treatment has been carried out. Usual dietary intake, physical activity habits and socioeconomic parameters were evaluated. The anthropometric parameters determined were weight, height, body-mass index (BMI), waist and hip circumference and body fat content. Results: The mean of the population eats a large number of servings of food, which leads to high levels of energy intake: 3,614.32 ± 1,314 kcal/day. These intakes are related to the physical activity performed. The average diet among this population is unbalanced, with a high consumption of fats, especially saturated fats and cholesterol. The breakfast is skipped by 16% of the population. Together with cross-hormone treatment, this dietary habitsand lifestylelead to an increase in body fat, especially in the female to male group whose overweight andobesity prevalence increase (22.72% vs 34.85%). Conclusion: This population suffers a change of their nutritional status due to a variation in their eating behaviour and lifestyle. This increase in the obesity prevalencemake it susceptible to chronic diseases and cardiovascular disorders. It is therefore necessary to include nutrition education courses in the comprehensive treatment programme (anatomical, psychological, etc.) for these individuals.

References
|
[1]
|
Gómez E, Gil JM, Nogués P, et al. (2001) Trastorno de la identidad sexual: Aspectos epidemiológicos, sociodemográficos, psiquiátricos y evolutivos.C Med Psicosom 58: 76-83.
|
|
[2]
|
Becerra A. (2002) Trastornos de Identidad de Género, guía clínica para el diagnóstico y tratamiento.Endocrinol Nutr 50: 19-33.
|
|
[3]
|
Asscheman H, Gooren LJ, Eklund PL. (1989) Mortality and morbidity in transsexual patients with cross-gender hormone treatment.Metabolism 38: 869-873.
|
|
[4]
|
Gomez CC, Loria KV, Lourenco NT. (2007) Guía visual de alimentos y raciones.n: SENBA. Madrid. .
|
|
[5]
|
World Health Organization. (2004) Appropriate body-mass index for Asian populations and its implications for policy and intervention strategies.Geneva: WHO. .
|
|
[6]
|
World Health Organization. (1995) Physical status: the use and interpretation of anthropometry.WHO technical report series. Geneva: WHO, 854.
|
|
[7]
|
Moreiras O, Carbajal A, Cabrera L, et al. (2011) Tablas de composición de alimentos.Madrid: Pir&# 225.
|
|
[8]
|
SENC. Sociedad Española de Nutrición Comunitaria.Available from: http: //www. nutricioncomunitaria. org/generica. jsp?tipo=docu&id=2. .
|
|
[9]
|
FAO/WHO. (2003) Diet, nutrition and the prevention of chronic diseases.Report of a Joint FAO/WHO Expert Consultation. WHO technical report series. Geneve: WHO, 916.
|
|
[10]
|
Elbers JMH, Asscheman H, Seidell JC, et al. (1997) Long-term testosterone administration increases visceral fat in female to male transsexuals.J Clin Endocrinol Metab 82: 2044-2047.
|
|
[11]
|
Menéndez I. (2006) Alimentación emocional. La relación entre nuestras emociones y los conflictos con la comida.Barcelona: Grijalbo. 243.
|
|
[12]
|
Sivakami S, Veena KV. (2011) Assessment nutritional status and imparting diet counseling on selected transgenders in Coimbatore city.Asian J Sci Tech 2: 9-15.
|
|
[13]
|
del Pozo S, García V, Cuadrado C, et al. (2012) Valoración Nutricional de la dieta española de acuerdo al Panel de Consumo.Alimentario. Madrid: FEN. .
|
|
[14]
|
Aguilar MV. (2005) Alimentos cardiosaludables y antioxidantes: la dieta mediterránea. In: Becerra A, Síndrome metabólico. Obesidad, diabetes, resistencia insulínica y riesgo cardiovascular..Madrid: Línea de Comunicación 237: 319-332.
|
|
[15]
|
Farmen GW, Jabson JM, Buchoiz KK, et al. (2013) A population-based study of cardiovascular disease risk in sexual-minority women.Am J Public Health 103: 1845-1850.
|
-
-
-
-


 DownLoad: