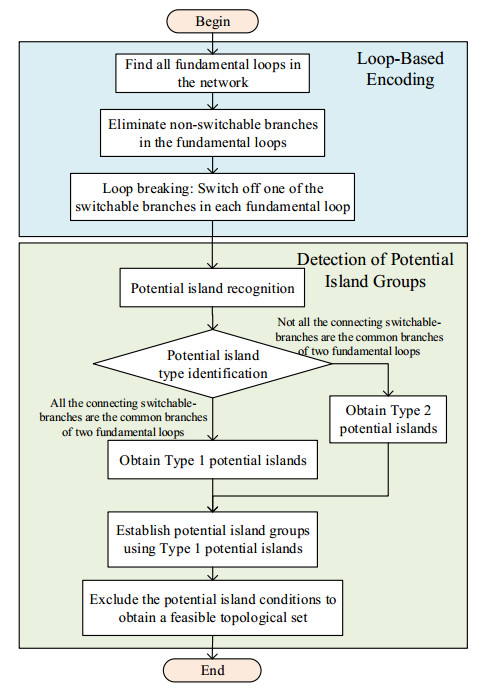
Figure 1.
Algorithm flow for generating feasible topology sets.


Citation: Teresia Mbogori, Kilee Kimmel, Mengxi Zhang, Jay Kandiah, Youfa Wang. Nutrition transition and double burden of malnutrition in Africa: A case study of four selected countries with different social economic development[J]. AIMS Public Health, 2020, 7(3): 425-439. doi: 10.3934/publichealth.2020035
| [1] | Abdollah Kavousi-Fard, Amin Khodaei . Multi-objective optimal operation of smart reconfigurable distribution grids. AIMS Energy, 2016, 4(2): 206-221. doi: 10.3934/energy.2016.2.206 |
| [2] | Md Mashud Hyder, Kaushik Mahata . Reconfiguration of distribution system using a binary programming model. AIMS Energy, 2016, 4(3): 461-480. doi: 10.3934/energy.2016.3.461 |
| [3] | Shijian Chen, Yongquan Zhou, Qifang Luo . Hybrid adaptive dwarf mongoose optimization with whale optimization algorithm for extracting photovoltaic parameters. AIMS Energy, 2024, 12(1): 84-118. doi: 10.3934/energy.2024005 |
| [4] | Amandeep Gill, Pushpendra Singh, Jalpa H. Jobanputra, Mohan Lal Kolhe . Placement analysis of combined renewable and conventional distributed energy resources within a radial distribution network. AIMS Energy, 2022, 10(6): 1216-1229. doi: 10.3934/energy.2022057 |
| [5] | Jinhua Tian, Yueyuan Zhang, Yanan Gao, Yu Qin, Bihan Fan, Cheng Zhang, Qiqi Zang . Distributed optimization and scheduling strategy for source load storage distribution grid based on alliance chain. AIMS Energy, 2024, 12(5): 946-967. doi: 10.3934/energy.2024044 |
| [6] | Gerardo Guerra, Juan A. Martinez-Velasco . Optimal sizing and operation of energy storage systems considering long term assessment. AIMS Energy, 2018, 6(1): 70-96. doi: 10.3934/energy.2018.1.70 |
| [7] | Mohamed G Moh Almihat, MTE Kahn . Centralized control system for islanded minigrid. AIMS Energy, 2023, 11(4): 663-682. doi: 10.3934/energy.2023033 |
| [8] | Mikaeel Ahmadi, Mir Sayed Shah Danish, Mohammed Elsayed Lotfy, Atsushi Yona, Ying-Yi Hong, Tomonobu Senjyu . Multi-objective time-variant optimum automatic and fixed type of capacitor bank allocation considering minimization of switching steps. AIMS Energy, 2019, 7(6): 792-818. doi: 10.3934/energy.2019.6.792 |
| [9] | Feng Tian . A wind power prediction model with meteorological time delay and power characteristic. AIMS Energy, 2025, 13(3): 517-539. doi: 10.3934/energy.2025020 |
| [10] | Tung-Sheng Zhan, Yih-Der Lee, Jheng-Lun Jiang . Optimal OCR coordination in a high penetration distribution power system using a refined immune algorithm with an auto-tuning reproductive mechanism. AIMS Energy, 2024, 12(6): 1225-1263. doi: 10.3934/energy.2024056 |
As the electric power system undergoes rapid evolution, it is imperative to acknowledge that traditional models predominantly reliant on fossil-fueled power generation may no longer effectively address the escalating demand for sustainable development. This is especially evident in regions with limited access to fossil energy resources, underscoring the imperative to shift towards renewable energy sources [1,2,3]. A new paradigm in the form of integrating distributed renewable energy sources into the grid has emerged as a prominent trend in the evolution of electrical networks. However, the significant influx of DG into distribution grids has led to an increasingly intricate network structure. Although, this complexity has brought forth a set of new challenges, including increased peak-to-valley differentials, reverse power flows, and the heightened prominence of issues related to voltage quality and network losses [4,5,6].
To enhance the security and cost-efficiency of distribution systems, network reconfiguration is gaining prominence. Network reconfiguration is an approach aimed at optimizing the operational performance of the electrical grid by altering its structure [7]. On one hand, network reconfiguration can mitigate issues such as voltage and current overloads by modifying the grid structure, thereby enhancing the reliability of the power system. On the other hand, it can optimize current and voltage distribution, leading to reduced network losses and improved economic performance in grid operations.
In recent years, scholars have conducted extensive researches on the optimization methods for the distribution network reconfiguration.
Literature [8] proposes a cyclic encoding and decoding algorithm based on the distribution network (DN) for effectively finding the global optimal configuration in any DN. The encoding algorithm, composed of cyclic searches, systematically organizes the DN and significantly reduces the search space for the distribution network reconfiguration problem. Literature [9] introduces an improved Equilibrium Optimization Algorithm (IEOA) combined with a proposed recovery strategy for the optimal allocation of multiple distributed generators in the distribution network. The recovery strategy is enhanced for more effective exploration of the solution space during iterations. Literature [10] compares the proposed Harris's Hawk Optimization (HHO) algorithm with two related metaheuristic techniques, Particle Swarm Optimization and the Cuckoo Search algorithm, showing that HHO outperforms the other two optimizers in power loss minimization, voltage profile enhancement, and runtime. Literature [11] presents an efficient mathematical model for distribution network reconfiguration loss minimization that considers the system's voltage profile. This model can be solved using commercially available solvers. The application of this model to multiple test systems and real distribution networks demonstrates its efficiency and effectiveness for distribution system reconfiguration. Literature [12] introduces an efficient and robust technique based on the Jellyfish Search Algorithm (JFSA) to minimize losses and reduce emissions to a maximum extent under typical daily load conditions. Literature [13] introduces a novel framework for microgrid scheduling and distribution feeder reconfiguration (DFR) considering load demand, market prices, and the uncertainties brought by renewable energy generation. Literature [14] proposes an approach based on the Equilibrium Optimization (EO) algorithm for the optimization integration of photovoltaics and Battery Energy Storage (BES) in radial distribution networks. Comparative performance analysis is carried out with Genetic Algorithms (GA), the EO algorithm, Particle Swarm Optimization (PSO), Differential Evolution (DE), and Grey Wolf Optimization (GWO). Literature [15] presents an improved Wild Horse Optimization algorithm (IWHO) as a novel metaheuristic approach for solving power system optimization problems. It demonstrates high performance in exploration-exploitation balance and convergence speed, effectively handling complex problems. Literature [16] introduces an optimization framework for Distribution Network Reconfiguration (DNR) based on deep learning to enhance system reliability. The optimization problem is formulated with an objective function minimizing average curtailed power. Literature [17] proposes an enhanced Marine Predators Algorithm (IMPA) for controlling reactive power by optimizing the placement and sizing of shunt capacitors (SC) and determining the Power Factor (PF) of Distributed Generators (DG). The algorithm's efficiency and scalability are demonstrated on standard test systems with 69 and 118 buses. Literature [18] introduces a Discrete-Continuous Genetic Algorithm to solve mixed-integer nonlinear programming models arising from classical power balance issues. Numerical validations conducted on 33 radial feeders and meshed feeders show the method's effective reduction of operational costs. Literature [19] investigates the load pattern's impact on the sequences of the switching to show the load profile's influence on minimization of energy losses in DNR. Literature [20] proposes a network reconfiguration and DG allocation method to reduce network losses in the presence of variable loads. Literature [21] presents the network reconfiguration optimization model considering the voltage dependency of loads, which is able to be solved by linear solvers. Literature [22] presents a distribution systems reconfiguration model considering load's dependencies on environment temperature, and the optimization model can be solved by linear solvers in commercial optimization software.
However, there is still room for improvement in the generation of feasible topology sets and solution algorithms in the above-mentioned methods.
1) In terms of feasible topology set generation, most of the methods [1,15,23,24,25] employ Loop-Based Encoding to generate the required feasible topology sets for distribution network reconfiguration. While Loop-Based Encoding can, to some extent, mitigate the presence of radial networks, it cannot entirely eliminate islands. When infeasible topologies are introduced into the optimization model, it inevitably impacts both the efficiency and effectiveness of the solution.
2) Regarding algorithmic solutions, solving the power equations in distribution networks involves non-linear equations, making network reconfiguration optimization a complex non-linear optimization problem [26]. Traditional non-linear optimization algorithms are intricate in terms of parameter tuning and often susceptible to getting trapped in local optima. Hence, there is a need for further algorithmic enhancements to address these issues.
To address the aforementioned issues, this paper presents a distribution network reconfiguration optimization method that combines the identification of islanding in undirected graphs with the whale optimization algorithm (WOA). Leveraging the categorization of island types in undirected graphs, a set of feasible network topologies was established, and the WOA was employed to optimize the network topology. The novelties and contributions of this article can be summarized as follows:
1) We have proposed a feasible topology set generation method based on undirected-graph potential island detection. The island categories were determined based on the type of switchable-branches connected to the islands, and potential island groups were constructed accordingly. In accordance with the conditions for island formation, infeasible topologies were eliminated, thus forming a feasible topology set.
2) We have developed a WOA-based distribution network reconfiguration method using the feasible topology set. The optimal topology for the distribution network was determined using the WOA on the foundation of constructing the optimization model.
The remainder of this paper is structured as follows: Section 2 introduces the method for generating a feasible topology set based on potential island groups detection. Section 3 details the distribution network reconfiguration optimization method employing the WOA. Section 4 presents the case study, and Section 5 concludes the paper.
Distribution network reconfiguration entails finding the optimal topology from a set of feasible topologies for a distribution network. Given that distribution networks must adhere to radial constraints during operation, the generation of feasible topology sets should also take into account radial network structures. Although traditional loop-based encoding can to some extent prevent the existence of closed loops, it does not completely eliminate islanding. Therefore, in this paper, a feasible topology set generation method based on the detection of potential island groups is proposed to exclude infeasible topologies that contain isolated clusters, thus ensuring the feasibility of all topologies within the set.
Building upon loop-based encoding, this paper incorporates a graph theory-based islanding detection method to eliminate all potential topologies that may result in islanding, ensuring that the generated set of feasible distribution network topologies strictly adheres to radial constraints. Specifically, this method comprises two main steps: loop-based encoding and the graph theory-based potential island groups detection. The overall methodology framework is illustrated in Figure 1.
The objective of the loop-based encoding method is to identify the fundamental loops within the distribution network and disconnect one branch from each loop, effectively achieving the "breaking" of loops and eliminating the presence of the loop network.
Using the 7-node example system depicted in Figure 2, the method for generating feasible topological sets will be explained. This system consists of a total of 7 nodes and 9 branches, labeled as b1–b9. Three of these branches, namely, b1, b3, and b7, are designated as non-switchable branches, while the remaining branches are categorized as switchable branches. Analyzing the topological structure presented in Figure 2 reveals the presence of three fundamental loops, as follows:

● Loop 1: Including branches b1, b2, b3, and b4.
● Loop 2: Including branches b3, b4, b5, b6, and b9.
● Loop 3: Including branches b2, b5, b6, b7, and b8.
Considering that the non-switchable branches b1, b3, and b7 do not modify the topological loop characteristics, these branches can be omitted from the fundamental loops under consideration. As a result, the three fundamental loops can be further simplified to:
● Loop 1: Including branches b2 and b4.
● Loop 2: Including branches b4, b5, b6, and b9.
● Loop 3: Including branches b2, b5, b6, and b8.
Subsequently, each fundamental loop is disrupted by disconnecting one switchable branch from each. Branches b2, b9, and b8 are chosen for disconnection in Loop 1, Loop 2, and Loop 3, resulting in the radial topology shown in Figure 3(a).

Although the "loop-breaking" process disrupts all fundamental loops, it does not prevent the formation of isolated islands. For instance, disconnecting branches b2, b4, and b5 within Loop 1, Loop 2, and Loop 3 results in the creation of an island consisting of nodes 3 and 4, as seen in Figure 3(b). Alternatively, disconnecting branches b2, b4, and b6 within the same loops generates an island comprising nodes 3, 4, and 5, as shown in Figure 3(c). To eliminate infeasible topologies leading to such islands, a graph-theoretical approach for potential island groups detection must be employed.
Before excluding infeasible topologies that contain islands, it is essential to find all potential island groups—these are sets of graphs that emerge when any combination of switchable branches is disconnected in the network.
Taking the 7-node system as an example, there are a total of four potential island groups. These island groups are named after the nodes they contain, namely Nodes 3-4, Nodes 3-4-5, Node 5, and Node 6, as illustrated in Figure 4. Disconnecting all switchable branches connected to a potential island will trigger the formation of that island.

However, the formation of islands is not exclusively determined by the connection of switchable branches to the islands but also by the type of switchable branches. The switchable branches linked to islands can be classified into two categories: one type comprises branches shared by adjacent pairs of fundamental loops, typically situated in the central region of the network. The other type comprises branches shared by non-fundamental loops, typically found at the network's periphery. Depending on the type of switchable branches connected to potential islands, potential islands can be categorized into two groups:
Type 1 potential island: All switchable branches connected to Type 1 potential islands are common branches shared by two fundamental loops.
Type 2 potential island: Switchable branches connected to Type 2 potential islands include at least one branch that is not a common branch shared by two fundamental loops.
Using the 7-node system as an example, the two types of potential islands have been listed in Table 1.
| Potential island types | Contained nodes | Switchable branches connecting the potential islands | Types of switchable branches connecting the potential islands |
| Type 1 | Nodes 3-4 | b2, b4, b5 | All the switchable branches are the common branches of two fundamental loops |
| Nodes 3-4-5 | b2, b4, b6 | ||
| Node 5 | b5, b6 | ||
| Type 2 | Node 6 | b6, b8, b9 | Some of the switchable branches (b8 and b9) are NOT the common branches of two fundamental loops |
 DownLoad:
CSV
DownLoad:
CSV
Type 2 potential islands, located at the network's periphery, have more switchable branches connected to them than the adjacent fundamental loops. As a result, loop-based encoding ensures that Type 2 potential islands do not form isolated islands. On the contrary, Type 1 potential islands cannot guarantee the avoidance of island formation and collectively form the potential island group.
To obtain the set of feasible topologies, it is necessary to eliminate scenarios where Type 1 potential islands result in island formation. This involves excluding situations where all branches linked to Type 1 potential islands are disconnected. Building upon the principles of loop-based encoding and incorporating these conditions to prevent potential islands, a feasible set of distribution network reconfigurations T = {T1, T2, …, TN} is obtained.
Distribution network reconfiguration optimization involves selecting the most suitable topology while ensuring optimal performance in terms of power losses, voltage constraints, and other metrics. Given the feasible topology set T = {T1, T2, …, TN} obtained through graph-theoretical island group detection, the goal of network reconfiguration is to choose an appropriate topology, Ti (i = 1, 2, …, N), from this set. The aim is to achieve the best possible optimization results while adhering to the specified constraints [27].
1) Constraints
The constraints in distribution network reconfiguration mainly include power balance constraints, branch power limits, and upper and lower voltage deviation limit constraints. The power balance constraints can be expressed as:
| {Pi=Uin∑j=0Uj(Gijcos(δi−δj)+Bijsin(δi−δj))Qi=Uin∑j=0Uj(Gijsin(δi−δj)−Bijcos(δi−δj)) | (1) |
where Pi and Qi are the active and reactive power injections at node i, Ui is the voltage magnitude at node i, δi and δj are the phase angles of the voltage at nodes i and j, and Gij and Bij are the real and imaginary parts of the element in the admittance matrix at row i and column j, with n representing the number of nodes in the distribution network.
The branch power limit constraint can be represented as:
| −Pijmax⩽Pij⩽Pijmax | (2) |
where Pij max is the power limit of the branch between nodes i and j, and Pij is the branch power, it can be represented as:
| Pij=UiUj(Gijcos(δi−δj)+Bijsin(δi−δj)) | (3) |
The upper and lower voltage deviation limit constraints can be represented as:
| Uimin⩽Ui⩽Uimax | (4) |
where Ui min and Ui max are respectively the lower and upper limits of the nodal voltage Ui.
2) Optimization objective
The optimization objective for distribution network reconfiguration takes into account minimizing the network loss cost, where the network loss cost cl can be obtained by summing the injected power at each node.
| cl=n∑i=1Pi | (5) |
To solve the constrained optimization problem, this paper utilizes a penalty function approach to establish the optimization objective. Among the constraints provided in (1)–(4), constraints (1) and (3) are equality constraints that have already been taken into account during the power flow calculation process. However, constraints (2) and (4) are inequality constraints and are incorporated into the objective function using a penalty function [28]. The penalty function, denoted as cp, can be expressed as follows:
| cp=ω1n∑i=1ΔUi+ω2n−1∑i=1n∑j=i+1ΔPij | (6) |
where ΔUi represents the excess portion of nodal voltage Ui, ΔPij represents the excess portion of branch power Pij, ω1 and ω2 are weight coefficients, which are typically chosen to be relatively large values.
ΔUi can be calculated as follows:
| ΔUi={Ui−UimaxUi>Uimax0Uimin⩽Ui⩽UimaxUimin−UiUi<Uimin | (7) |
ΔPij can be calculated as follows:
| ΔPij={Pij−PijmaxPij>Pijmax0−Pijmax⩽Pij⩽Pijmax−Pijmax−PijPij<−Pijmax | (8) |
Based on Eqs (5) and (6), the final optimization objective can be established as follows:
| Min cl+cp | (9) |
By introducing both network loss cost cl and penalty function cp in the optimization objective, both economic efficiency and operational reliability can be supported. The optimization model provided in Eqs (6)–(9) can be solved through the use of the WOA.
WOA is a nature-inspired optimization technique that mimics the social behavior of humpback whales. The flowchart of the WOA is shown in Figure 5. It begins with the initialization of a population of potential solutions of the network topology Ti, representing the position of whales in the search space. Then, the fitness of each solution is evaluated using the objective function (9), and the whale with the best fitness is selected as the leader whale.

During the algorithm's iterations, whales move toward a randomly chosen "prey" position based on their current location and a set of predefined equations that model the whales' encircling and bubble-net attacking behaviors. This process continues iteratively, gradually converging towards an optimal solution.
The algorithm stops when a termination condition is met, such as a maximum number of iterations or reaching a satisfactory solution quality. Throughout the process, the best solution of the distribution network topology Ti is retained as the final result.
The IEEE 33-node distribution network system was used herein to verify the effectiveness of the proposed method, as shown in Figure 6. The system comprises 33 nodes, 23 non-switch branches, and 14 switchable branches equipped with controllable switches. The switch branches are denoted as b4, b7, b9, b14, b18, b20, b23, b27, b32, b33, b34, b35, b36, and b37. Nodes 6 and 33 are connected with DG. Distribution network reconfiguration can be achieved by controlling the switch states of these switchable branches [29].

In the IEEE 33-node system, five fundamental loops can be identified. After excluding the non-switch branches from the fundamental loops, five simplified fundamental loops can be further derived. The branches contained in the five complete fundamental loops and the simplified fundamental loops are listed in Table 2.
| Branches | ||
| Fundamental loops | Loop 1 | b3, b4, b5, b22, b23, b24, b25, b26, b27, b28, b37 |
| Loop 2 | b6, b7, b8, b15, b16, b17, b25, b26, b27, b28, b29, b30, b31, b32, b34, b36 | |
| Loop 3 | b9, b10, b11, b12, b13, b14, b34 | |
| Loop 4 | b2, b3, b4, b5, b6, b7, b18, b19, b20, b33 | |
| Loop 5 | b8, b9, b10, b11, b21, b33, b35 | |
| Simplified fundamental loops | Loop 1 | b4, b23, b27, b37 |
| Loop 2 | b7, b27, b32, b34, b36 | |
| Loop 3 | b9, b14, b34 | |
| Loop 4 | b4, b7, b18, b20, b33 | |
| Loop 5 | b9, b33, b35 | |
DownLoad:
CSV
To further identify different types of potential islands, it is necessary to distinguish the types of switchable branches into common branches and non-common branches of fundamental loops. The classification outcomes are displayed in Table 3.
| Branches | |
| Common branches of fundamental loops | b4, b7, b9, b27, b33, b34 |
| Non-common branches of fundamental loops | b14, b18, b20, b23, b32, b35, b36, b37 |
DownLoad:
CSV
Classification of potential islands in the 33-node system can be further conducted based on the types of switchable branches, as illustrated in Table 4 and Figure 7. A comparison between Table 4 and Figure 7 indicates that all switch branches linked to Type 1 potential islands are common branches of the fundamental loops. By excluding situations where all branches connected to Type 1 potential islands are disconnected, the feasible topology set T for distribution network reconfiguration is obtained. This set comprises a total of 552 feasible topologies. If the proposed potential island detection method is not employed to eliminate infeasible topologies, there could be up to 214 = 16,384 possible topologies. Thus, it can be seen that the proposed method significantly reduces the solution space for distribution network reconfiguration, thereby achieving the goal of reducing computational workload.
| Potential island types | Contained nodes | Switchable branches connecting the potential islands | Fundamental loops' non-common branches connecting the potential islands |
| Type 1 | Nodes 5-6-7-26-27 | b4, b7, b27 | / |
| Nodes 5-6-7-8-9-26-27 | b4, b9, b27, b33, b34 | ||
| Nodes 8-9 | b7, b9, b33, b34 | ||
| Type 2 | Nodes 10-11-12-13-14 | b9, b14, b35 | b14, b35 |
| Nodes 15-16-17-18 | b14, b34, b36 | b14, b36 | |
| Nodes 19-20 | b18, b20 | b18, b20 | |
| Nodes 21-22 | b20, b33, b35 | b20, b35 | |
| Nodes 24-25 | b23, b37 | b23, b37 | |
| Nodes 28-29-30-31-32 | b27, b32, b37 | b32, b37 | |
| Node 33 | b32, b36 | b32, b36 |
DownLoad:
CSV

In the following case study, the WOA is used to optimize the topology of the 33-node system. For comparative analysis, four optimization methods, including PSO, SA, GA, and WOA (the proposed method), are considered for distribution network topology optimization, and the results are compared.
When not considering DG integration, the results of distribution network reconfiguration optimization are shown in Table 5, Figures 8 and 9. Table 5 lists the switchable-branch states obtained using different methods, along with the statistical analysis of network loss and average voltage deviation. Figure 8 provides the topological structure of the distribution network under four different methods, while Figure 9(a) presents the iterative convergence curve of the fitness value for the WOA method, and Figure 9(b) offers a comparison of node voltages between the results obtained by the WOA and the other three methods. From Table 5, Figures 8 and 9, it can be observed that the WOA effectively optimizes the network topology, resulting in the best topology. The optimization results obtained by the WOA (the proposed method) are capable of reducing network loss and average voltage deviation to a greater extent when compared to PSO, SA, and GA methods. Quantitatively, the WOA (the proposed method) has a network loss that is 0.030 MW less than PSO. When computed at an electricity rate of 140 $/MWh, the WOA saves $100.8 in electricity costs per day compared to PSO.
| Method | On/off state of the switchable branches | Network loss (MW) |
Average voltage deviation (p.u.) | |||||||||||||
| b4 | b7 | b9 | b14 | b18 | b20 | b23 | b27 | b32 | b33 | b34 | b35 | b36 | b37 | |||
| PSO | 1 | 1 | 1 | 1 | 1 | 1 | 1 | 1 | 0 | 0 | 0 | 0 | 0 | 0 | 0.132 | 0.040 |
| SA | 0 | 0 | 0 | 1 | 1 | 1 | 1 | 1 | 1 | 1 | 0 | 1 | 0 | 1 | 0.119 | 0.037 |
| GA | 1 | 1 | 1 | 0 | 0 | 1 | 1 | 0 | 1 | 0 | 1 | 1 | 0 | 1 | 0.155 | 0.047 |
| WOA | 1 | 0 | 0 | 1 | 1 | 1 | 1 | 1 | 1 | 1 | 0 | 1 | 0 | 0 | 0.102 | 0.029 |
DownLoad:
CSV


In the subsequent analysis, DG is integrated into the distribution network, where nodes 6 and 33 are assumed to be connected to a DG of 0.4 and 0.5 MW, and the results of distribution network reconfiguration optimization are presented in Table 6, Figures 10 and 11. It is evident from the presented data that the inclusion of DG has a discernible impact on the optimization outcomes compared to scenarios where DG is not considered. DG integration results in a modest elevation of terminal line voltages, contributing to a partial reduction in network losses and mitigating voltage deviations. However, it is notable that some optimization methods, notably PSO and GA, do not demonstrate substantial reductions in network losses and voltage deviations through distribution network reconfiguration, particularly in contrast to cases without DG. In contrast, the utilization of the WOA leads to significantly lower network losses and voltage deviations when compared to the other methodologies, exceeding the performance of PSO, SA, and GA. This verifies the superior efficacy of the WOA (the proposed method) in the context of distribution network reconfiguration, particularly when DG integration is a factor. In terms of quantity, WOA has a network loss that is 0.195 MW less than PSO. If calculated at an electricity price of 140 $/MWh, WOA saves $655.2 in electricity costs per day compared to PSO. This represents a significant cost reduction.
| Method | On/off state of the switchable branches | Network loss (MW) |
Average voltage deviation (p.u.) | |||||||||||||
| b4 | b7 | b9 | b14 | b18 | b20 | b23 | b27 | b32 | b33 | b34 | b35 | b36 | b37 | |||
| PSO | 0 | 0 | 1 | 0 | 1 | 0 | 1 | 1 | 1 | 0 | 1 | 1 | 1 | 1 | 0.296 | 0.096 |
| SA | 0 | 0 | 0 | 1 | 1 | 1 | 1 | 1 | 0 | 1 | 0 | 1 | 1 | 1 | 0.124 | 0.033 |
| GA | 1 | 1 | 0 | 1 | 0 | 1 | 1 | 0 | 0 | 0 | 1 | 1 | 1 | 1 | 0.163 | 0.049 |
| WOA | 1 | 0 | 0 | 1 | 1 | 1 | 1 | 1 | 0 | 1 | 0 | 1 | 1 | 0 | 0.101 | 0.026 |
DownLoad:
CSV


In this paper, a distribution network reconfiguration optimization method based on undirected graph island type discrimination and the WOA is proposed. We have built a feasible topology set for distribution networks on the foundation of undirected graph island type discrimination and further optimized the network topology using the WOA. The key findings of this paper are as follows:
1) Potential island detection method. The proposed potential island detection method effectively eliminated infeasible topologies, thereby enhancing the optimization solving efficiency of distribution network reconfiguration.
2) WOA for network reconfiguration. The proposed WOA-based network reconfiguration optimization can better address the topological searching space of feasible topologies in distribution network reconfiguration optimization. By this way, the optimization process can be accelerated and local optima issues can be effectively avoided.
Future work will focus on integrating the proposed topology optimization method with new voltage regulation techniques to further enhance the economic efficiency and reliability of distribution network operations.
The authors declare that they have not used artificial intelligence (AI) tools in the creation of this article.
The paper is supported, in part, by the National Key Research and Development Program "Graph Computing Analysis and Optimization Software for Ultra-Large-Scale Power Grid Equipment Nodes, " under Project 5, titled "Integrated Research and Development of Power Grid Graph Computing System and Application Verification" (Project Number: 2022YFB2404205), and by the Science and Technology Project of State Grid Jiangsu Electric Power Company (Project No.: J2023066).
The authors declare that there are no conflicts of interest regarding the publication of this paper.
The authors confirm contribution to the paper as follows: study conception and design: Hong Zhu; data collection: Hong Zhu; analysis and interpretation of results: Zijian Hu; draft manuscript preparation: Chen Deng. All authors have reviewed the results and approved the final version of the manuscript.
| [1] |
Wang Y, Mi J, Shan XY, et al. (2007) Is China facing an obesity epidemic and the consequences? The trends in obesity and chronic disease in China. Int J Obes (Lond) 31: 177-188. doi: 10.1038/sj.ijo.0803354

|
| [2] |
Wang Y, Chen HJ, Shaikh S, et al. (2009) Is obesity becoming a public health problem in India? Examine the shift from under- to overnutrition problems over time. Obes Rev 10: 456-474. doi: 10.1111/j.1467-789X.2009.00568.x
|
| [3] |
Wang Y, Lobstein T (2006) Worldwide trends in childhood overweight and obesity. Int J Pediatr Obes 1: 11-25. doi: 10.1080/17477160600586747
|
| [4] |
Tzioumis E, Kay MC, Bentley ME, et al. (2016) Prevalence and trends in the childhood dual burden of malnutrition in low- and middle-income countries, 1990–2012. Public Health Nutr 19: 1375-1388. doi: 10.1017/S1368980016000276
|
| [5] |
Steyn NP, McHiza ZJ (2014) Obesity and the nutrition transition in Sub-Saharan Africa. Ann N Y Acad Sci 1311: 88-101. doi: 10.1111/nyas.12433
|
| [6] |
Steyn NP, Nel JH, Parker W, et al. (2012) Urbanisation and the nutrition transition: A comparison of diet and weight status of South African and Kenyan women. Scand J Public Health 40: 229-238. doi: 10.1177/1403494812443605
|
| [7] |
Abrahams Z, McHiza Z, Steyn NP (2011) Diet and mortality rates in Sub-Saharan Africa: stages in the nutrition transition. BMC Public Health 11: 801. doi: 10.1186/1471-2458-11-801
|
| [8] |
Wang Y, Monteiro C, Popkin BM (2002) Trends of obesity and underweight in older children and adolescents in the United States, Brazil, China, and Russia. Am J Clin Nutr 75: 971-977. doi: 10.1093/ajcn/75.6.971
|
| [9] |
Albala C, Vio F, Kain J, et al. (2002) Nutrition transition in Chile: determinants and consequences. Public Health Nutr 5: 123-128. doi: 10.1079/PHN2001283
|
| [10] |
Min J, Zhao Y, Slivka L, et al. (2018) Double burden of diseases worldwide: coexistence of undernutrition and overnutrition-related non-communicable chronic diseases. Obes Rev 19: 49-61. doi: 10.1111/obr.12605
|
| [11] |
Mayosi BM, Flisher AJ, Lalloo UG, et al. (2009) The burden of non-communicable diseases in South Africa. Lancet 374: 934-947. doi: 10.1016/S0140-6736(09)61087-4
|
| [12] |
Popkin BM, Adair LS, Ng SW (2012) Global nutrition transition and the pandemic of obesity in developing countries. Nutr Rev 70: 3-21. doi: 10.1111/j.1753-4887.2011.00456.x
|
| [13] |
Romieu I, Dossus L, Barquera S, et al. (2017) Energy balance and obesity: what are the main drivers? Cancer Causes Control 28: 247-258. doi: 10.1007/s10552-017-0869-z
|
| [14] |
Due P, Damsgaard MT, Rasmussen M, et al. (2009) Socioeconomic position, macroeconomic environment and overweight among adolescents in 35 countries. Int J Obes (Lond) 33: 1084-1093. doi: 10.1038/ijo.2009.128
|
| [15] | (2017) Global Nutrition Report Stakeholder GroupGlobal nutrition report 2017: nourishing the SDGs. Bristol, UK: Development Initiatives. Available from: https://globalnutritionreport.org/reports/2017-global-nutrition-report/. |
| [16] | The Demographic Health Survey ProgramGhana demographic and health survey 1998–2014. Rockville, MD, USA: Ghana Statistical Service, Ghana Health Service, and ICF International. Available from: https://www.dhsprogram.com/data/available-datasets.cfm. |
| [17] | The Demographic Health Survey ProgramKenya demographic and health survey 1998–2014. Rockville, MD, USA: Kenya National Bureau of Statistics, Kenya Ministry of Health, Kenya National AIDS Control Council, Kenya Medical Research Institute, Kenya National Council for Population and Development, and ICF International. Available from: https://www.dhsprogram.com/data/available-datasets.cfm. |
| [18] | The Demographic Health Survey ProgramMalawi demographic and health survey 2000–2016. Zomba, Malawi, and Rockville, MD, USA: National Statistical Office and ICF International. Available from: https://www.dhsprogram.com/data/available-datasets.cfm. |
| [19] | The Demographic Health Survey ProgramSouth Africa demographic and health survey 1998–2016. Pretoria, South Africa and Rockville, MD, USA: National Department of Health, Statistics South Africa, South African Medical Research Council, and ICF International. Available from: https://www.dhsprogram.com/data/available-datasets.cfm. |
| [20] | World Health Organization Global Health Observatory data: Child malnutrition country survey results. Available from: http://apps.who.int/gho/data/node.main. |
| [21] | World Health Organization Global Health Observatory data: Body mass index (BMI). Available from: http://apps.who.int/gho/data/node.main. |
| [22] |
Bates K, Gjonça A, Leone T (2017) Double burden or double counting of child malnutrition? The methodological and theoretical implications of stunting overweight in low and middle income countries. J Epidemiol Community Health 71: 779-785. doi: 10.1136/jech-2017-209008
|
| [23] |
Fernald LC, Neufeld LM (2007) Overweight with concurrent stunting in very young children from rural Mexico: prevalence and associated factors. Eur J Clin Nutr 61: 623-632. doi: 10.1038/sj.ejcn.1602558
|
| [24] | Hawkes C, Harris J, Gillespie S (2017) Changing diets: Urbanization and the nutrition transition. 2017 Global Food Policy Report Washington, DC, USA: International Food Policy Research Institution (IFPRI), 34-41. |
| [25] |
Ajayi IO, Adebamowo C, Adami HO, et al. (2016) Urban-rural and geographic differences in overweight and obesity in four sub-Saharan African adult populations: A multi-country cross-sectional study. BMC Public Health 16: 1126. doi: 10.1186/s12889-016-3789-z
|
| [26] |
Sodjinou R, Agueh V, Fayomi B, et al. (2008) Obesity and cardio-metabolic risk factors in urban adults of Benin: relationship with socio-economic status, urbanisation, and lifestyle patterns. BMC Public Health 8: 84. doi: 10.1186/1471-2458-8-84
|
| [27] |
Kimani-Murage EW, Muthuri SK, Oti SO, et al. (2015) Evidence of a double burden of malnutrition in urban poor settings in Nairobi, Kenya. PLoS One 10: e0129943. doi: 10.1371/journal.pone.0129943
|
| [28] |
Christensen DL, Eis J, Hansen AW, et al. (2008) Obesity and regional fat distribution in Kenyan populations: impact of ethnicity and urbanization. Ann Hum Biol 35: 232-249. doi: 10.1080/03014460801949870
|
| [29] |
Neuman M, Kawachi I, Gortmaker S, et al. (2013) Urban-rural differences in BMI in low- and middle-income countries: the role of socioeconomic status. Am J Clin Nutr 97: 428-436. doi: 10.3945/ajcn.112.045997
|
| [30] |
Kanter R, Caballero B (2012) Global gender disparities in obesity: A review. Adv Nutr 3: 491-498. doi: 10.3945/an.112.002063
|
| [31] | Walker AR, Adam F, Walker BF (2001) World pandemic of obesity: the situation in Southern African populations. Public Health 115: 368-372. |
| [32] |
Holdsworth M, Gartner A, Landais E, et al. (2004) Perceptions of healthy and desirable body size in urban Senegalese women. Int J Obes Relat Metab Disord 28: 1561-1568. doi: 10.1038/sj.ijo.0802739
|
| [33] |
Tateyama Y, Techasrivichien T, Musumari PM, et al. (2018) Obesity matters but is not perceived: a cross-sectional study on cardiovascular disease risk factors among a population-based probability sample in rural Zambia. PLoS One 13: e0208176. doi: 10.1371/journal.pone.0208176
|
| [34] | Rguibi M, Belahsen R (2006) Fattening practices among Moroccan Saharawi women. East Mediterr Health J 12: 619-624. |
| [35] |
Lobstein T, Jackson-Leach R, Moodie ML, et al. (2015) Child and adolescent obesity: part of a bigger picture. Lancet 385: 2510-2520. doi: 10.1016/S0140-6736(14)61746-3
|
| [36] | (2016) World Health Organization (WHO)Consideration of the evidence on childhood obesity for the Commission on Ending Childhood Obesity: report of the ad hoc working group on science and evidence for ending childhood obesity. Geneva, Switzerland: WHO. Available from: https://apps.who.int/iris/bitstream/handle/10665/206549/9789241565332_eng.pdf?sequence=1&isAllowed=y. |
| [37] |
Uauy R, Albala C, Kain J (2001) Obesity trends in Latin America: transiting from under-to overweight. J Nutr 131: 893S-899S. doi: 10.1093/jn/131.3.893S
|
| [38] | United Nations Sustainable development goals. Available from: https://www.un.org/sustainabledevelopment/sustainable-development-goals/. |
| [39] | South African Government National development plan 2030: our future–make it work. Available from: https://www.gov.za/issues/national-development-plan-2030. |
| [40] | (2013) Ghana Ministry of Health and the Ghana Health ServiceNational nutrition policy for Ghana 2013–2017. The Ministry of Food and Agriculture, Ministry of Education, Ministry of Finance, Ministry of Employment and Social Welfare, National Development Planning Commission, and Renewed Efforts Against Child Hunger. Available from: http://extwprlegs1.fao.org/docs/pdf/gha145267.pdf. |
| [41] | (2015) Republic of Kenya Ministry of HealthKenya national strategy for the prevention and control of non-communicable diseases 2015–2020. Nairobi, Kenya: Ministry of Health, MOH/CDC CoAg, IANPHI, Kenya Redcross, and World Health Organization. Available from: https://www.who.int/nmh/ncd-task-force/kenya-strategy-ncds-2015-2020.pdf. |
| 1. | Huanhuan Ye, Qing Wang, Yongsheng Xian, Bo Wen, Yuange Li, Siwei Hou, Optimization planning of new rural multi-energy distribution network based on fuzzy algorithm, 2025, 8, 2520-8942, 10.1186/s42162-025-00502-y |

Teresia Mbogori, Kilee Kimmel, Mengxi Zhang, Jay Kandiah, Youfa Wang. Nutrition transition and double burden of malnutrition in Africa: A case study of four selected countries with different social economic development[J]. AIMS Public Health, 2020, 7(3): 425-439. doi: 10.3934/publichealth.2020035

| Potential island types | Contained nodes | Switchable branches connecting the potential islands | Types of switchable branches connecting the potential islands |
| Type 1 | Nodes 3-4 | b2, b4, b5 | All the switchable branches are the common branches of two fundamental loops |
| Nodes 3-4-5 | b2, b4, b6 | ||
| Node 5 | b5, b6 | ||
| Type 2 | Node 6 | b6, b8, b9 | Some of the switchable branches (b8 and b9) are NOT the common branches of two fundamental loops |
DownLoad:
CSV
| Branches | ||
| Fundamental loops | Loop 1 | b3, b4, b5, b22, b23, b24, b25, b26, b27, b28, b37 |
| Loop 2 | b6, b7, b8, b15, b16, b17, b25, b26, b27, b28, b29, b30, b31, b32, b34, b36 | |
| Loop 3 | b9, b10, b11, b12, b13, b14, b34 | |
| Loop 4 | b2, b3, b4, b5, b6, b7, b18, b19, b20, b33 | |
| Loop 5 | b8, b9, b10, b11, b21, b33, b35 | |
| Simplified fundamental loops | Loop 1 | b4, b23, b27, b37 |
| Loop 2 | b7, b27, b32, b34, b36 | |
| Loop 3 | b9, b14, b34 | |
| Loop 4 | b4, b7, b18, b20, b33 | |
| Loop 5 | b9, b33, b35 | |
DownLoad:
CSV
| Branches | |
| Common branches of fundamental loops | b4, b7, b9, b27, b33, b34 |
| Non-common branches of fundamental loops | b14, b18, b20, b23, b32, b35, b36, b37 |
DownLoad:
CSV
| Potential island types | Contained nodes | Switchable branches connecting the potential islands | Fundamental loops' non-common branches connecting the potential islands |
| Type 1 | Nodes 5-6-7-26-27 | b4, b7, b27 | / |
| Nodes 5-6-7-8-9-26-27 | b4, b9, b27, b33, b34 | ||
| Nodes 8-9 | b7, b9, b33, b34 | ||
| Type 2 | Nodes 10-11-12-13-14 | b9, b14, b35 | b14, b35 |
| Nodes 15-16-17-18 | b14, b34, b36 | b14, b36 | |
| Nodes 19-20 | b18, b20 | b18, b20 | |
| Nodes 21-22 | b20, b33, b35 | b20, b35 | |
| Nodes 24-25 | b23, b37 | b23, b37 | |
| Nodes 28-29-30-31-32 | b27, b32, b37 | b32, b37 | |
| Node 33 | b32, b36 | b32, b36 |
DownLoad:
CSV
| Method | On/off state of the switchable branches | Network loss (MW) |
Average voltage deviation (p.u.) | |||||||||||||
| b4 | b7 | b9 | b14 | b18 | b20 | b23 | b27 | b32 | b33 | b34 | b35 | b36 | b37 | |||
| PSO | 1 | 1 | 1 | 1 | 1 | 1 | 1 | 1 | 0 | 0 | 0 | 0 | 0 | 0 | 0.132 | 0.040 |
| SA | 0 | 0 | 0 | 1 | 1 | 1 | 1 | 1 | 1 | 1 | 0 | 1 | 0 | 1 | 0.119 | 0.037 |
| GA | 1 | 1 | 1 | 0 | 0 | 1 | 1 | 0 | 1 | 0 | 1 | 1 | 0 | 1 | 0.155 | 0.047 |
| WOA | 1 | 0 | 0 | 1 | 1 | 1 | 1 | 1 | 1 | 1 | 0 | 1 | 0 | 0 | 0.102 | 0.029 |
DownLoad:
CSV
| Method | On/off state of the switchable branches | Network loss (MW) |
Average voltage deviation (p.u.) | |||||||||||||
| b4 | b7 | b9 | b14 | b18 | b20 | b23 | b27 | b32 | b33 | b34 | b35 | b36 | b37 | |||
| PSO | 0 | 0 | 1 | 0 | 1 | 0 | 1 | 1 | 1 | 0 | 1 | 1 | 1 | 1 | 0.296 | 0.096 |
| SA | 0 | 0 | 0 | 1 | 1 | 1 | 1 | 1 | 0 | 1 | 0 | 1 | 1 | 1 | 0.124 | 0.033 |
| GA | 1 | 1 | 0 | 1 | 0 | 1 | 1 | 0 | 0 | 0 | 1 | 1 | 1 | 1 | 0.163 | 0.049 |
| WOA | 1 | 0 | 0 | 1 | 1 | 1 | 1 | 1 | 0 | 1 | 0 | 1 | 1 | 0 | 0.101 | 0.026 |
DownLoad:
CSV
| Potential island types | Contained nodes | Switchable branches connecting the potential islands | Types of switchable branches connecting the potential islands |
| Type 1 | Nodes 3-4 | b2, b4, b5 | All the switchable branches are the common branches of two fundamental loops |
| Nodes 3-4-5 | b2, b4, b6 | ||
| Node 5 | b5, b6 | ||
| Type 2 | Node 6 | b6, b8, b9 | Some of the switchable branches (b8 and b9) are NOT the common branches of two fundamental loops |
| Branches | ||
| Fundamental loops | Loop 1 | b3, b4, b5, b22, b23, b24, b25, b26, b27, b28, b37 |
| Loop 2 | b6, b7, b8, b15, b16, b17, b25, b26, b27, b28, b29, b30, b31, b32, b34, b36 | |
| Loop 3 | b9, b10, b11, b12, b13, b14, b34 | |
| Loop 4 | b2, b3, b4, b5, b6, b7, b18, b19, b20, b33 | |
| Loop 5 | b8, b9, b10, b11, b21, b33, b35 | |
| Simplified fundamental loops | Loop 1 | b4, b23, b27, b37 |
| Loop 2 | b7, b27, b32, b34, b36 | |
| Loop 3 | b9, b14, b34 | |
| Loop 4 | b4, b7, b18, b20, b33 | |
| Loop 5 | b9, b33, b35 | |
| Branches | |
| Common branches of fundamental loops | b4, b7, b9, b27, b33, b34 |
| Non-common branches of fundamental loops | b14, b18, b20, b23, b32, b35, b36, b37 |
| Potential island types | Contained nodes | Switchable branches connecting the potential islands | Fundamental loops' non-common branches connecting the potential islands |
| Type 1 | Nodes 5-6-7-26-27 | b4, b7, b27 | / |
| Nodes 5-6-7-8-9-26-27 | b4, b9, b27, b33, b34 | ||
| Nodes 8-9 | b7, b9, b33, b34 | ||
| Type 2 | Nodes 10-11-12-13-14 | b9, b14, b35 | b14, b35 |
| Nodes 15-16-17-18 | b14, b34, b36 | b14, b36 | |
| Nodes 19-20 | b18, b20 | b18, b20 | |
| Nodes 21-22 | b20, b33, b35 | b20, b35 | |
| Nodes 24-25 | b23, b37 | b23, b37 | |
| Nodes 28-29-30-31-32 | b27, b32, b37 | b32, b37 | |
| Node 33 | b32, b36 | b32, b36 |
| Method | On/off state of the switchable branches | Network loss (MW) |
Average voltage deviation (p.u.) | |||||||||||||
| b4 | b7 | b9 | b14 | b18 | b20 | b23 | b27 | b32 | b33 | b34 | b35 | b36 | b37 | |||
| PSO | 1 | 1 | 1 | 1 | 1 | 1 | 1 | 1 | 0 | 0 | 0 | 0 | 0 | 0 | 0.132 | 0.040 |
| SA | 0 | 0 | 0 | 1 | 1 | 1 | 1 | 1 | 1 | 1 | 0 | 1 | 0 | 1 | 0.119 | 0.037 |
| GA | 1 | 1 | 1 | 0 | 0 | 1 | 1 | 0 | 1 | 0 | 1 | 1 | 0 | 1 | 0.155 | 0.047 |
| WOA | 1 | 0 | 0 | 1 | 1 | 1 | 1 | 1 | 1 | 1 | 0 | 1 | 0 | 0 | 0.102 | 0.029 |
| Method | On/off state of the switchable branches | Network loss (MW) |
Average voltage deviation (p.u.) | |||||||||||||
| b4 | b7 | b9 | b14 | b18 | b20 | b23 | b27 | b32 | b33 | b34 | b35 | b36 | b37 | |||
| PSO | 0 | 0 | 1 | 0 | 1 | 0 | 1 | 1 | 1 | 0 | 1 | 1 | 1 | 1 | 0.296 | 0.096 |
| SA | 0 | 0 | 0 | 1 | 1 | 1 | 1 | 1 | 0 | 1 | 0 | 1 | 1 | 1 | 0.124 | 0.033 |
| GA | 1 | 1 | 0 | 1 | 0 | 1 | 1 | 0 | 0 | 0 | 1 | 1 | 1 | 1 | 0.163 | 0.049 |
| WOA | 1 | 0 | 0 | 1 | 1 | 1 | 1 | 1 | 0 | 1 | 0 | 1 | 1 | 0 | 0.101 | 0.026 |