


Citation: Gareth Morgan. Does Utilitarian Policy such as Smoking Cessation Lend Support to Wider Aspirin Use?[J]. AIMS Public Health, 2015, 2(2): 223-226. doi: 10.3934/publichealth.2015.2.223
| [1] | Francisco L. Pérez . Viticultural practices in Jumilla (Murcia, Spain): a case study of agriculture and adaptation to natural landscape processes in a variable and changing climate. AIMS Agriculture and Food, 2016, 1(3): 265-293. doi: 10.3934/agrfood.2016.3.265 |
| [2] | A. Nurbekov, A. Akramkhanov, A. Kassam, D. Sydyk, Z. Ziyadaullaev, J.P.A. Lamers . Conservation Agriculture for combating land degradation in Central Asia: a synthesis. AIMS Agriculture and Food, 2016, 1(2): 144-156. doi: 10.3934/agrfood.2016.2.144 |
| [3] | Dhanya Praveen, Ramachandran Andimuthu, K. Palanivelu . The urgent call for land degradation vulnerability assessment for conserving land quality in the purview of climate change: Perspective from South Indian Coast. AIMS Agriculture and Food, 2016, 1(3): 330-341. doi: 10.3934/agrfood.2016.3.330 |
| [4] | I. Bashour, A. AL-Ouda, A. Kassam, R. Bachour, K. Jouni, B. Hansmann, C. Estephan . An overview of Conservation Agriculture in the dry Mediterranean environments with a special focus on Syria and Lebanon. AIMS Agriculture and Food, 2016, 1(1): 67-84. doi: 10.3934/agrfood.2016.1.67 |
| [5] | Jon Hellin, Santiago López Ridaura . Soil and water conservation on Central American hillsides: if more technologies is the answer, what is the question?. AIMS Agriculture and Food, 2016, 1(2): 194-207. doi: 10.3934/agrfood.2016.2.194 |
| [6] | Angelina De Pascale, Carlo Giannetto, Agata Zirilli, Angela Alibrandi, Maurizio Lanfranchi . How Mediterranean winegrowers perceive climate change. AIMS Agriculture and Food, 2023, 8(2): 440-460. doi: 10.3934/agrfood.2023023 |
| [7] | Antonio Comparetti, Evangelos Anastasiou, Aikaterini Kasimati, Spyros Fountas . Precision viticulture in Mediterranean countries: From vegetation vigour and yield maps to spatially and temporally variable vintage. AIMS Agriculture and Food, 2025, 10(2): 390-422. doi: 10.3934/agrfood.2025020 |
| [8] | Hans-Georg Schwarz-v. Raumer, Elisabeth Angenendt, Norbert Billen, Rüdiger Jooß . Economic and ecological impacts of bioenergy crop production—a modeling approach applied in Southwestern Germany. AIMS Agriculture and Food, 2017, 2(1): 75-100. doi: 10.3934/agrfood.2017.1.75 |
| [9] | Shuoshuo Zhang, Yichang Wei, Muhammad Nawaz Kandhro, Feng Wu . Evaluation of FDR MI2X and New WiTu Technology sensors to determine soil water content in the corn and weed field. AIMS Agriculture and Food, 2020, 5(1): 169-180. doi: 10.3934/agrfood.2020.1.169 |
| [10] | Juan Albaladejo . Soil: a C sink to mitigate climate change. AIMS Agriculture and Food, 2016, 1(3): 354-356. doi: 10.3934/agrfood.2016.3.354 |
Soil erosion is a natural process that can be greatly accelerated by land use and climate changes, and is a major hazard to the long-term sustainability of agriculture and ecosystems. In the Mediterranean area, typical land uses such as olive trees, almond trees, orchards or vineyards are among those that incur higher rates of erosion. Among these land uses, vineyards are one in which greatest soil losses are recorded [1,2,3,4]. This may be due to a combination of rainfall and soil characteristics, as well as management. The Mediterranean climate is characterized by large variability in rainfall from to year to year, irregularly distributed throughout the year and with high intensity rainfall events, particularly in autumn. Some of these events are highly erosive [5], and usually one or two events every year are responsible for a high percentage of the annual soil losses. Most soils have loamy or loamy-sand textures, with an average percentage of coarse elements in the top horizon ranging between 10 and 20% and with relatively low organic matter content. In some cases soils are susceptible to sealing after some mm of rainfall. Thus, soils are susceptible to erosion processes.
In the Mediterranean, most vines are cultivated on bare soil, due to the scarcity of water. In addition, most traditional soil conservation measures were eliminated with the mechanization of almost all labors, mainly driven by the need to plant longer vine rows to facilitate the movement of machinery in the fields and to increase plant density. This required leveling and transforming land and reorganizing existing plots. The resulting cultivated soils, with altered profiles, lower organic matter content, poor structure and low infiltration capacities, are more susceptible to erosion processes [6,7]. Under these conditions, erosion losses in vineyards reach high values. Annual soil losses up to 25 Mg ha−1 have been recorded, most of which are recorded in a small number of events [8]. Even higher values have been recorded after some extreme events [9]. These soil losses not only represent the degradation of the soil due to higher losses, which surpass the soil loss tolerance, but additional nutrient losses [10] and increasing operational costs with negative impacts for vine growers [11].
The observed climate trends present additional threats for soil degradation with a potential increase of the magnitude of erosion processes. Different studies carried out in the Mediterranean region suggest that notable changes in seasonal precipitation regimes have occurred during the second half of the 20th century, which affected the main rainy seasons [12,13] with decreasing precipitation trends [14,15,16,17] and with an increase in extreme events in association with global warming [18,19,20]). The increase in the incidence of precipitation extremes may have an additional impact, due to greater water volumes being lost to runoff meaning less water infiltration and storage in the soil and an increase in the erosion processes [8,21]. Some predictions have been made for several different environments and according to dif2ferent scenarios, and also, using different models with different approaches and covering a range of spatial scales and time periods [22,23,24,25]. Among the most used models, WATEM-SEDEM [26]; PESERA [27]; SWAT [22]; EUROSEM [28]; WEPP [29]; R-USLE [30], or PSIAC [31] can be found. However, the expected increase in erosion rates was not always confirmed [32,33]. The results show that they seem to be affected by complex interactions of changes in rainfall distribution and intensity and in land use and management, which should be considered when climate change effects are considered [34,35,36].
In this study, soil losses under different rainfall distributions and climate change scenarios (2030 and 2050) in an area with a Mediterranean climate are analyzed. The effect of implementing drainage terraces in new vineyards to reduce soil losses is simulated for vineyards cultivated under rainfed conditions using WEPP.
The area of study is located in the Anoia region, about 40 km northwest of Barcelona (1°46ʹ11″E, 41°31ʹ52″N, 340 m.a.s.l.). This area is located in the Penedès Depression, between the Serralada Pre-litoral pre-coastal mountain range and the Mediterranean Sea in Northeastern Spain (Figure 1). The climate is Mediterranean with maritime influence, characterized by two wet periods (spring and autumn) separated by hot, dry summers. High intensity rainfall events are usually recorded in autumn [37]. The soils have developed on alluvial deposits from the Pleistocene Epoch, which are covered with a substratum of Miocene marls, sandstones and unconsolidated conglomerates. A high percentage of coarse elements of metamorphic origin is present in the soils. The evaluations were carried out at plot scale in one vineyard in which the soils, according to the soil map (1:25,000) of the Penedès region [38], are classified as Typic Xerorthents and Fluventic Haploxerepts. Sand contents ranged between 27.7 and 50%; silt content ranged between 37 and 47.2% and clay content ranged between 13 and 25.1%, while organic matter content ranged between 0.7 and 1.4%. The main land use is vines, which cover about 40% of the area [39].
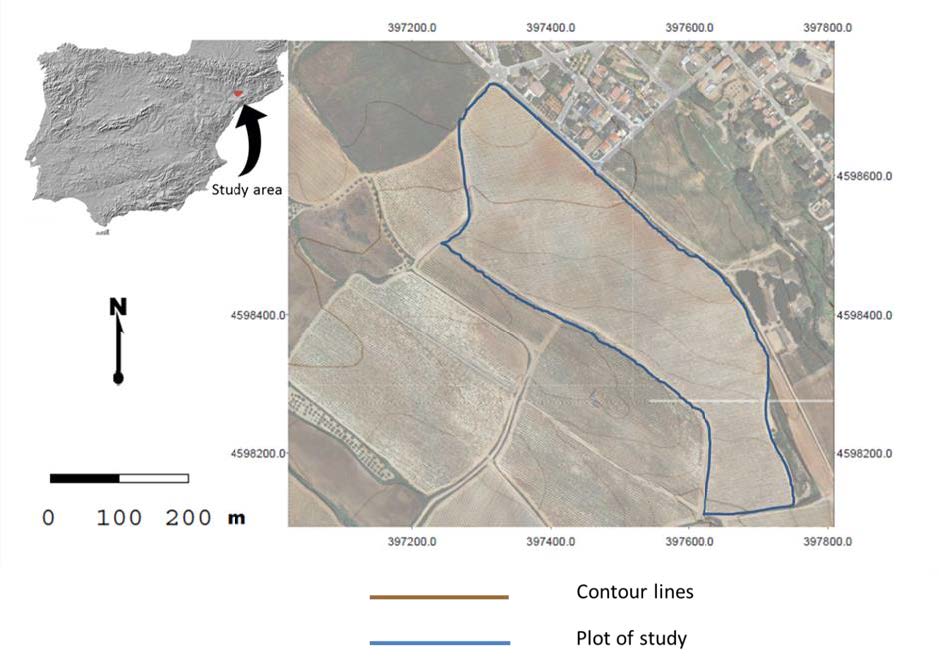 Figure 1. Location of the study area.
The studied plot (Figure 1) was planted in 1990 and was levelled before vine plantation. It produced significant disturbances to the original soil profile and created variability in soil properties within the plot. The plantation consists of trained vines with 3 m between rows and 3 m between plants, orientated NNE-WSW, on an average gradient of about 7%. The field study was carried out in 2010, 2011 and 2012, which had different amounts of rainfall and distribution. Within the plot, soil properties were evaluated at three locations (up (1), middle (2) and down slope (3)). pH, soil particle distribution [40], bulk density [41], organic carbon [42], water retention capacity at saturation, −33 and −1500 kPa (Richard Plates) were evaluated. The coarse element fraction was evaluated in an aliquot fraction of 2 kg, which was sieved using a 2 mm mesh. In addition, steady infiltration was evaluated using simulated rainfall. Plots, 0.30 m × 0.20 m were delimited in the field and subjected to 70 mm h−1 simulated rainfall composed of 2.5 mm diameter drops of deionized water falling freely from droppers 2.5 m above the soil surface. Runoff water was collected at 5-minute intervals for 50 minutes.
Soil characteristics of the soil surface at those locations are shown in Table 1. Most soils have a loamy-sandy or sandy texture, with the average percentage of coarse elements ranging from 20 to 30% in the top horizon. Organic matter content is relatively low (<1.4%). Water retention capacity at −33 kPa ranges between 16 and 22%, while at −1500 kPa the value ranges between 5.24 and 7.24%. Bulk density also varies within the plot, with an average value of about 1540 kg m-3. Based on this average value and taking into account that tillage may produce a reduction in bulk density, the average bulk density after tillage considered in the model was 1500 kg m−3.
| Area | Clay % | Silt % | Sand % | O.M. % | Bulk density kg m-3 | pH | FC (-33 kPa) % | PWP (-1500 kPa) % | Infiltration rates mm h-1 |
| 1 | 8.5 ± 4.6 | 22.9 ± 4.6 | 68.6 ± 8.8 | 1.18 ± 0.37 | 1545 ± 120 | 8.53 | 19.55 | 6.25 | 27 |
| 2 | 4.5 ± 3.0 | 13.6 ± 2.1 | 81.9 ± 4.6 | 1.32 ± 0.22 | 1670 ± 55 | 8.55 | 16.11 | 5.27 | 28 |
| 3 | 5.0 ± 2.3 | 17.9 ± 3.9 | 77.1 ± 6.0 | 1.37 ± 0.21 | 1420 ± 89 | 8.66 | 21.89 | 7.24 | 10.3 |
 DownLoad: CSV
Soil depth ranges from 0.80 to 1.5 m. Soil water was monitored at four depths (10-30, 40-50, 50-70, 70-90 cm) in each plot every 15 days using Time Domain Reflectometry (TDR) IMKO tube-probes. The average soil water values for the profile were used to test the soil water simulated by the model. At the same positions, runoff samples were collected after the events that produced runoff using Gerlach collectors. Sediment concentrations in runoff were measured in each sample using an aliquot which was dried at 105 ℃ and weighed. The results obtained were then used in conjunction with runoff water volumes to calculate soil losses for each runoff sampling point.
Climatic data were recorded at Els Hostalets de Pierola (long. 41.46°; lat. −1.81°; elev. a.l. 326 m), close to the study vineyard plot. This station belongs to METEOCAT (Institut Meteorologic de Catalunya). Hourly maximum, minimum and dew point temperature, precipitation, solar radiation, relative wind velocity and direction from the period 1996-2014 were recorded. Means and standard deviations of each variable were calculated. During the period of study additional rainfall data at 1 min intervals were collected at the plot. Years with different rainfall amount and distribution were identified and considered for further analysis. Temperature and precipitation changes in climate were simulated for 2030 and 2050 using the HadCM3 GCM predictions for the Representative Concentration Pathways (RCP) scenarios RCP8.5. Changes in solar radiation and relative humidity were taken for the prediction made for scenario A2. The data were downscaled to daily time step. The average monthly changes of these variables for each scenario are summarized in Table 2.
| Jan | Feb | Mar | Apr | May | Jun | Jul | Aug | Sep | Oct | Nov | Dec | |
| 2030 | ||||||||||||
| Tmax ( ℃) | 0.694 | 0.816 | 1.147 | 0.894 | 1.034 | 1.372 | 1.675 | 2.248 | 1.647 | 1.552 | 0.613 | 0.573 |
| Tmin ( ℃) | 0.639 | 0.630 | 0.769 | 0.643 | 0.863 | 1.028 | 1.290 | 1.868 | 1.347 | 1.517 | 0.674 | 0.388 |
| SR (W/m2) | 0.129 | 0.076 | 7.606 | 4.600 | -0.303 | 11.748 | 14.851 | 11.003 | 6.296 | -0.354 | 0.321 | 0.170 |
| P (%) | -3.64 | -4.17 | -15.92 | -5.12 | -9.10 | -17.98 | -25.08 | -13.74 | -0.40 | 24.95 | 6.38 | -4.03 |
| RH (fraction) | 0.49 | -0.56 | -2.65 | -2.37 | -0.41 | -1.75 | -2.52 | -2.21 | -1.89 | -0.36 | -1.62 | -1.30 |
| WV (%) | -1.65 | 0.61 | 0.00 | 4.04 | -1.70 | 1.83 | 1.80 | -1.62 | 0.70 | -0.75 | 2.87 | 2.65 |
| 2050 | ||||||||||||
| Tmax ( ℃) | 1.450 | 1.888 | 1.633 | 1.461 | 1.831 | 2.438 | 3.360 | 4.198 | 3.129 | 2.251 | 1.628 | 1.388 |
| Tmin ( ℃) | 1.215 | 1.719 | 1.455 | 1.054 | 1.363 | 1.832 | 2.366 | 2.982 | 2.499 | 2.157 | 1.705 | 1.326 |
| SR (W/m2) | -0.142 | -1.047 | 5.286 | 8.094 | 6.182 | 10.937 | 22.325 | 20.637 | 12.504 | 1.366 | 0.442 | -1.647 |
| P (%) | 1.86 | 3.18 | -12.32 | -17.37 | -23.41 | -23.65 | -32.91 | -31.91 | -25.91 | 9.14 | 6.17 | 1.86 |
| RH (fraction) | -0.75 | -0.84 | -2.86 | -3.16 | -2.32 | -2.24 | -4.13 | -5.46 | -4.18 | -1.58 | -1.70 | -0.99 |
| WV (%) | 1.48 | -0.58 | 3.08 | 1.34 | 1.69 | 0.49 | -3.29 | -4.20 | -3.46 | -0.63 | -1.29 | -1.30 |
DownLoad: CSVThe hillslope version WEPP (v2012.8), which computes erosion along a single slope profile, was used in this study. The surface hydrology and water balance, subsurface hydrology, soils, plant growth, overland-flow hydraulics, and erosion components were considered. The description of the model was taken from Pieri et al. [43]. The surface hydrology and water balance routines use information on weather, vegetation and cultural practices. Infiltration in the model is computed by a Green-Ampt Mein-Larson equation [44] modified for unsteady rainfall [45]. Actual evapotranspiration (ET) is evaluated using a modified Ritchie’s model [46], with reference potential ET estimated from the Penman-Monteith model [47]. Rainfall interception by canopy, surface depressional storage, soil water percolation, and subsurface lateral flow are also considered. Water partitioning between infiltration and runoff depends on hydraulic conductivity and saturation. The subsurface flow simulation is based on a mass continuity approach developed by Sloan and Moore [48]. The overland-flow is based on the approximate solutions to kinematic wave equations. The erosion component includes interrill and rill erosion and soil detachment by raindrop impact and subsequent sediment delivery as a function of the flow shear stress and transport capacity of concentrated flow. The plant-growth routines calculate biomass production for both crops and rangeland plants. The inputs for the model are described below.
Climate data: Daily maximum, minimum and dew point temperature, precipitation, solar radiation, relative wind velocity and direction from the period 1996-2014 were used. Breakpoint climate data series were used as inputs for the Water Erosion Prediction Project (WEPP), which were generated using the BPCDG2 software.
Soil characteristics: Soil properties such as pH, CEC, soil particle distribution (clay, silt, sand and rock fragment contents), organic matter content, bulk density, hydraulic conductivity, water retention capacity −33 and −1500 kPa were included. The soil water level measured in the field was used to parametrize the initial saturation level. Soil erosion was predicted for the different soil characteristics and then averaged for the plot.
Land management: Basic parameters related to grape vine were extracted from the WEPP database [49] and completed with information obtained from the literature [50,51] and own data derived from previous studies in the area. Land management and field-implemented tillage practices were modified according to the information given by the grape growers in the area. In the study plots, soil was bare most of the time with frequent tillage. The specific vegetation parameters for vines used by the model are shown in Table 3.
| Initial conditions | Values | Plant growth and harvest parameters | Values |
| Bulk density after last tillage (g/cm3) | 1.5 | Biomass energy ratio (kg/MJ) | 30 |
| Initial canopy cover (%) | 10 | Growing degree days to emergence (dgd) | 30 |
| Days since last harvest (days) | 180 | Growing degree days for growing season (gdd) | 2000 |
| Days since last tillage (days) | 30 | In-row plant spacing (m) | 3 |
| Initial interril cover (%) | 10 | Plant stem diameter at maturity (cm) | 5 |
| Initial residue cropping system | 0 | Harvest index (dry crop yield/ total above ground biomass) (%) | 50 |
| Cummulative rainfall since last tillage | 200 | ||
| Initial ridge height since the last tillage (cm) | 2 | Canopy, LAI and Root Parameters | |
| Initial rill cover (%) | 10 | Canopy cover coefficient | 14 |
| Initial roughness after last tillage (cm) | 1 | Parameter value for canopy height equation | 23 |
| Rill spacing (m) | 0 | Maximum canopy height (m) | 2 |
| Rill width type | Temporary | Maximum leaf area index | 6 |
| Depth secondary tillage layer (cm) | 35 | Maximum root depth (m) | 1.5 |
| Depth primary tillage layer (cm) | 20 | Root to shoot ratio | 0.3 |
| Initial rill width (cm) | 2 | Maximum root mass for perennial crop (kg/m2) | 0.6 |
| Initial total dead root mass (kg/m2) | 0.5 | ||
| Initial total submerged residue mass (kg/m2) | 0.2 | ||
| Temperature and radiation parameters | |||
| Base daily air temperature ( ℃) | 10 | ||
| Optimal temperature for plant growth ( ℃) | 25 | ||
| Maximum temperature that stops the growth ( ℃) | 35 | ||
| Critical freezing temperature ( ℃) | -40 | ||
| Radiation extinction coefficient | 0.65 | ||
| Management | S, Ch, C | ||
| Plant beginning | Apr 1st | ||
| Tillage information | |||
| Subsoil-chisel (S) | Jan 15th | Mean tillage depth (cm) | 20, 20, 10 |
| Chisel plow, rolling dick (Ch) | Feb 15th | Fraction of surface area disturbed (%) | 100, 100, 95 |
| Apr 1st | Random roughness value after tillage (cm) | 1.5, 1.5, 1.5 | |
| Cultivator (C) | May 20th | Ridge interval (cm) | 7.5, 30, 75 |
| Jun 20th | Ridge height value after tillage (cm) | 100, 5, 15 | |
| Harvest-Annual | Sep 10th |
DownLoad: CSVThe calibration of the model was carried out according to the procedure suggested by Alberts et al. [52] in the WEPP documentation. The model response to changes in drainage conditions and the parameters such as interrill erodibility, rill erodibility, critical shear and effective hydraulic conductivity were evaluated and explored on the outputs. These parameters were adjusted one by one starting with the average values recommended by the WEPP documentation [53]. For other parameters, information available from previous studies in the area and evaluations carried out in the field were considered. Calibration was then carried out by manually adjusting these parameters until reaching the best fit between simulated and measured soil loss. The soil water level measured in the field was used to parametrize the initial saturation level.
Calibration was carried out for the years 2010-2011 while 2012 was used for validation. Simulated runoff and soil losses were compared with the data obtained in the field survey. For each event the simulated runoff and soil loss integrated over time were compared with the average measured values. Model performance for both calibration and validation periods was evaluated following the criteria proposed by Moriasi et al. [54], based on three statistical methods: Nash-Sutcliffe efficiency (NSE; [55]), percent bias (PBIAS, %; [56]) and the ratio of the root mean square error to standard deviation (RSR) (Equations 1, 2 and 3).
| NSE=1−∑ni=1(Ym−Ys)2∑ni=1(Ym−ˉY)2 | (1) |
| PBIAS=∑ni=1(Ym−Ys)∗100∑ni=1(Ym) | (2) |
| RSR=√∑ni=1(Ym−Ys)2√∑ni=1(Ym−ˉY)2 | (3) |
where Ym is the measured value and Ys is the simulated value with the model, and (Ȳ) is the mean of the measured values of each of the parameters analyzed. In order to analyze soil erosion under different climate scenarios two different rainfall distributions were considered. The simulations were based on two years with annual rainfall close to the average: one year with annual rainfall of 555.8 mm, in which rainfall was mainly concentrated in spring (41%) and autumn (34%) and another year with annual rainfall of 509 mm in which spring and autumn rainfall represented 37 and 43% of annual rainfall, respectively. The predicted changes for the climate change scenario and for different time periods were applied two both years in order to ascertain their effects on runoff and erosion rates. Additionally, increases of 10 and 20% were considered based on the trends observed in the area of study [5].
Drainageterraces (locally known as “rases”) were soil conservation measures used in the past in this viticulture area. However, in the new vineyard planted for management with machinery these practices were eliminated. Their construction does not reduce soil cultivation surface as they can be constructed between vine rows. In order to find a suitable design for the area, according to the slope of the terrain and the rainfall characteristics, a previous study carried out in the area [57], based on the limits of soil loss tolerance, was taken into consideration. Based on the average land slope, the optimum horizontal distance between terraces should be about 28 m. Given the plantation pattern, with 3 m between rows, a separation between terraces of 30 m was established while the width of the terraces was 3 m. The slope was modified according to that design. Other parameters of terrace design, such as the shape and the capacity of the terraces to carry the peak flow rate should be defined when constructing them, but these parameters are not considered as input data in the model. The terraces must be constructed across the slope on a contour. In the study plot, the vine rows are not planted following this logic in all plot. Figure 2 shows the present direction of the vine rows and the proposed location of the terraces in the vineyard studied. Thus the construction of the terraces could be not constructed at relatively low cost at present but it should be considered in a new vineyard replanting.
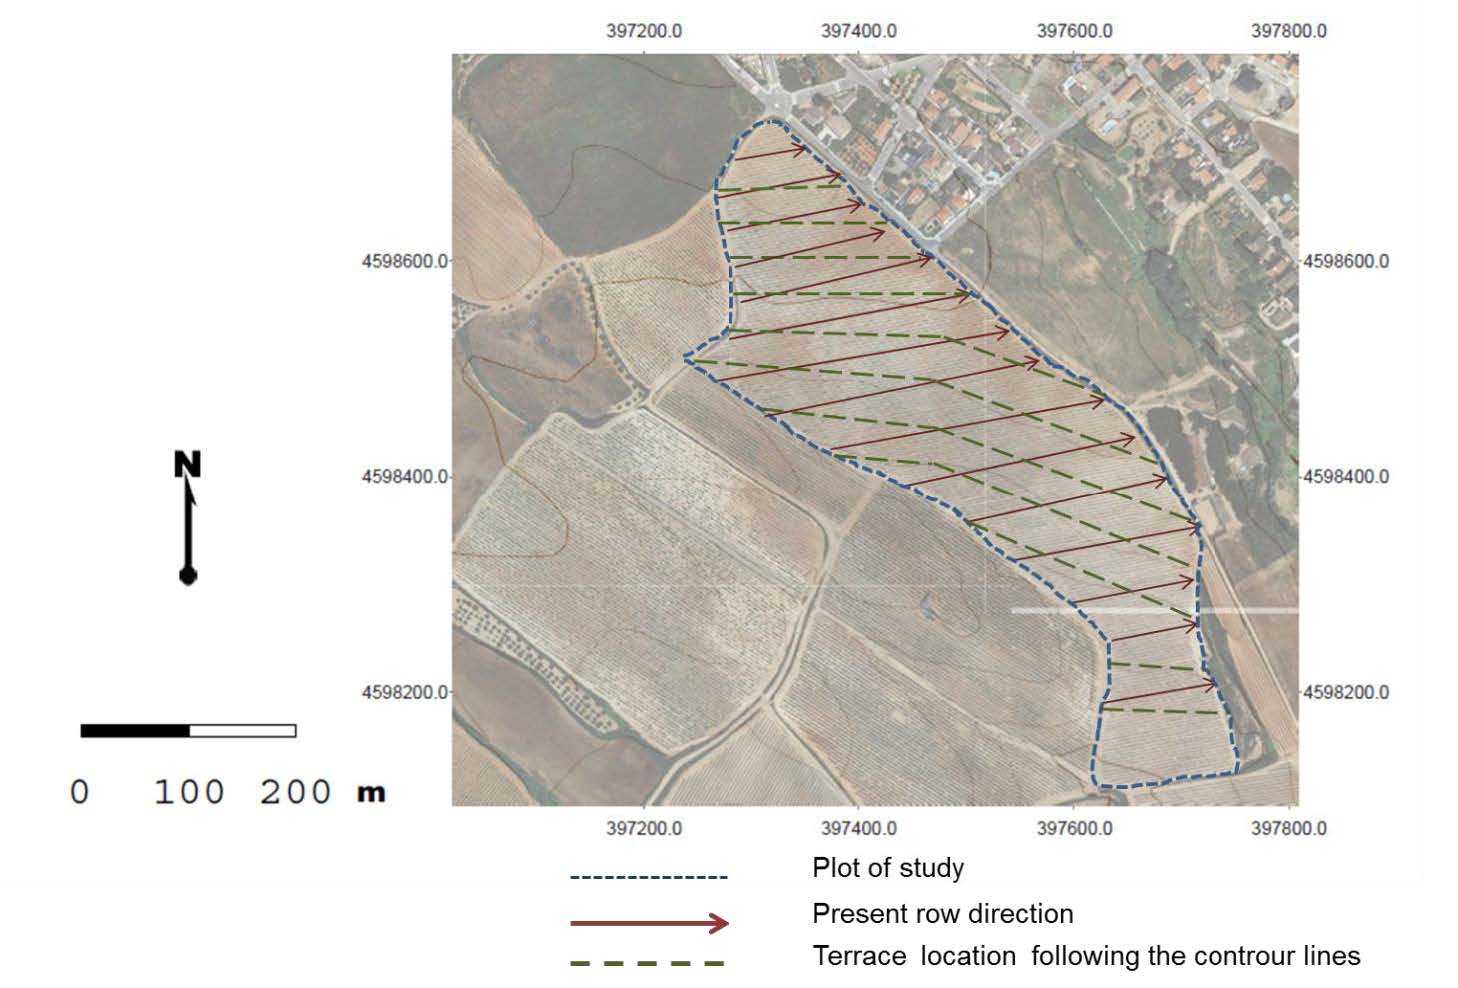 Figure 2. Present vine row direction and optimum direction of the drainage terraces in the plot of study.
Figure 3 shows the precipitation and average soil moisture recorded during the years analyzed. Within the period analyzed rainfall varied between 509 and 555.8 mm. In 2010, ten events produced runoff, which accounted for about 26% of rainfall. Most runoff was recorded in summer and in autumn. In one event in summer recorded 75% of rainfall run off. In 2011, 21 events with more than 9 mm were recorded, but only seven of them produced runoff and erosion. The rainfall recorded in those events represented 41% of annual rainfall and 25% of rainfall run off. In 2012, rainfall was mainly distributed in spring and autumn and 20 events produced runoff. Runoff represented about 22% of annual rainfall distributed in all seasons of the year. Annual soil losses ranged between 6.8 Mg ha−1 in 2012 and about 10 Mg ha−1 in 2011. Most soil losses were recorded in a small number of events. During the years analyzed, the highest erosive event was recorded in the summer of 2010, in which 50% of annual soil losses were recorded. In 2011 soil losses were mainly recorded in spring and summer. In 2012, there were no extremely erosive events. Soil losses were distributed throughout the year although the highest soil losses were recorded in spring (66% of annual erosion).
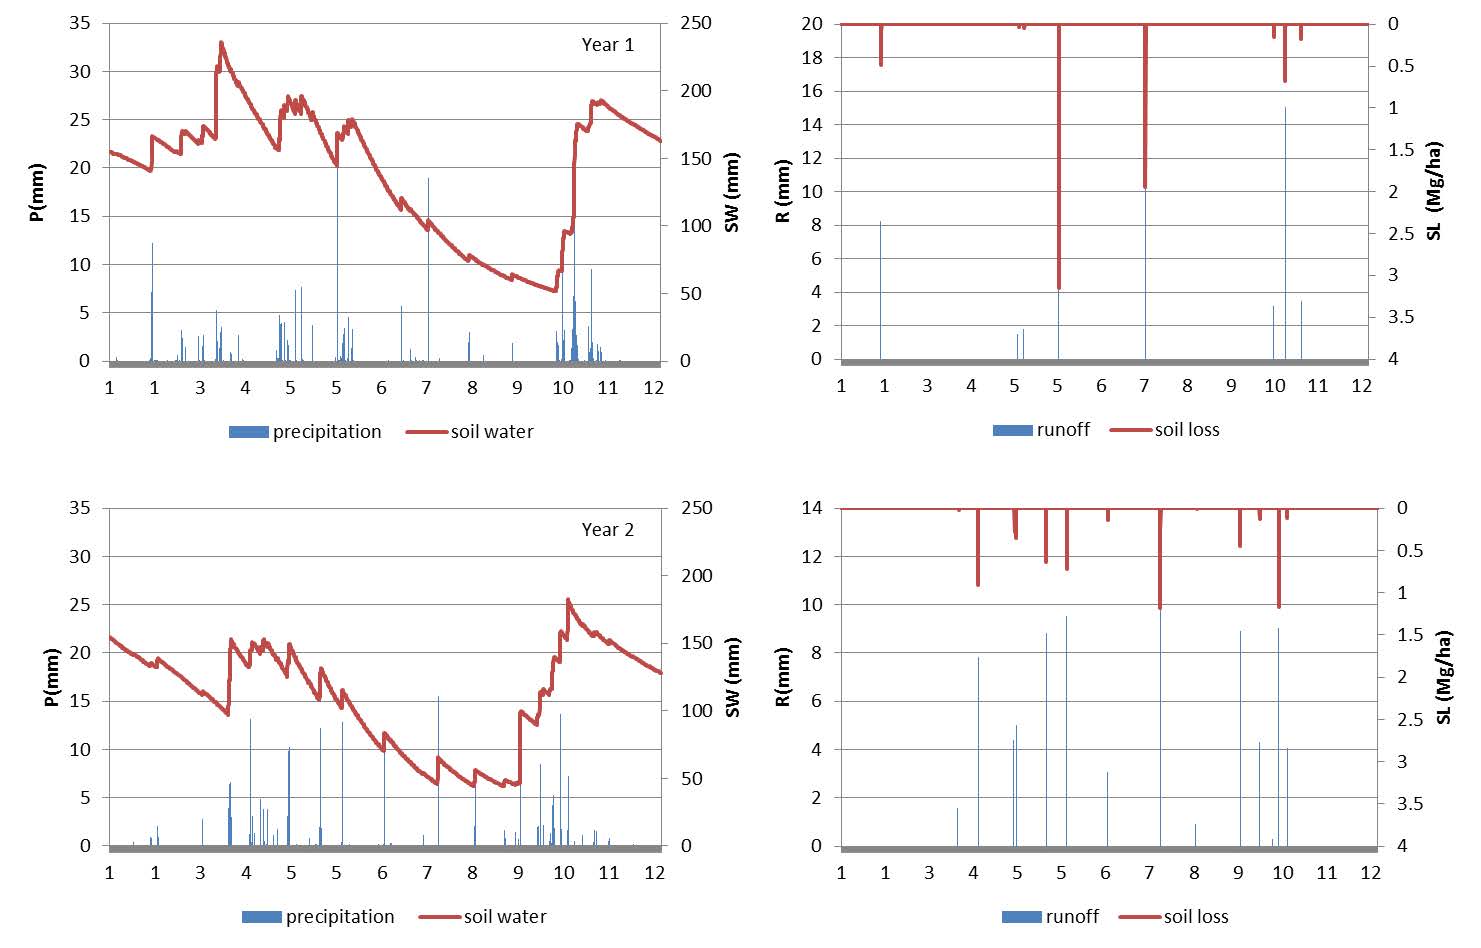 Figure 3. Precipitation, soil moisture, runoff and soil losses simulated for the selected years.
Figure 4 shows the comparison between runoff and soil loss measured and simulated with WEPP used for the erosive events recorded during the calibration and validation periods. The main rainfall events were simulated. However, the simulated runoff rates were smaller than the values measured in those events in which rainfall was concentrated in a limited number of hours. For soil erosion, the model simulated detachment but there was no deposition in any case. The simulated values were slightly smaller than the values measured for most cases, with greater differences in the extreme events. Table 4 shows the statistics used to analyze the performance of the model for both periods (calibration and validation). According to the criteria proposed by Moriasi et al. [54], the performance of the model may be considered good for runoff and sediment yield based on NSE, RSR and PBIAS (NSE > 0.65, RSR > 0.60 and PBIAS < 15% for runoff and 25% for sediment) during the calibration period and satisfactory during the validation period (NSE > 0.65, RSR < 0.70 and PBIAS < 25% for runoff and 6.75% for sediment).
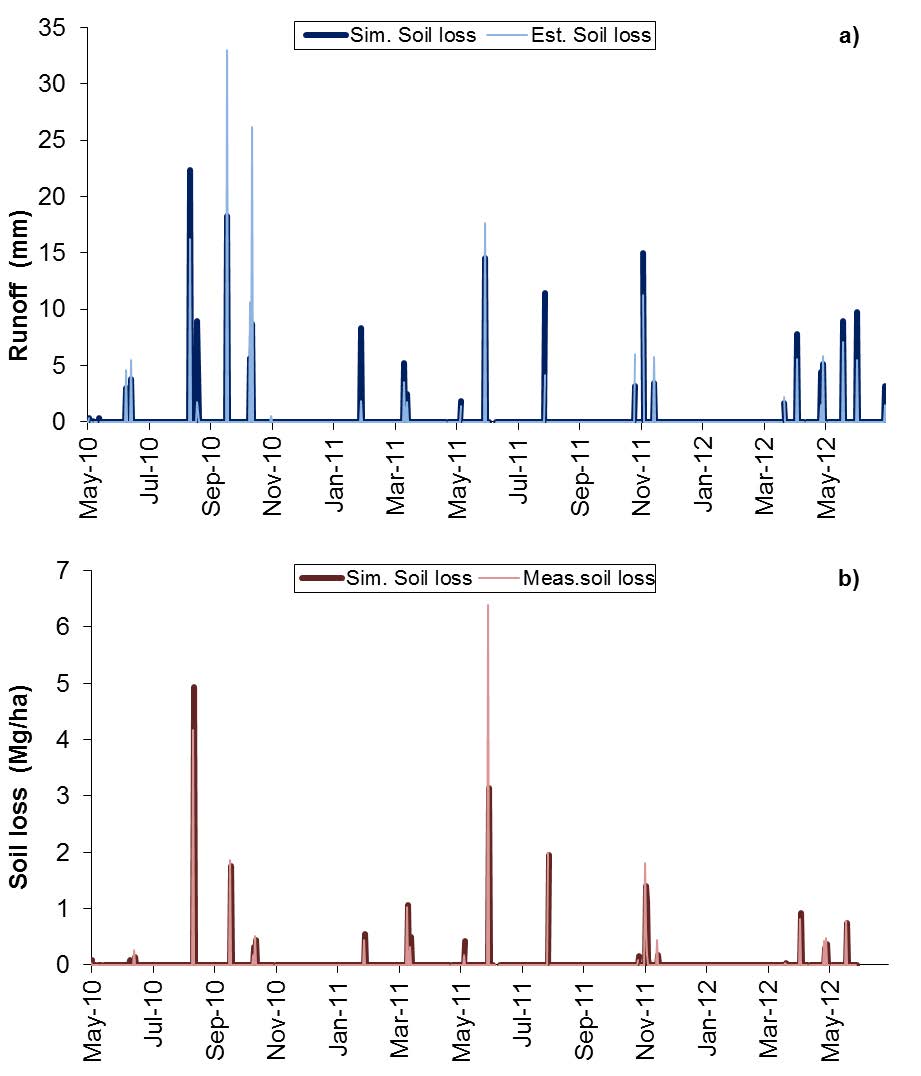 Figure 4. Runoff (a) and soil loss (b) measured and simulated with WEPP for the erosive events recorded during the calibration and validation periods.
| Calibration | Validation | |||||
| RSR | NSE | PBIAS | RSR | NSE | PBIAS | |
| Runoff | 0.858 | 0.711 | -9.582 | 0.532 | 0.786 | 14.733 |
| Soil losses | 0.521 | 0.828 | -25.135 | 0.810 | 0.718 | -6.667 |
DownLoad: CSVAfter validation of the model, runoff and erosion rates were simulated for the years 2011 and 2013, which were the years for which the climate change analyses were analyzed. The recorded rainfall and the simulated runoff, soil water and soil losses for each year are presented in Figure 3. It can be observed how rainfall amount and distribution have a clear effect not only on soil water but also on runoff and erosion rates. In year 1, total rainfall was slightly higher than in year 2, but the most relevant aspect was its distribution. In year 1 it was more concentrated in spring and autumn while in year 2 it was more homogeneously distributed in spring, summer and autumn and the contribution of single events was smaller. The contribution of each event to annual soil losses was smaller in year 2 than in year 1. The annual and seasonal results are summarized in Tables 5 and 6.
| Year-scenario | Period | Rainfall (mm) | Infilt. (mm) | Evap. (mm) | Deep percol. (mm) | Runoff (mm) | Soil water (mm) | Soil loss (Mg ha-1) |
| Year 1-present | Annual | 555.10 | 493.99 | 438.44 | 49.21 | 59.24 | 140.91 | 9.55 |
| Winter | 60.70 | 52.17 | 58.22 | 7.36 | 8.28 | 161.67 | 0.75 | |
| Spring | 232.50 | 213.82 | 175.70 | 33.35 | 17.87 | 182.92 | 4.30 | |
| Summer | 71.20 | 59.25 | 152.00 | 2.37 | 11.43 | 119.29 | 2.59 | |
| Autumn | 190.70 | 168.75 | 52.54 | 6.14 | 21.66 | 99.78 | 1.91 | |
| Year 1-2030 | Annual | 536.31 | 479.41 | 429.21 | 40.99 | 56.90 | 137.73 | 7.94 |
| Winter | 58.74 | 51.28 | 59.23 | 8.11 | 7.46 | 162.53 | 0.64 | |
| Spring | 211.84 | 196.96 | 172.56 | 23.59 | 14.88 | 177.45 | 3.37 | |
| Summer | 59.15 | 51.65 | 145.40 | 1.47 | 7.50 | 112.37 | 1.12 | |
| Autumn | 206.57 | 179.53 | 52.01 | 7.83 | 27.05 | 98.72 | 2.82 | |
| Year 1-2030+i10 | Annual | 536.31 | 465.25 | 423.82 | 36.13 | 71.86 | 135.72 | 9.62 |
| Winter | 58.74 | 48.17 | 58.31 | 6.64 | 8.71 | 160.04 | 0.75 | |
| Spring | 211.84 | 196.15 | 172.00 | 22.59 | 18.53 | 176.75 | 4.34 | |
| Summer | 59.15 | 49.18 | 143.16 | 1.35 | 7.45 | 110.67 | 2.62 | |
| Autumn | 206.57 | 171.74 | 50.35 | 5.56 | 37.17 | 95.50 | 1.91 | |
| Year 1-2030+i20 | Annual | 536.31 | 431.29 | 409.42 | 25.80 | 78.40 | 130.84 | 11.73 |
| Winter | 58.74 | 45.83 | 56.89 | 4.64 | 9.29 | 155.70 | 0.84 | |
| Spring | 211.84 | 184.91 | 166.76 | 17.39 | 21.70 | 171.75 | 4.83 | |
| Summer | 59.15 | 42.79 | 139.28 | 1.04 | 10.42 | 107.65 | 1.10 | |
| Autumn | 206.57 | 157.77 | 46.49 | 2.74 | 36.98 | 88.35 | 4.95 | |
| Year 1-2050 | Annual | 502.60 | 453.20 | 414.20 | 34.00 | 47.92 | 131.80 | 6.28 |
| Winter | 62.20 | 53.10 | 60.50 | 6.90 | 8.85 | 160.70 | 0.73 | |
| Spring | 188.70 | 179.30 | 169.90 | 21.00 | 8.68 | 173.40 | 1.75 | |
| Summer | 48.80 | 44.50 | 135.20 | 0.70 | 3.92 | 102.20 | 0.31 | |
| Autumn | 202.90 | 176.30 | 48.60 | 5.50 | 26.47 | 91.20 | 3.49 | |
| Year 1-2050+i10 | Annual | 502.60 | 438.27 | 406.56 | 31.12 | 62.02 | 129.50 | 8.37 |
| Winter | 62.20 | 52.51 | 59.61 | 5.72 | 9.99 | 158.30 | 0.98 | |
| Spring | 188.70 | 175.00 | 168.99 | 20.96 | 10.84 | 172.70 | 2.33 | |
| Summer | 48.80 | 41.43 | 130.99 | 0.51 | 4.55 | 99.10 | 0.41 | |
| Autumn | 202.90 | 169.34 | 46.96 | 3.93 | 36.64 | 88.10 | 4.65 | |
| Year 1-2050+i20 | Annual | 502.60 | 431.30 | 409.40 | 25.80 | 78.40 | 128.37 | 10.38 |
| Winter | 62.20 | 45.80 | 56.90 | 4.60 | 9.29 | 157.20 | 0.77 | |
| Spring | 188.70 | 184.90 | 166.80 | 17.40 | 21.70 | 172.35 | 4.34 | |
| Summer | 48.80 | 42.80 | 139.30 | 1.00 | 10.42 | 97.77 | 1.61 | |
| Autumn | 202.90 | 157.80 | 46.50 | 2.70 | 36.98 | 86.66 | 3.67 |
DownLoad: CSV| Year-scenario | Period | Rainfall (mm) | Infilt. (mm) | Evap. (mm) | Deep percol. (mm) | Runoff (mm) | Soil water (mm) | Soil loss (Mg ha-1) |
| Year 2-present | Annual | 530.5 | 435.4 | 412.4 | 44.40 | 92.60 | 117.80 | 7.28 |
| Winter | 14.5 | 12.3 | 62 | 12.8 | 0 | 136 | 0.00 | |
| Spring | 195 | 165 | 160.1 | 9.4 | 29 | 127.8 | 2.29 | |
| Summer | 93 | 63.1 | 114.6 | 0.2 | 27 | 70.1 | 2.39 | |
| Autumn | 228 | 195 | 75.7 | 22 | 36.6 | 110.2 | 2.59 | |
| Year 2-2020 | Annual | 510.7 | 428.3 | 407.8 | 47.7 | 81.12 | 109.4 | 6.67 |
| Winter | 11.8 | 11.7 | 62.9 | 12.5 | 0.00 | 136.4 | 0.00 | |
| Spring | 176.6 | 153.0 | 157.0 | 6.6 | 22.93 | 123.9 | 1.80 | |
| Summer | 77.6 | 59.8 | 111.1 | 0.1 | 17.61 | 66.9 | 1.31 | |
| Autumn | 244.7 | 203.9 | 76.8 | 28.4 | 40.58 | 110.8 | 3.56 | |
| Year 2-2020+i10 | Annual | 510.3 | 406.0 | 397.0 | 38.0 | 103.26 | 107.0 | 9.52 |
| Winter | 11.3 | 11.2 | 62.6 | 11.9 | 0.00 | 135.6 | 0.00 | |
| Spring | 176.3 | 146.6 | 154.8 | 6.0 | 29.06 | 122.5 | 2.60 | |
| Summer | 78.5 | 55.4 | 106.1 | 0.1 | 23.00 | 63.9 | 1.97 | |
| Autumn | 244.2 | 192.8 | 73.5 | 20.1 | 51.20 | 106.5 | 4.94 | |
| Year 2-2020+i20 | Annual | 509.7 | 382.9 | 385.0 | 29.0 | 125.79 | 104.2 | 12.95 |
| Winter | 11.8 | 11.7 | 62.3 | 11.1 | 0.00 | 134.6 | 0.00 | |
| Spring | 170.9 | 135.1 | 149.9 | 4.5 | 35.31 | 119.1 | 3.54 | |
| Summer | 83.0 | 54.6 | 102.7 | 0.1 | 28.24 | 61.8 | 2.75 | |
| Autumn | 244.0 | 181.6 | 70.2 | 13.4 | 62.23 | 101.9 | 6.65 | |
| Year 2-2050 | Annual | 437.2 | 390.7 | 390.4 | 31.1 | 45.41 | 103.6 | 3.14 |
| Winter | 12.0 | 11.9 | 64.1 | 11.2 | 0.00 | 134.6 | 0.00 | |
| Spring | 154.1 | 140.2 | 152.4 | 4.7 | 13.26 | 119.4 | 0.71 | |
| Summer | 59.6 | 52.6 | 104.4 | 0.1 | 6.87 | 61.4 | 0.32 | |
| Autumn | 211.5 | 186.1 | 69.5 | 15.2 | 25.28 | 99.6 | 2.10 | |
| Year 2-2050+i10 | Annual | 437.0 | 437.0 | 437.0 | 437.0 | 61.49 | 101.7 | 4.63 |
| Winter | 11.5 | 11.5 | 11.5 | 11.5 | 0.00 | 133.6 | 0.00 | |
| Spring | 154.3 | 154.3 | 154.3 | 154.3 | 18.05 | 118.3 | 1.14 | |
| Summer | 60.4 | 60.4 | 60.4 | 60.4 | 9.93 | 59.5 | 0.55 | |
| Autumn | 210.8 | 210.8 | 210.8 | 210.8 | 33.51 | 96.1 | 2.95 | |
| Year 2-2050+i20 | Annual | 436.1 | 356.4 | 372.3 | 20.4 | 78.87 | 99.3 | 6.48 |
| Winter | 12.0 | 11.9 | 63.2 | 9.8 | 0.00 | 132.4 | 0.00 | |
| Spring | 149.5 | 126.2 | 146.5 | 3.5 | 22.84 | 115.4 | 1.63 | |
| Summer | 64.0 | 50.4 | 98.1 | 0.0 | 13.46 | 57.7 | 0.84 | |
| Autumn | 210.6 | 167.9 | 64.5 | 7.0 | 42.57 | 92.3 | 4.02 |
DownLoad: CSVThe results of the simulations for the different climate scenarios (with additional increases of 10 and 20% for 2030 and 2050) are presented in the same tables. For both rainfall distributions (represented in the two analyzed years) the reduction in rainfall amount and the increase in temperature gave rise to a decrease in runoff and erosion rates. However, the effect of rainfall intensity increase was also evident, which is in agreement with the expected increase of erosion rates under the climate change scenario.
The predicted soil losses with and without terraces, for the analyzed scenarios (two different rainfall distributions and increasing intensities, for different time periods) are shown in Table 7. The average predicted reduction in soil losses associated with the construction of terraces ranged between 31 and 59%, with an average of 45%. The reduction in soil losses was mainly due to deposition within the fields, while in the situation without soil conservation measured, the simulated deposition was null.
| Year/scenario | Without terraces | With terraces | Year/scenario | Without terraces | With terraces | ||
| Year 1 | SL | SL | D (%) | Year 2 | SL | SL | D (%) |
| Year 1-present | 6.78 | 2.78 | 30 | Year 2-present | 9.55 | 3.92 | 39 |
| Year 1-2020 | 6.67 | 4.59 | 33 | Year 2-2020 | 7.94 | 5.46 | 31 |
| Year 1-2020_i10 | 9.51 | 6.58 | 39 | Year 2-2020_i10 | 8.8 | 6.08 | 30 |
| Year 1-2020_i20 | 12.95 | 8.83 | 32 | Year 2-2020_i20 | 11.73 | 7.01 | 40 |
| Year 1-2050 | 3.14 | 2.16 | 40 | Year 2-2050 | 5.35 | 2.72 | 41 |
| Year 1-2050_i10 | 4.63 | 2.35 | 22 | Year 2-2050_i10 | 8.37 | 5.76 | 32 |
| Year 1-2050_i20 | 6.48 | 2.66 | 21 | Year 2-2050_i20 | 10.38 | 4.26 | 35 |
DownLoad: CSVSoil losses recorded during the analyzed period were of the same order of magnitude as those observed in the area in previous years [8,10]. Annual soil losses were mainly recorded in a small number of events, with total values that exceed the soil loss tolerance rate established for Europe (0.3 to 1.4 Mg ha−1 yr−1) [58] and higher permissible values established for arable lands, which range between 2.2 and 12 Mg ha−1 yr−1 [59,60]. The results confirmed the importance of extreme events on runoff generation and on annual erosion rates. For example, threshold values are considered permissible.
The use of the Water Erosion Prediction Project (WEPP) gave satisfactory results to predict average annual soil losses. However, the model did not simulate all erosion events well, in particular those that generated very little runoff, and those that contributed more to total annual erosion. The former did not contribute significantly to total runoff and erosion. However, the most erosive events, which were usually concentrated in a short time interval and generated high runoff rates, were under-predicted. Nevertheless, the statistics used to analyze the performance of the model confirmed that the results could be considered satisfactory, taking into account that the calibration was carried out using daily data. Licciardello et al. [61] pointed out some limitations of the model when dry and wet conditions were considered together, and this could also be the reason for the lack of goodness of fit of all events. It can be observed that the statistics showed better fit for the validation than for the calibration period, which may seem strange. This result was attributed to the fact that during the validation period no extreme events were recorded. Despite these limitations, the model may be useful to compare the response regarding soil losses under different rainfall distributions and those that may be produced under different climate change scenarios.
The simulated trends in precipitation associated with climate change for the study area showed a decrease in rainfall for the coming decades, with a greater decrease for 2050 than for 2030. However, due to the different trends in spring and autumn, the two main rainfall periods in the area of study, the effect may be different from year to year. For the years analyzed, spring rainfall decreased while autumn rainfall increased. The simulation of the erosion rates responded to the changes in runoff, which were affected by less water availability due to temperature increase. For the 2030 scenario, runoff volumes decreased between 4 and 8%, while erosion rates decreased 2 and 16% respectively. For the 2050 scenario, however, the differences in runoff between years were greater. Runoff rates decreased between 19.1 and 50.1% in the 2050 scenario, while erosion rates decreased between 34 and 56%. Despite the expected increase in erosion rates with climate change, for both rainfall distributions the simulation showed a decrease in soil losses. Similar results have also been indicated by other researches [33,34]. These authors simulated changes in erosion rates of similar magnitude for Greece and for Ireland under climate change scenario A. This means that additional factors may condition soil losses that were not included in the simulation. In this respect, some studies indicate that although changes in soil erosion are driven by changes in rainfall, they may be affected by complex interactions including changes in rainfall distribution and intensity and in land use and management, which should be considered when the effects of climate change are considered [35,36,37]. In this respect Routschek et al. [62] indicate that the impacts of land use, soil management and soil properties on soil erosion by water are greater than the effects of changing precipitation patterns. In the study area, vine cultivation has been the main land use for centuries and at present it is a strong economic motor. Management practices have changed during recent decades, but there is no perspective of change in the midterm to a different land use or to dedicate the land to other activities. The main changes suffered in the area, associated with labor mechanization, has implied an increase of soil degradation and soil losses [7,63], and for this reason knowledge of additional potential effects is needed in order to establish new control measures.
One of the main changes in precipitation associated with climate change is the increasing strength and erosivity of rainfall events [64,65,66]. Evidence recorded in the area in different observatories during recent decades shows an increase in the maximum intensity of erosive events. The increase varied between observatories between about 12 and 20% [5]. The increase in rainfall erosivity has also been confirmed in other areas of Spain [67] in which erosion processes seem to increase, and also in other areas around the world [68,69,70]. In this respect, Shiono et al. [68] indicated an expected increase of 20% in the R-values compared with those in the recent past and predicted average erosion rates greater than 20% based just on the effects of the rainfall erosivity factor.
The simulations carried out in this study with increasing rainfall intensities, for the different scenarios confirmed the effect of intensity on soil erosion with significant increases in erosion rates. The results showed that the erosion rates for the 2030 scenario, may be up to 21.8% higher than at present considering an increase of 10% in rainfall intensity and up to 47% higher when rainfall intensity increased by 20%, for one of the rainfall distributions. For the second rainfall distribution, soil losses may be up to 46 and 95%, respectively for an increase of 10 and 20% in rainfall intensity. For the 2050 scenario, the increase of soil erosion rates could reach 100% in relation to the predicted values without rainfall intensity change. Despite the decrease in precipitation, erosion rates may increase due to the effect of the extreme events. Under the two analyzed rainfall distributions, the results of the simulation reached higher annual soil losses, than the soil loss tolerance. Thus, under the hypothesis of an increase of these situations associated with climate change, the high erosion rates point out the need for establishing some soil conservation measures.
The simulation of the soil terrace effect on soil losses confirmed its benefits. For the existing vine plantation pattern and the slope of the terrain, the construction of drainage terraces, 3 m width and spaced 30 m, i.e. every 10 vine rows, would reduce soil losses by about 45%, on average. The deposition simulated with the model was in agreement with observations carried out in the same area, where terraces were already constructed [11]. The function of the terraces was not only to evacuate the excess of runoff but to retain some of the sediments produced along the slope and prevent their removal from the field. The lowest reductions were observed in the driest situations and with the lowest erosion rates. The results of the simulation, regarding the reduction of soil losses, were in agreement with previous simulations make at catchment scale using SWAT [71] and with those simulated or observed by other authors. Yang et al. [72] indicated a sediment yield reduction of about 56% when applying flow diversion terraces separated uniformly 60 m on slopes ranging between 3 and 8%. Even higher reductions in soil losses have been simulated. Thus Mwangui et al. [73] indicated that the introduction of parallel terraces reduced sediment losses by 85% and decreased surface runoff by 22%. Even higher reductions were found when contour planting is associated with terracing [74]. However, the effect of terraces may depend on the actual design of the terrace [75].
The results confirmed the difficulties for obtaining predictions for soil erosion processes due to the high variability of rainfall recorded in Mediterranean conditions as well as the contributions of extreme events to annual soil losses. Soil losses simulated under the predicted trends in precipitation and temperature may give rise to higher erosion than at present for certain rainfall distributions when increasing rainfall intensity is considered. A 10% increase in rainfall may result in soil losses up to 40% higher. Under these scenarios, there is a need to implement some soil conservation measures to reduce soil losses. The construction of drainage terraces, perpendicularly to the maximum slope, 3 m in width and separated 30 m between terraces may reduce soil losses significantly (up to about 45%).
This work is part of research project AGL2009-08353 which was funded by the Spanish Ministry of Science and Innovation. I would like to thank the Castell d’Age winery for their support for allowing us to carry out the field experiments on their property.
This research article has received a grant for its linguistic revision from the Language Institute of the University of Lleida (2016 call)
Author declare no conflicts of interest in this paper.
| [1] |
Bhowmik D, Wang X, et al. (2013) Does combination pharmacological intervention for smoking cessation prevent post-cessation weight gain? A systemic review. Addict Behav 38: 1865-1875. doi: 10.1016/j.addbeh.2012.11.007

|
| [2] | Bastida G, Beltrán B (2011) Ulcerative colitis in smokers, non-smokers and ex-smokers. World J Gastr 17: 2740-2747. |
| [3] |
Independent UK Panel on Breast Cancer Screening (2012) The benefits and harms of breast cancer screening: an independent review. Lancet 380: 1778-1786. doi: 10.1016/S0140-6736(12)61611-0
|
| [4] |
Antithrombotic Trialists' (ATT) Collaboration, Baigent C, Blackwell L, et al. (2009) Aspirin in the primary and secondary prevention of vascular disease: collaborative meta-analysis of individual participant data from randomised trials. Lancet 373: 1849-1860. doi: 10.1016/S0140-6736(09)60503-1
|
| [5] |
Rothwell PM, Price JF, Fowkes FG, et al. (2012) Short-term effects of daily aspirin on cancer incidence, mortality, and non-vascular death: analysis of the time course of risks and benefits in 51 randomised controlled trials. Lancet 379:1602-1612. doi: 10.1016/S0140-6736(11)61720-0
|
| [6] | Morgan G, Elwood P (2011) Aspirin bleeding in perspective. Qual Primary Care 19: 251-253. |
| [7] | Baigent C (2005) Aspirin for all over 50? (against) Brit Med J; 1440-1443. |
| [8] | Elwood P, Morgan G, et al. (2005) Aspirin for all over 50? (for) Brit Med J: 1440-1441. |
| [9] | Elwood P, Morgan G, et al. (2011) Aspirin taking in a south-Wales country. Br J Cardiology 18: 238-240. |
| [10] | Elwood P, Longley M (2010) My health: whose responsibility? A jury decides. |
| [11] | J Epidemiol Community Health 64: 761-764. |
| [12] | 11. Kurth T (20 Aspirin and cancer prevention. Brit Med J 344; Available from: http://www.who.int/tobacco/research/cessation/en/ |
| 1. | Arianna Bozzolo, Diego Pizzeghello, Alessandra Cardinali, Ornella Francioso, Serenella Nardi, Effects of moderate and high rates of biochar and compost on grapevine growth in a greenhouse experiment, 2017, 2, 2471-2086, 113, 10.3934/agrfood.2017.1.113 | |
| 2. | Giorgia Bagagiolo, Marcella Biddoccu, Danilo Rabino, Eugenio Cavallo, Effects of rows arrangement, soil management, and rainfall characteristics on water and soil losses in Italian sloping vineyards, 2018, 166, 00139351, 690, 10.1016/j.envres.2018.06.048 | |
| 3. | Jules Rutebuka, Desire Mbarushimana Kagabo, Ann Verdoodt, Farmers’ diagnosis of current soil erosion status and control within two contrasting agro-ecological zones of Rwanda, 2019, 278, 01678809, 81, 10.1016/j.agee.2019.03.016 | |
| 4. | Anton Pijl, Edoardo Quarella, Teun A. Vogel, Vincenzo D’Agostino, Paolo Tarolli, Remote sensing vs. field-based monitoring of agricultural terrace degradation, 2021, 9, 20956339, 1, 10.1016/j.iswcr.2020.09.001 | |
| 5. | M.C. Ramos, Projection of phenology response to climate change in rainfed vineyards in north-east Spain, 2017, 247, 01681923, 104, 10.1016/j.agrformet.2017.07.022 | |
| 6. | Tugrul Yakupoglu, Recep Gundogan, Turgay Dindaroglu, Kadir Kusvuran, Veysel Gokmen, Jesus Rodrigo-Comino, Yeboah Gyasi-Agyei, Artemi Cerdà, Tillage Impacts on Initial Soil Erosion in Wheat and Sainfoin Fields under Simulated Extreme Rainfall Treatments, 2021, 13, 2071-1050, 789, 10.3390/su13020789 | |
| 7. | Belén Cárceles Rodríguez, Víctor Hugo Durán Zuazo, Miguel Soriano Rodríguez, Pedro Cermeño Sacristán, Baltasar Gálvez Ruiz, Rosa Carbonell-Bojollo, Rafaela Ordoñez-Fernández, Iván Francisco García-Tejero, 2020, Chapter 13, 978-981-15-6952-4, 427, 10.1007/978-981-15-6953-1_13 | |
| 8. | Khaldoon Al Qudah, Qasem Abdelal, Catreena Hamarneh, Nizar Abu-Jaber, Taming the torrents: The hydrological impacts of ancient terracing practices in Jordan, 2016, 542, 00221694, 913, 10.1016/j.jhydrol.2016.09.061 | |
| 9. | Víctor Hugo Durán Zuazo, Carmen Rocío Rodríguez Pleguezuelo, Belén Cárceles Rodríguez, Baltasar Gálvez Ruiz, Saray Gutiérrez Gordillo, Pedro Cermeño Sacristán, Simón Cuadros Tavira, Iván Francisco García-Tejero, 2020, Chapter 7, 978-981-13-8569-8, 231, 10.1007/978-981-13-8570-4_7 | |
| 10. | Audrey Naulleau, Christian Gary, Laurent Prévot, Laure Hossard, Evaluating Strategies for Adaptation to Climate Change in Grapevine Production–A Systematic Review, 2021, 11, 1664-462X, 10.3389/fpls.2020.607859 | |
| 11. | Juraj Lieskovský, Pavol Kenderessy, Degradation of traditional vineyards in Slovakia by abandonment and soil erosion: A case‐study of Vráble, 2023, 34, 1085-3278, 98, 10.1002/ldr.4446 | |
| 12. | Tizita Endale, Jan Diels, Dereje Tsegaye, Alemayehu Kassaye, Liuelsegad Belayneh, Ann Verdoodt, Farmer-science-based soil degradation metrics guide prioritization of catchment-tailored control measures, 2023, 45, 22114645, 100783, 10.1016/j.envdev.2022.100783 | |
| 13. | Emanuela Cicinelli, Giulia Caneva, Valentina Savo, Risk factors and plant management activities for the terraced agricultural systems on the Amalfi coast (Italy): an interdisciplinary approach, 2021, 32, 2037-4631, 761, 10.1007/s12210-021-01018-9 | |
| 14. | Maria Silvia Pinna, Maria Cecilia Loi, Giulia Calderisi, Giuseppe Fenu, Extremes Rainfall Events on Riparian Flora and Vegetation in the Mediterranean Basin: A Challenging but Completely Unexplored Theme, 2022, 14, 2073-4441, 817, 10.3390/w14050817 |

Gareth Morgan. Does Utilitarian Policy such as Smoking Cessation Lend Support to Wider Aspirin Use?[J]. AIMS Public Health, 2015, 2(2): 223-226. doi: 10.3934/publichealth.2015.2.223

| Area | Clay % | Silt % | Sand % | O.M. % | Bulk density kg m-3 | pH | FC (-33 kPa) % | PWP (-1500 kPa) % | Infiltration rates mm h-1 |
| 1 | 8.5 ± 4.6 | 22.9 ± 4.6 | 68.6 ± 8.8 | 1.18 ± 0.37 | 1545 ± 120 | 8.53 | 19.55 | 6.25 | 27 |
| 2 | 4.5 ± 3.0 | 13.6 ± 2.1 | 81.9 ± 4.6 | 1.32 ± 0.22 | 1670 ± 55 | 8.55 | 16.11 | 5.27 | 28 |
| 3 | 5.0 ± 2.3 | 17.9 ± 3.9 | 77.1 ± 6.0 | 1.37 ± 0.21 | 1420 ± 89 | 8.66 | 21.89 | 7.24 | 10.3 |
DownLoad: CSV| Jan | Feb | Mar | Apr | May | Jun | Jul | Aug | Sep | Oct | Nov | Dec | |
| 2030 | ||||||||||||
| Tmax ( ℃) | 0.694 | 0.816 | 1.147 | 0.894 | 1.034 | 1.372 | 1.675 | 2.248 | 1.647 | 1.552 | 0.613 | 0.573 |
| Tmin ( ℃) | 0.639 | 0.630 | 0.769 | 0.643 | 0.863 | 1.028 | 1.290 | 1.868 | 1.347 | 1.517 | 0.674 | 0.388 |
| SR (W/m2) | 0.129 | 0.076 | 7.606 | 4.600 | -0.303 | 11.748 | 14.851 | 11.003 | 6.296 | -0.354 | 0.321 | 0.170 |
| P (%) | -3.64 | -4.17 | -15.92 | -5.12 | -9.10 | -17.98 | -25.08 | -13.74 | -0.40 | 24.95 | 6.38 | -4.03 |
| RH (fraction) | 0.49 | -0.56 | -2.65 | -2.37 | -0.41 | -1.75 | -2.52 | -2.21 | -1.89 | -0.36 | -1.62 | -1.30 |
| WV (%) | -1.65 | 0.61 | 0.00 | 4.04 | -1.70 | 1.83 | 1.80 | -1.62 | 0.70 | -0.75 | 2.87 | 2.65 |
| 2050 | ||||||||||||
| Tmax ( ℃) | 1.450 | 1.888 | 1.633 | 1.461 | 1.831 | 2.438 | 3.360 | 4.198 | 3.129 | 2.251 | 1.628 | 1.388 |
| Tmin ( ℃) | 1.215 | 1.719 | 1.455 | 1.054 | 1.363 | 1.832 | 2.366 | 2.982 | 2.499 | 2.157 | 1.705 | 1.326 |
| SR (W/m2) | -0.142 | -1.047 | 5.286 | 8.094 | 6.182 | 10.937 | 22.325 | 20.637 | 12.504 | 1.366 | 0.442 | -1.647 |
| P (%) | 1.86 | 3.18 | -12.32 | -17.37 | -23.41 | -23.65 | -32.91 | -31.91 | -25.91 | 9.14 | 6.17 | 1.86 |
| RH (fraction) | -0.75 | -0.84 | -2.86 | -3.16 | -2.32 | -2.24 | -4.13 | -5.46 | -4.18 | -1.58 | -1.70 | -0.99 |
| WV (%) | 1.48 | -0.58 | 3.08 | 1.34 | 1.69 | 0.49 | -3.29 | -4.20 | -3.46 | -0.63 | -1.29 | -1.30 |
DownLoad: CSV| Initial conditions | Values | Plant growth and harvest parameters | Values |
| Bulk density after last tillage (g/cm3) | 1.5 | Biomass energy ratio (kg/MJ) | 30 |
| Initial canopy cover (%) | 10 | Growing degree days to emergence (dgd) | 30 |
| Days since last harvest (days) | 180 | Growing degree days for growing season (gdd) | 2000 |
| Days since last tillage (days) | 30 | In-row plant spacing (m) | 3 |
| Initial interril cover (%) | 10 | Plant stem diameter at maturity (cm) | 5 |
| Initial residue cropping system | 0 | Harvest index (dry crop yield/ total above ground biomass) (%) | 50 |
| Cummulative rainfall since last tillage | 200 | ||
| Initial ridge height since the last tillage (cm) | 2 | Canopy, LAI and Root Parameters | |
| Initial rill cover (%) | 10 | Canopy cover coefficient | 14 |
| Initial roughness after last tillage (cm) | 1 | Parameter value for canopy height equation | 23 |
| Rill spacing (m) | 0 | Maximum canopy height (m) | 2 |
| Rill width type | Temporary | Maximum leaf area index | 6 |
| Depth secondary tillage layer (cm) | 35 | Maximum root depth (m) | 1.5 |
| Depth primary tillage layer (cm) | 20 | Root to shoot ratio | 0.3 |
| Initial rill width (cm) | 2 | Maximum root mass for perennial crop (kg/m2) | 0.6 |
| Initial total dead root mass (kg/m2) | 0.5 | ||
| Initial total submerged residue mass (kg/m2) | 0.2 | ||
| Temperature and radiation parameters | |||
| Base daily air temperature ( ℃) | 10 | ||
| Optimal temperature for plant growth ( ℃) | 25 | ||
| Maximum temperature that stops the growth ( ℃) | 35 | ||
| Critical freezing temperature ( ℃) | -40 | ||
| Radiation extinction coefficient | 0.65 | ||
| Management | S, Ch, C | ||
| Plant beginning | Apr 1st | ||
| Tillage information | |||
| Subsoil-chisel (S) | Jan 15th | Mean tillage depth (cm) | 20, 20, 10 |
| Chisel plow, rolling dick (Ch) | Feb 15th | Fraction of surface area disturbed (%) | 100, 100, 95 |
| Apr 1st | Random roughness value after tillage (cm) | 1.5, 1.5, 1.5 | |
| Cultivator (C) | May 20th | Ridge interval (cm) | 7.5, 30, 75 |
| Jun 20th | Ridge height value after tillage (cm) | 100, 5, 15 | |
| Harvest-Annual | Sep 10th |
DownLoad: CSV| Calibration | Validation | |||||
| RSR | NSE | PBIAS | RSR | NSE | PBIAS | |
| Runoff | 0.858 | 0.711 | -9.582 | 0.532 | 0.786 | 14.733 |
| Soil losses | 0.521 | 0.828 | -25.135 | 0.810 | 0.718 | -6.667 |
DownLoad: CSV| Year-scenario | Period | Rainfall (mm) | Infilt. (mm) | Evap. (mm) | Deep percol. (mm) | Runoff (mm) | Soil water (mm) | Soil loss (Mg ha-1) |
| Year 1-present | Annual | 555.10 | 493.99 | 438.44 | 49.21 | 59.24 | 140.91 | 9.55 |
| Winter | 60.70 | 52.17 | 58.22 | 7.36 | 8.28 | 161.67 | 0.75 | |
| Spring | 232.50 | 213.82 | 175.70 | 33.35 | 17.87 | 182.92 | 4.30 | |
| Summer | 71.20 | 59.25 | 152.00 | 2.37 | 11.43 | 119.29 | 2.59 | |
| Autumn | 190.70 | 168.75 | 52.54 | 6.14 | 21.66 | 99.78 | 1.91 | |
| Year 1-2030 | Annual | 536.31 | 479.41 | 429.21 | 40.99 | 56.90 | 137.73 | 7.94 |
| Winter | 58.74 | 51.28 | 59.23 | 8.11 | 7.46 | 162.53 | 0.64 | |
| Spring | 211.84 | 196.96 | 172.56 | 23.59 | 14.88 | 177.45 | 3.37 | |
| Summer | 59.15 | 51.65 | 145.40 | 1.47 | 7.50 | 112.37 | 1.12 | |
| Autumn | 206.57 | 179.53 | 52.01 | 7.83 | 27.05 | 98.72 | 2.82 | |
| Year 1-2030+i10 | Annual | 536.31 | 465.25 | 423.82 | 36.13 | 71.86 | 135.72 | 9.62 |
| Winter | 58.74 | 48.17 | 58.31 | 6.64 | 8.71 | 160.04 | 0.75 | |
| Spring | 211.84 | 196.15 | 172.00 | 22.59 | 18.53 | 176.75 | 4.34 | |
| Summer | 59.15 | 49.18 | 143.16 | 1.35 | 7.45 | 110.67 | 2.62 | |
| Autumn | 206.57 | 171.74 | 50.35 | 5.56 | 37.17 | 95.50 | 1.91 | |
| Year 1-2030+i20 | Annual | 536.31 | 431.29 | 409.42 | 25.80 | 78.40 | 130.84 | 11.73 |
| Winter | 58.74 | 45.83 | 56.89 | 4.64 | 9.29 | 155.70 | 0.84 | |
| Spring | 211.84 | 184.91 | 166.76 | 17.39 | 21.70 | 171.75 | 4.83 | |
| Summer | 59.15 | 42.79 | 139.28 | 1.04 | 10.42 | 107.65 | 1.10 | |
| Autumn | 206.57 | 157.77 | 46.49 | 2.74 | 36.98 | 88.35 | 4.95 | |
| Year 1-2050 | Annual | 502.60 | 453.20 | 414.20 | 34.00 | 47.92 | 131.80 | 6.28 |
| Winter | 62.20 | 53.10 | 60.50 | 6.90 | 8.85 | 160.70 | 0.73 | |
| Spring | 188.70 | 179.30 | 169.90 | 21.00 | 8.68 | 173.40 | 1.75 | |
| Summer | 48.80 | 44.50 | 135.20 | 0.70 | 3.92 | 102.20 | 0.31 | |
| Autumn | 202.90 | 176.30 | 48.60 | 5.50 | 26.47 | 91.20 | 3.49 | |
| Year 1-2050+i10 | Annual | 502.60 | 438.27 | 406.56 | 31.12 | 62.02 | 129.50 | 8.37 |
| Winter | 62.20 | 52.51 | 59.61 | 5.72 | 9.99 | 158.30 | 0.98 | |
| Spring | 188.70 | 175.00 | 168.99 | 20.96 | 10.84 | 172.70 | 2.33 | |
| Summer | 48.80 | 41.43 | 130.99 | 0.51 | 4.55 | 99.10 | 0.41 | |
| Autumn | 202.90 | 169.34 | 46.96 | 3.93 | 36.64 | 88.10 | 4.65 | |
| Year 1-2050+i20 | Annual | 502.60 | 431.30 | 409.40 | 25.80 | 78.40 | 128.37 | 10.38 |
| Winter | 62.20 | 45.80 | 56.90 | 4.60 | 9.29 | 157.20 | 0.77 | |
| Spring | 188.70 | 184.90 | 166.80 | 17.40 | 21.70 | 172.35 | 4.34 | |
| Summer | 48.80 | 42.80 | 139.30 | 1.00 | 10.42 | 97.77 | 1.61 | |
| Autumn | 202.90 | 157.80 | 46.50 | 2.70 | 36.98 | 86.66 | 3.67 |
DownLoad: CSV| Year-scenario | Period | Rainfall (mm) | Infilt. (mm) | Evap. (mm) | Deep percol. (mm) | Runoff (mm) | Soil water (mm) | Soil loss (Mg ha-1) |
| Year 2-present | Annual | 530.5 | 435.4 | 412.4 | 44.40 | 92.60 | 117.80 | 7.28 |
| Winter | 14.5 | 12.3 | 62 | 12.8 | 0 | 136 | 0.00 | |
| Spring | 195 | 165 | 160.1 | 9.4 | 29 | 127.8 | 2.29 | |
| Summer | 93 | 63.1 | 114.6 | 0.2 | 27 | 70.1 | 2.39 | |
| Autumn | 228 | 195 | 75.7 | 22 | 36.6 | 110.2 | 2.59 | |
| Year 2-2020 | Annual | 510.7 | 428.3 | 407.8 | 47.7 | 81.12 | 109.4 | 6.67 |
| Winter | 11.8 | 11.7 | 62.9 | 12.5 | 0.00 | 136.4 | 0.00 | |
| Spring | 176.6 | 153.0 | 157.0 | 6.6 | 22.93 | 123.9 | 1.80 | |
| Summer | 77.6 | 59.8 | 111.1 | 0.1 | 17.61 | 66.9 | 1.31 | |
| Autumn | 244.7 | 203.9 | 76.8 | 28.4 | 40.58 | 110.8 | 3.56 | |
| Year 2-2020+i10 | Annual | 510.3 | 406.0 | 397.0 | 38.0 | 103.26 | 107.0 | 9.52 |
| Winter | 11.3 | 11.2 | 62.6 | 11.9 | 0.00 | 135.6 | 0.00 | |
| Spring | 176.3 | 146.6 | 154.8 | 6.0 | 29.06 | 122.5 | 2.60 | |
| Summer | 78.5 | 55.4 | 106.1 | 0.1 | 23.00 | 63.9 | 1.97 | |
| Autumn | 244.2 | 192.8 | 73.5 | 20.1 | 51.20 | 106.5 | 4.94 | |
| Year 2-2020+i20 | Annual | 509.7 | 382.9 | 385.0 | 29.0 | 125.79 | 104.2 | 12.95 |
| Winter | 11.8 | 11.7 | 62.3 | 11.1 | 0.00 | 134.6 | 0.00 | |
| Spring | 170.9 | 135.1 | 149.9 | 4.5 | 35.31 | 119.1 | 3.54 | |
| Summer | 83.0 | 54.6 | 102.7 | 0.1 | 28.24 | 61.8 | 2.75 | |
| Autumn | 244.0 | 181.6 | 70.2 | 13.4 | 62.23 | 101.9 | 6.65 | |
| Year 2-2050 | Annual | 437.2 | 390.7 | 390.4 | 31.1 | 45.41 | 103.6 | 3.14 |
| Winter | 12.0 | 11.9 | 64.1 | 11.2 | 0.00 | 134.6 | 0.00 | |
| Spring | 154.1 | 140.2 | 152.4 | 4.7 | 13.26 | 119.4 | 0.71 | |
| Summer | 59.6 | 52.6 | 104.4 | 0.1 | 6.87 | 61.4 | 0.32 | |
| Autumn | 211.5 | 186.1 | 69.5 | 15.2 | 25.28 | 99.6 | 2.10 | |
| Year 2-2050+i10 | Annual | 437.0 | 437.0 | 437.0 | 437.0 | 61.49 | 101.7 | 4.63 |
| Winter | 11.5 | 11.5 | 11.5 | 11.5 | 0.00 | 133.6 | 0.00 | |
| Spring | 154.3 | 154.3 | 154.3 | 154.3 | 18.05 | 118.3 | 1.14 | |
| Summer | 60.4 | 60.4 | 60.4 | 60.4 | 9.93 | 59.5 | 0.55 | |
| Autumn | 210.8 | 210.8 | 210.8 | 210.8 | 33.51 | 96.1 | 2.95 | |
| Year 2-2050+i20 | Annual | 436.1 | 356.4 | 372.3 | 20.4 | 78.87 | 99.3 | 6.48 |
| Winter | 12.0 | 11.9 | 63.2 | 9.8 | 0.00 | 132.4 | 0.00 | |
| Spring | 149.5 | 126.2 | 146.5 | 3.5 | 22.84 | 115.4 | 1.63 | |
| Summer | 64.0 | 50.4 | 98.1 | 0.0 | 13.46 | 57.7 | 0.84 | |
| Autumn | 210.6 | 167.9 | 64.5 | 7.0 | 42.57 | 92.3 | 4.02 |
DownLoad: CSV| Year/scenario | Without terraces | With terraces | Year/scenario | Without terraces | With terraces | ||
| Year 1 | SL | SL | D (%) | Year 2 | SL | SL | D (%) |
| Year 1-present | 6.78 | 2.78 | 30 | Year 2-present | 9.55 | 3.92 | 39 |
| Year 1-2020 | 6.67 | 4.59 | 33 | Year 2-2020 | 7.94 | 5.46 | 31 |
| Year 1-2020_i10 | 9.51 | 6.58 | 39 | Year 2-2020_i10 | 8.8 | 6.08 | 30 |
| Year 1-2020_i20 | 12.95 | 8.83 | 32 | Year 2-2020_i20 | 11.73 | 7.01 | 40 |
| Year 1-2050 | 3.14 | 2.16 | 40 | Year 2-2050 | 5.35 | 2.72 | 41 |
| Year 1-2050_i10 | 4.63 | 2.35 | 22 | Year 2-2050_i10 | 8.37 | 5.76 | 32 |
| Year 1-2050_i20 | 6.48 | 2.66 | 21 | Year 2-2050_i20 | 10.38 | 4.26 | 35 |
DownLoad: CSV| Area | Clay % | Silt % | Sand % | O.M. % | Bulk density kg m-3 | pH | FC (-33 kPa) % | PWP (-1500 kPa) % | Infiltration rates mm h-1 |
| 1 | 8.5 ± 4.6 | 22.9 ± 4.6 | 68.6 ± 8.8 | 1.18 ± 0.37 | 1545 ± 120 | 8.53 | 19.55 | 6.25 | 27 |
| 2 | 4.5 ± 3.0 | 13.6 ± 2.1 | 81.9 ± 4.6 | 1.32 ± 0.22 | 1670 ± 55 | 8.55 | 16.11 | 5.27 | 28 |
| 3 | 5.0 ± 2.3 | 17.9 ± 3.9 | 77.1 ± 6.0 | 1.37 ± 0.21 | 1420 ± 89 | 8.66 | 21.89 | 7.24 | 10.3 |
| Jan | Feb | Mar | Apr | May | Jun | Jul | Aug | Sep | Oct | Nov | Dec | |
| 2030 | ||||||||||||
| Tmax ( ℃) | 0.694 | 0.816 | 1.147 | 0.894 | 1.034 | 1.372 | 1.675 | 2.248 | 1.647 | 1.552 | 0.613 | 0.573 |
| Tmin ( ℃) | 0.639 | 0.630 | 0.769 | 0.643 | 0.863 | 1.028 | 1.290 | 1.868 | 1.347 | 1.517 | 0.674 | 0.388 |
| SR (W/m2) | 0.129 | 0.076 | 7.606 | 4.600 | -0.303 | 11.748 | 14.851 | 11.003 | 6.296 | -0.354 | 0.321 | 0.170 |
| P (%) | -3.64 | -4.17 | -15.92 | -5.12 | -9.10 | -17.98 | -25.08 | -13.74 | -0.40 | 24.95 | 6.38 | -4.03 |
| RH (fraction) | 0.49 | -0.56 | -2.65 | -2.37 | -0.41 | -1.75 | -2.52 | -2.21 | -1.89 | -0.36 | -1.62 | -1.30 |
| WV (%) | -1.65 | 0.61 | 0.00 | 4.04 | -1.70 | 1.83 | 1.80 | -1.62 | 0.70 | -0.75 | 2.87 | 2.65 |
| 2050 | ||||||||||||
| Tmax ( ℃) | 1.450 | 1.888 | 1.633 | 1.461 | 1.831 | 2.438 | 3.360 | 4.198 | 3.129 | 2.251 | 1.628 | 1.388 |
| Tmin ( ℃) | 1.215 | 1.719 | 1.455 | 1.054 | 1.363 | 1.832 | 2.366 | 2.982 | 2.499 | 2.157 | 1.705 | 1.326 |
| SR (W/m2) | -0.142 | -1.047 | 5.286 | 8.094 | 6.182 | 10.937 | 22.325 | 20.637 | 12.504 | 1.366 | 0.442 | -1.647 |
| P (%) | 1.86 | 3.18 | -12.32 | -17.37 | -23.41 | -23.65 | -32.91 | -31.91 | -25.91 | 9.14 | 6.17 | 1.86 |
| RH (fraction) | -0.75 | -0.84 | -2.86 | -3.16 | -2.32 | -2.24 | -4.13 | -5.46 | -4.18 | -1.58 | -1.70 | -0.99 |
| WV (%) | 1.48 | -0.58 | 3.08 | 1.34 | 1.69 | 0.49 | -3.29 | -4.20 | -3.46 | -0.63 | -1.29 | -1.30 |
| Initial conditions | Values | Plant growth and harvest parameters | Values |
| Bulk density after last tillage (g/cm3) | 1.5 | Biomass energy ratio (kg/MJ) | 30 |
| Initial canopy cover (%) | 10 | Growing degree days to emergence (dgd) | 30 |
| Days since last harvest (days) | 180 | Growing degree days for growing season (gdd) | 2000 |
| Days since last tillage (days) | 30 | In-row plant spacing (m) | 3 |
| Initial interril cover (%) | 10 | Plant stem diameter at maturity (cm) | 5 |
| Initial residue cropping system | 0 | Harvest index (dry crop yield/ total above ground biomass) (%) | 50 |
| Cummulative rainfall since last tillage | 200 | ||
| Initial ridge height since the last tillage (cm) | 2 | Canopy, LAI and Root Parameters | |
| Initial rill cover (%) | 10 | Canopy cover coefficient | 14 |
| Initial roughness after last tillage (cm) | 1 | Parameter value for canopy height equation | 23 |
| Rill spacing (m) | 0 | Maximum canopy height (m) | 2 |
| Rill width type | Temporary | Maximum leaf area index | 6 |
| Depth secondary tillage layer (cm) | 35 | Maximum root depth (m) | 1.5 |
| Depth primary tillage layer (cm) | 20 | Root to shoot ratio | 0.3 |
| Initial rill width (cm) | 2 | Maximum root mass for perennial crop (kg/m2) | 0.6 |
| Initial total dead root mass (kg/m2) | 0.5 | ||
| Initial total submerged residue mass (kg/m2) | 0.2 | ||
| Temperature and radiation parameters | |||
| Base daily air temperature ( ℃) | 10 | ||
| Optimal temperature for plant growth ( ℃) | 25 | ||
| Maximum temperature that stops the growth ( ℃) | 35 | ||
| Critical freezing temperature ( ℃) | -40 | ||
| Radiation extinction coefficient | 0.65 | ||
| Management | S, Ch, C | ||
| Plant beginning | Apr 1st | ||
| Tillage information | |||
| Subsoil-chisel (S) | Jan 15th | Mean tillage depth (cm) | 20, 20, 10 |
| Chisel plow, rolling dick (Ch) | Feb 15th | Fraction of surface area disturbed (%) | 100, 100, 95 |
| Apr 1st | Random roughness value after tillage (cm) | 1.5, 1.5, 1.5 | |
| Cultivator (C) | May 20th | Ridge interval (cm) | 7.5, 30, 75 |
| Jun 20th | Ridge height value after tillage (cm) | 100, 5, 15 | |
| Harvest-Annual | Sep 10th |
| Calibration | Validation | |||||
| RSR | NSE | PBIAS | RSR | NSE | PBIAS | |
| Runoff | 0.858 | 0.711 | -9.582 | 0.532 | 0.786 | 14.733 |
| Soil losses | 0.521 | 0.828 | -25.135 | 0.810 | 0.718 | -6.667 |
| Year-scenario | Period | Rainfall (mm) | Infilt. (mm) | Evap. (mm) | Deep percol. (mm) | Runoff (mm) | Soil water (mm) | Soil loss (Mg ha-1) |
| Year 1-present | Annual | 555.10 | 493.99 | 438.44 | 49.21 | 59.24 | 140.91 | 9.55 |
| Winter | 60.70 | 52.17 | 58.22 | 7.36 | 8.28 | 161.67 | 0.75 | |
| Spring | 232.50 | 213.82 | 175.70 | 33.35 | 17.87 | 182.92 | 4.30 | |
| Summer | 71.20 | 59.25 | 152.00 | 2.37 | 11.43 | 119.29 | 2.59 | |
| Autumn | 190.70 | 168.75 | 52.54 | 6.14 | 21.66 | 99.78 | 1.91 | |
| Year 1-2030 | Annual | 536.31 | 479.41 | 429.21 | 40.99 | 56.90 | 137.73 | 7.94 |
| Winter | 58.74 | 51.28 | 59.23 | 8.11 | 7.46 | 162.53 | 0.64 | |
| Spring | 211.84 | 196.96 | 172.56 | 23.59 | 14.88 | 177.45 | 3.37 | |
| Summer | 59.15 | 51.65 | 145.40 | 1.47 | 7.50 | 112.37 | 1.12 | |
| Autumn | 206.57 | 179.53 | 52.01 | 7.83 | 27.05 | 98.72 | 2.82 | |
| Year 1-2030+i10 | Annual | 536.31 | 465.25 | 423.82 | 36.13 | 71.86 | 135.72 | 9.62 |
| Winter | 58.74 | 48.17 | 58.31 | 6.64 | 8.71 | 160.04 | 0.75 | |
| Spring | 211.84 | 196.15 | 172.00 | 22.59 | 18.53 | 176.75 | 4.34 | |
| Summer | 59.15 | 49.18 | 143.16 | 1.35 | 7.45 | 110.67 | 2.62 | |
| Autumn | 206.57 | 171.74 | 50.35 | 5.56 | 37.17 | 95.50 | 1.91 | |
| Year 1-2030+i20 | Annual | 536.31 | 431.29 | 409.42 | 25.80 | 78.40 | 130.84 | 11.73 |
| Winter | 58.74 | 45.83 | 56.89 | 4.64 | 9.29 | 155.70 | 0.84 | |
| Spring | 211.84 | 184.91 | 166.76 | 17.39 | 21.70 | 171.75 | 4.83 | |
| Summer | 59.15 | 42.79 | 139.28 | 1.04 | 10.42 | 107.65 | 1.10 | |
| Autumn | 206.57 | 157.77 | 46.49 | 2.74 | 36.98 | 88.35 | 4.95 | |
| Year 1-2050 | Annual | 502.60 | 453.20 | 414.20 | 34.00 | 47.92 | 131.80 | 6.28 |
| Winter | 62.20 | 53.10 | 60.50 | 6.90 | 8.85 | 160.70 | 0.73 | |
| Spring | 188.70 | 179.30 | 169.90 | 21.00 | 8.68 | 173.40 | 1.75 | |
| Summer | 48.80 | 44.50 | 135.20 | 0.70 | 3.92 | 102.20 | 0.31 | |
| Autumn | 202.90 | 176.30 | 48.60 | 5.50 | 26.47 | 91.20 | 3.49 | |
| Year 1-2050+i10 | Annual | 502.60 | 438.27 | 406.56 | 31.12 | 62.02 | 129.50 | 8.37 |
| Winter | 62.20 | 52.51 | 59.61 | 5.72 | 9.99 | 158.30 | 0.98 | |
| Spring | 188.70 | 175.00 | 168.99 | 20.96 | 10.84 | 172.70 | 2.33 | |
| Summer | 48.80 | 41.43 | 130.99 | 0.51 | 4.55 | 99.10 | 0.41 | |
| Autumn | 202.90 | 169.34 | 46.96 | 3.93 | 36.64 | 88.10 | 4.65 | |
| Year 1-2050+i20 | Annual | 502.60 | 431.30 | 409.40 | 25.80 | 78.40 | 128.37 | 10.38 |
| Winter | 62.20 | 45.80 | 56.90 | 4.60 | 9.29 | 157.20 | 0.77 | |
| Spring | 188.70 | 184.90 | 166.80 | 17.40 | 21.70 | 172.35 | 4.34 | |
| Summer | 48.80 | 42.80 | 139.30 | 1.00 | 10.42 | 97.77 | 1.61 | |
| Autumn | 202.90 | 157.80 | 46.50 | 2.70 | 36.98 | 86.66 | 3.67 |
| Year-scenario | Period | Rainfall (mm) | Infilt. (mm) | Evap. (mm) | Deep percol. (mm) | Runoff (mm) | Soil water (mm) | Soil loss (Mg ha-1) |
| Year 2-present | Annual | 530.5 | 435.4 | 412.4 | 44.40 | 92.60 | 117.80 | 7.28 |
| Winter | 14.5 | 12.3 | 62 | 12.8 | 0 | 136 | 0.00 | |
| Spring | 195 | 165 | 160.1 | 9.4 | 29 | 127.8 | 2.29 | |
| Summer | 93 | 63.1 | 114.6 | 0.2 | 27 | 70.1 | 2.39 | |
| Autumn | 228 | 195 | 75.7 | 22 | 36.6 | 110.2 | 2.59 | |
| Year 2-2020 | Annual | 510.7 | 428.3 | 407.8 | 47.7 | 81.12 | 109.4 | 6.67 |
| Winter | 11.8 | 11.7 | 62.9 | 12.5 | 0.00 | 136.4 | 0.00 | |
| Spring | 176.6 | 153.0 | 157.0 | 6.6 | 22.93 | 123.9 | 1.80 | |
| Summer | 77.6 | 59.8 | 111.1 | 0.1 | 17.61 | 66.9 | 1.31 | |
| Autumn | 244.7 | 203.9 | 76.8 | 28.4 | 40.58 | 110.8 | 3.56 | |
| Year 2-2020+i10 | Annual | 510.3 | 406.0 | 397.0 | 38.0 | 103.26 | 107.0 | 9.52 |
| Winter | 11.3 | 11.2 | 62.6 | 11.9 | 0.00 | 135.6 | 0.00 | |
| Spring | 176.3 | 146.6 | 154.8 | 6.0 | 29.06 | 122.5 | 2.60 | |
| Summer | 78.5 | 55.4 | 106.1 | 0.1 | 23.00 | 63.9 | 1.97 | |
| Autumn | 244.2 | 192.8 | 73.5 | 20.1 | 51.20 | 106.5 | 4.94 | |
| Year 2-2020+i20 | Annual | 509.7 | 382.9 | 385.0 | 29.0 | 125.79 | 104.2 | 12.95 |
| Winter | 11.8 | 11.7 | 62.3 | 11.1 | 0.00 | 134.6 | 0.00 | |
| Spring | 170.9 | 135.1 | 149.9 | 4.5 | 35.31 | 119.1 | 3.54 | |
| Summer | 83.0 | 54.6 | 102.7 | 0.1 | 28.24 | 61.8 | 2.75 | |
| Autumn | 244.0 | 181.6 | 70.2 | 13.4 | 62.23 | 101.9 | 6.65 | |
| Year 2-2050 | Annual | 437.2 | 390.7 | 390.4 | 31.1 | 45.41 | 103.6 | 3.14 |
| Winter | 12.0 | 11.9 | 64.1 | 11.2 | 0.00 | 134.6 | 0.00 | |
| Spring | 154.1 | 140.2 | 152.4 | 4.7 | 13.26 | 119.4 | 0.71 | |
| Summer | 59.6 | 52.6 | 104.4 | 0.1 | 6.87 | 61.4 | 0.32 | |
| Autumn | 211.5 | 186.1 | 69.5 | 15.2 | 25.28 | 99.6 | 2.10 | |
| Year 2-2050+i10 | Annual | 437.0 | 437.0 | 437.0 | 437.0 | 61.49 | 101.7 | 4.63 |
| Winter | 11.5 | 11.5 | 11.5 | 11.5 | 0.00 | 133.6 | 0.00 | |
| Spring | 154.3 | 154.3 | 154.3 | 154.3 | 18.05 | 118.3 | 1.14 | |
| Summer | 60.4 | 60.4 | 60.4 | 60.4 | 9.93 | 59.5 | 0.55 | |
| Autumn | 210.8 | 210.8 | 210.8 | 210.8 | 33.51 | 96.1 | 2.95 | |
| Year 2-2050+i20 | Annual | 436.1 | 356.4 | 372.3 | 20.4 | 78.87 | 99.3 | 6.48 |
| Winter | 12.0 | 11.9 | 63.2 | 9.8 | 0.00 | 132.4 | 0.00 | |
| Spring | 149.5 | 126.2 | 146.5 | 3.5 | 22.84 | 115.4 | 1.63 | |
| Summer | 64.0 | 50.4 | 98.1 | 0.0 | 13.46 | 57.7 | 0.84 | |
| Autumn | 210.6 | 167.9 | 64.5 | 7.0 | 42.57 | 92.3 | 4.02 |
| Year/scenario | Without terraces | With terraces | Year/scenario | Without terraces | With terraces | ||
| Year 1 | SL | SL | D (%) | Year 2 | SL | SL | D (%) |
| Year 1-present | 6.78 | 2.78 | 30 | Year 2-present | 9.55 | 3.92 | 39 |
| Year 1-2020 | 6.67 | 4.59 | 33 | Year 2-2020 | 7.94 | 5.46 | 31 |
| Year 1-2020_i10 | 9.51 | 6.58 | 39 | Year 2-2020_i10 | 8.8 | 6.08 | 30 |
| Year 1-2020_i20 | 12.95 | 8.83 | 32 | Year 2-2020_i20 | 11.73 | 7.01 | 40 |
| Year 1-2050 | 3.14 | 2.16 | 40 | Year 2-2050 | 5.35 | 2.72 | 41 |
| Year 1-2050_i10 | 4.63 | 2.35 | 22 | Year 2-2050_i10 | 8.37 | 5.76 | 32 |
| Year 1-2050_i20 | 6.48 | 2.66 | 21 | Year 2-2050_i20 | 10.38 | 4.26 | 35 |
