Mechanical jaundice is a severe pathological condition caused by obstruction of the bile duct, usually requiring surgical intervention. Mechanical jaundice occurs in 45–50% of all cases of jaundice of all types, and may be of either non-tumor or tumor origin. Due to involvement of oxidative stress reactions in mechanical jaundice pathogenesis, it is relevant to study the parameters of this process. This study assesses lipid peroxidation-antioxidant defense components in men with mechanical jaundice of non-tumor and tumor origin in the context of surgical treatment. This study examined 47 men with mechanical jaundice of non-tumor origin (MJNT) and 45 men with mechanical jaundice of tumor origin (MJT) (stages I-II of the tumor process). Data from 100 healthy men served as the control. High activity of lipid peroxidation accompanied by falling concentrations of antioxidant enzymes were observed in men with MJNT. Increased primary and final lipid peroxidation products and decreases in almost all studied components of the antioxidant defense system (superoxide dismutase, glutathioneS-transferase, glutathione peroxidase, and ceruloplasmin) were observed. Similar observations emerged for patients with MJT, but with greater changes in parameters. The only indicator of difference between the groups was ceruloplasmin, with lower values in the MJT group. The MJNT group showed decreased thiobarbituric acid reactant values, catalase and ceruloplasmin both values were increased post-surgery. The post-surgery MJT group showed decreased conjugated dienes values and increased catalase and ceruloplasmin values. Thus, in MJNT patients, changes in the lipid peroxidation system relate to the stage of final products, which may serve as a favorable sign, in contrast to the MJT group, where changes concern only the stage of primary products. Based on the data obtained, antioxidant drugs are advised for patients with mechanical jaundice, with special attention given to the tumor origin of the disease.
Citation: Marina A. Darenskaya, Olga V. Smirnova, Boris G. Gubanov, Natalya V. Semenova, Lyubov I. Kolesnikova, Sergey I. Kolesnikov. Lipid peroxidation, antioxidant defense parameters, and dynamics of surgical treatment in men with mechanical jaundice of various origins[J]. AIMS Molecular Science, 2020, 7(4): 374-382. doi: 10.3934/molsci.2020018
Related Papers:
[1]
Xavier Blanc, Claude Le Bris .
Improving on computation of homogenized coefficients in the
periodic and quasi-periodic settings. Networks and Heterogeneous Media, 2010, 5(1): 1-29.
doi: 10.3934/nhm.2010.5.1
[2]
Martin Heida, Benedikt Jahnel, Anh Duc Vu .
Regularized homogenization on irregularly perforated domains. Networks and Heterogeneous Media, 2025, 20(1): 165-212.
doi: 10.3934/nhm.2025010
[3]
Junlong Chen, Yanbin Tang .
Homogenization of nonlinear nonlocal diffusion equation with periodic and stationary structure. Networks and Heterogeneous Media, 2023, 18(3): 1118-1177.
doi: 10.3934/nhm.2023049
[4]
Fabio Camilli, Claudio Marchi .
On the convergence rate in multiscale homogenization of fully nonlinear elliptic problems. Networks and Heterogeneous Media, 2011, 6(1): 61-75.
doi: 10.3934/nhm.2011.6.61
[5]
Patrick Henning .
Convergence of MsFEM approximations for elliptic, non-periodic homogenization problems. Networks and Heterogeneous Media, 2012, 7(3): 503-524.
doi: 10.3934/nhm.2012.7.503
[6]
Ben Schweizer, Marco Veneroni .
The needle problem approach to non-periodic homogenization. Networks and Heterogeneous Media, 2011, 6(4): 755-781.
doi: 10.3934/nhm.2011.6.755
[7]
Grigor Nika, Adrian Muntean .
Hypertemperature effects in heterogeneous media and thermal flux at small-length scales. Networks and Heterogeneous Media, 2023, 18(3): 1207-1225.
doi: 10.3934/nhm.2023052
[8]
Mogtaba Mohammed, Mamadou Sango .
Homogenization of nonlinear hyperbolic stochastic partial differential equations with nonlinear damping and forcing. Networks and Heterogeneous Media, 2019, 14(2): 341-369.
doi: 10.3934/nhm.2019014
[9]
Rémi Goudey .
A periodic homogenization problem with defects rare at infinity. Networks and Heterogeneous Media, 2022, 17(4): 547-592.
doi: 10.3934/nhm.2022014
[10]
Tasnim Fatima, Ekeoma Ijioma, Toshiyuki Ogawa, Adrian Muntean .
Homogenization and dimension reduction of filtration combustion in heterogeneous thin layers. Networks and Heterogeneous Media, 2014, 9(4): 709-737.
doi: 10.3934/nhm.2014.9.709
Abstract
Mechanical jaundice is a severe pathological condition caused by obstruction of the bile duct, usually requiring surgical intervention. Mechanical jaundice occurs in 45–50% of all cases of jaundice of all types, and may be of either non-tumor or tumor origin. Due to involvement of oxidative stress reactions in mechanical jaundice pathogenesis, it is relevant to study the parameters of this process. This study assesses lipid peroxidation-antioxidant defense components in men with mechanical jaundice of non-tumor and tumor origin in the context of surgical treatment. This study examined 47 men with mechanical jaundice of non-tumor origin (MJNT) and 45 men with mechanical jaundice of tumor origin (MJT) (stages I-II of the tumor process). Data from 100 healthy men served as the control. High activity of lipid peroxidation accompanied by falling concentrations of antioxidant enzymes were observed in men with MJNT. Increased primary and final lipid peroxidation products and decreases in almost all studied components of the antioxidant defense system (superoxide dismutase, glutathioneS-transferase, glutathione peroxidase, and ceruloplasmin) were observed. Similar observations emerged for patients with MJT, but with greater changes in parameters. The only indicator of difference between the groups was ceruloplasmin, with lower values in the MJT group. The MJNT group showed decreased thiobarbituric acid reactant values, catalase and ceruloplasmin both values were increased post-surgery. The post-surgery MJT group showed decreased conjugated dienes values and increased catalase and ceruloplasmin values. Thus, in MJNT patients, changes in the lipid peroxidation system relate to the stage of final products, which may serve as a favorable sign, in contrast to the MJT group, where changes concern only the stage of primary products. Based on the data obtained, antioxidant drugs are advised for patients with mechanical jaundice, with special attention given to the tumor origin of the disease.
1.
Introduction
Tequila is an alcoholic beverage obtained from Agave tequilana Weber blue variety; its production is protected under a well-established region in Mexico by the Official Mexican Norm for Tequila [1]. The production process of Tequila features five stages: cooking, grinding, fermentation, distillation and aging or resting [2]. Usually, research about Tequila production is focused in each stage of the process, and also in how to increase the Tequila's yield and quality. Therefore, fast analytical techniques have been developed to ensure the authenticity and quality of Tequila to satisfy the Mexican regulation [3]. Commercial regulations enforce that the maximal permissible concentration of higher alcohols must be 500 mg per 100 ml of anhydrous alcohol. In addition, Tequila aroma is strongly related to these higher alcohols and volatile compounds. Among the 200 volatile compounds, only a few are essential in the quality and bouquet of Tequila [4]. Therefore, the milestone stage for the process of Tequila production relies in the fermentation stage; in this stage the sugars (principally fructose) are metabolized into ethanol, carbon dioxide (CO2), and also into a wide variety of secondary products such as the volatile compounds which are very important in the bouquet of the liquor of Tequila [5]. The composition of Tequila can be affected by a wide range of factors from which the fermented most and the yeast metabolism are the most important. For the production of higher alcohols, the composition of Tequila liquor can be affected by the nitrogen source (amount and type) and how the yeast will metabolize it [5,6,7].
Saccharomyces cerevisiae is a versatile microorganism commonly used to ferment agave juice in the production of Tequila and also employed in many different industrial applications. This microorganism has been investigated in metabolic studies which elucidate its gene functions, integration, and metabolism [8]. Moreover, key research areas are focused in the fermentation process by using novel strains such as Saccharomyces and non-Saccharomyces [9,10].
Genomic Scale Models (GSM) are used to estimate the metabolic fluxes distribution; these models contain a wide collection of stoichiometrically-branded biochemical reactions related to enzymes in the cell/tissue [11]. Applications of GSM go from topological networks analyses, phenotype behaviors until the simulation of metabolism under certain metabolic engineering strategies [8]. Thus, over 100 GSMs have been developed for a wide variety of microorganisms such as bacteria, eukaryotes and archea i.e., Haemophilus influenzae, Escherichia coli, Saccharomyces cerevisiae, Helicobacter pylori, Staphyloccocus aureus, Bacillus subtilis, Homo sapiens, Pseudomona aeruginosa and for the genus Synechocystis, among others [12,13,14]. By taking advantage of the capabilities described in the literature, it is possible to test novel hypotheses on metabolic functions for a set of organisms-of-interest [14].
In the last decade, GSMs for Saccharomyces cerevisiae have been reported, such as the models iFF708, iND750, iLL672, iIN800, iMM904, iTO977 and Yeast 6 [13,15,16,17,18,19,20]. These models have been developed gradually by adding open reading frames (ORF) reactions and compartments. The first version of the model iFF708 includes 708 ORF with 1175 biochemical reactions and 3 compartments. In contrast, the last version, Yeast 6, contains 900 ORF with 1888 biochemical reactions and 15 compartments [8]. As mentioned before, there are already models which their number in biochemical reactions is around one thousand, however, using these models in practical applications represents a challenge due to their complexity. Moreover, computational algorithms for FBA have been commonly used in different strain models [12,21]. The metabolic phenotype of the microorganism is usually analyzed based on the flux distributions in the metabolic network, for example, for S. cerevisiae, it was found that the global cellular functions under aerobic and anaerobic culture were consistent with the experimental data [22]. Pereira et. al. (2016) selected four GSMs to analyze S. cerevisiae; iFF708; IMM904; iTO977 and Yeast 6, however, a comparison among these models was performed in order to find the best approximation with regard to experimental fluxes in vivo resulting that iFF708 showed the best approximation in terms of the metabolic flux distribution for the central metabolism. To analyze the GSM, FBA is used to estimate the flux distribution in the metabolic network. This tool has demonstrated to be a key alternative to foresee the metabolic-networks capabilities especially when there is a scarcity of kinetic parameters [23,24]. However, for practical applications it is helpful to have more simple models that can help in the development of a robust control system for alcoholic fermentation. To our understand, there is no information available with regard to the metabolic flux estimation for S. cerevisiae in the flux distribution of higher alcohols in Tequila production which, traditionally, it is performed using a batch process. Usually, studies in this area focus on the fermentative capabilities of the microorganism and the yields of the synthesis of volatiles compounds [3,5,7,9,10,25,26].
Therefore, in this research a GSM is reconstructed and validated comparing FBA results with experimental data for the continuous fermentation process of Tequila [5,22] using Saccharomyces cerevisiae. This model is tested under aerobic and anaerobic conditions considering the central metabolism which features the catabolic and anabolic biochemical reactions involved in the synthesis of higher alcohols.
2.
Materials and methods: mathematical developments
2.1. Flux balance analysis, FBA
FBA is a methodology used to analyze GSM applying thermodynamic restrictions as well as network and transport capabilities [21,27]. The distribution of metabolic fluxes is found by optimizing an objective function which in the present research is the microorganism growth (μ) [1/s]. In addition, an optimal flux distribution is calculated using a linear programming technique under steady state conditions. According to the the optimal flux distributions under the set of considerations or restrictions, it is possible to generate a quantitative hypothesis in silico which can be tested experimentally [21].
2.1.1. Mathematical representation
According to the biochemical information, the mathematical representation of the GSM is obtained from a mass balance for each metabolite in the biological system and it is depicted as a matrix as shown in Eq (2.1)
dxdt=S⋅v,
(2.1)
where, x [mmol/g D.W.] is the concentration vector of all metabolites considered in the metabolic network, S is the stoichiometric matrix and v [mmol/g D.W. h−1] is the internal flux vector and the whole exchange fluxes considered between the organism and the culture medium. By considering steady-state, the above equation becomes
S⋅v=0.
(2.2)
The system is solved by applying a linear programming technique that maximizes the microorganism growth function which has been experimentally corroborated [21]. The growth function z(xm) is defined by the microorganism biomass as shown by Eq (2.3)
z(xm)=Growth∑m=1dm⋅xm→biomass,
(2.3)
where dm represents each metabolite proportion and xm is the metabolite in the biomass composition.
Applying thermodynamic restrictions as well as the whole interchange fluxes related to the transport capabilities as shown in Eqs (2.4) and (2.5), the flux distribution is obtained
vj≥0,
(2.4)
α≤bj≤βj,
(2.5)
where α and β represent the thermodynamic limits, low and superior, respectively, for each biochemical reaction of the GSM. Furthermore, bj is the estimated value by the FBA or a real value which could be specified as a restriction in the optimization problem.
2.1.2. Reconstruction of the genomic scale model
The reconstructed stoichiometric model took advantage of other models reported in the literature to analyze the metabolism of S. cerevisiae [8,22,28,29,30,31], and it is reported in Appendix A. The model considers the central metabolism for glycolysis (reactions 1-8), the pentose phosphate pathway (reactions 17-22), and the Krebs cycle (reactions 23-31), as well as the fermentative paths for acetate, glycerol and ethanol production (reactions 9-12, 15 and 16), under anaerobic conditions. For the metabolic production of acetate and ethanol, other two key reactions 13 and 14 are included. Therefore, the aim of our GSM model is that it can be used in practical applications as the Tequila production. Usually, there are simplified models which can be aerobic or anaerobic even though they do not include the metabolic and anabolic pathways related with the synthesis of characteristic volatile compounds like the higher alcohols in Tequila production. Therefore, this last characteristic as well as the small number of biochemical reactions to the complex process-production of Tequila are the main features with respect to other models that justify why the GSM is reconstructed. Additionally, our GSM model includes the catabolic pathway which is also called Erlych's pathway and the anabolic pathway that is result of the metabolization of amino acids like Val, Leu, Ileu, Thre and Phe.
2.1.3. Growth objective function
The objective function is defined as the biomass composition and it is considered in the biochemical reaction 65 (flux) for the macromolecules composition such as proteins, carbohydrates, lipids, deoxyribonucleic acid (DNA), and ribonucleic acid (RNA) using the cited values by Nissen et al. (1997) [30]. Under continuous culture fermentation, the cellular biomass composition varies according to the rate dilution (D) [h−1]. The main variation in biomass composition is found in proteins and RNA that increases linearly as a function of D and carbohydrates (see Table S1). In this research, the biomass composition at D = 0.1 h−1 was taken from the literature [30]. The model encompasses both the aerobic and anaerobic conditions where reactions 12, 14, 16, 26 and 33 take place in aerobic conditions while 13, 15 and 27 happen in anaerobic conditions. In order to synthesize different macromolecules present in S. cerevisiae, the polymerization energy reported by Stephanopolous (1998) [29] was considered for reaction 65.
2.1.4. Biochemical protein synthesis
Protein synthesis considers 20 amino acids (reaction 63), 15 of them feature only one amino acid reaction (reactions 36-49) [29]. In particular, the amino acid syntheses; leucine (LEU), valine (VAL), threonine (THR), isoleucine (ILEU) and phenylalanine (PHE), are considered in two reactions, reactions 81 and 91 [28]. The first one uses an amino acid as a precursor to the formation of α-keto acid and the second one from the α-keto acid produces the corresponding amino acid. Those amino acids are strongly related to the synthesis of higher alcohols, particularly, they are a nitrogen source which is presented in the complex mediums of agave juice used for Tequila production.
2.1.5. Higher-alcohol synthesis
The synthesis of higher alcohols is strongly related to amino acids through α-keto acids which are precursors of n-propanol, isoamyl and amyl alcohol, 2-phenyl-ethanol and isobutanol. Higher alcohols production reactions 70-79 can be portrayed by two main pathways as:
1) Catabolic pathway, also known as the Ehrlich pathway, considers the transamination and deamination of the amino acids in the medium culture in reactions 81-92.
2) Anabolic pathway allows the α-keto acid synthesis from the present sugar in the medium. Especially, from the α-keto acids, the higher alcohols are obtained with a similar mechanism as the catabolic pathway in reactions 71-80.
2.1.6. DNA and RNA synthesis
For the syntheses of RNA (reaction 65) and DNA (reaction 66) macromolecules, the formation of molecules for the nucleotides biosynthesis is considered. For RNA, adenosine-monophosphate (AMP), guanosine-monophosphate (GMP), cytidine-monophosphate (CMP) and uridine-monophosphate (UMP) are considered in reactions 50-53 while for DNA, deoxyadenosine monophosphate (dAMP), deoxyguanosine monophosphate (dGMP), deoxycytidine monophosphate (dCMP), and deoxyuracil monophosphate (dUMP) are contemplated in reactions 54-57 [29].
2.1.7. Carbohydrates synthesis
Carbohydrate composition for S. cerevisiae includes glycogen, trehalose, mannose, and other carbohydrates as reported for reaction 64.
2.1.8. Lipids synthesis
The lipids for S. cerevisiae are mainly made of phospholipids, sterols and, triacylglycerols which their composition is 3, 54 and 20%, respectively. The main blocks for lipid synthesis consider fatty acids where the palmitic, oleic and linoleic fatty acids are 75% of the total [29]. With regard to the phospholipid composition for S. cerevisiae, it is well known that phosphatidylcholine, phosphatidylethanolamine, and phosphatidylinositol represent more than 90%. For sterols composition in S. cerevisiae, ergosterol represents the most abundant sterol with a porcentage of 90%. Therefore, the lipid synthesis in reaction 67 is presented [29].
2.1.9. Oxidative phosphorylation
For aerobic conditions, the oxidative phosphorylation is included (reactions 32 to 34). Furthermore, in other models that use S. cerevisiae, the stoichiometric oxidative ratio for phosphorylation is P/O = 1.0.
2.1.10. Cellular maintenance
The cellular maintenance in reaction 69 considers the Adenosine Triphosphate (ATP) consumption as for cell-pair functions. The value of S. cerevisiae cellular maintenance is 0.7 mmol ATP/ h g Dry Weight (DW) as it is reported in [29].
2.1.11. Model description
We propose a stoichiometric model that encompasses 117 biochemical reactions and 94 metabolites. From the 117 biochemical reactions, 93 are focused in internal fluxes and 24 to either transport or exchange fluxes between the external environment and the cell. The exchange fluxes analyzed are: glucose, fructose, ammonium, GLN, LEU, ILEU, VAL, THR, PHE, oxygen, sulphate, carbon dioxide, propanol, isobutanol, isoamylic alcohol, amylic alcohol, phenylethanol, ethyl acetate, ethanol, glycerol, acetate, acetaldehyde, succinate and biomass.
2.1.12. Compartmentalization
The compartmentalization was performed by the compounds OAA, ACCOA, NADH and NADPH which participate in reactions in the mitochondria as well as in the cytosol [30].
3.
Results
3.1. Stoichiometric model validation
The proposed stoichiometric model is validated under both conditions, fermentation (anaerobic) and growth (aerobic), which are evaluated with other models reported in the literature [15,30]. For a simulation in silico, the cellular maintenance (m) is considered to be m=0.7 mmol ATP/h g Dry Weight as well as a molecular weight (MW) for the biomass defined as 28 g/C-mol [30].
3.1.1. Stoichimetric model validation under anaerobic conditions
To validate the model under anaerobic conditions, the flux for the consumption of glucose at D = 0.1 h−1 was calculated using the Pirt maintenance model [32]. The glucose flux was 5.917 mmol/g DW h and it was established as an experimental reaction according to Eq (2.5). For oxygen, the flux was zero for anaerobic conditions. Moreover, ammonium was considered as a unique nitrogen source without any restriction (see Table S2). The results showed that large fermentation products (ethanol, biomass and CO2) presented a minimal deviation of 2.41, 0.9 and 2.6%, respectively, while glicerol had a deviation of 21% with respect to the values predicted in silico by Nissen et al. (1997), Table 1. The algorithm estimates only optimal solutions therefore non production of acetate is reported [22].
Table 1.
Theoretical yields obtained with the proposed fermentation model.
3.1.2. Stoichiometric model validation under aerobic conditions
For aerobic conditions, our model was tested against iFF708 which was conformed with 1035 reactions and had been validated experimentally under three conditions: microaerobic fermentation, oxide-fermentative growth, and aerobic growth featuring different oxygen consumptions [15].
1) Microaerobic fermentation
For microaerobic fermentation, the performed restrictions by the simulation were: glucose consumption flux = 14 mmol/g DW h and, oxygen consumption flux = 1 mmol/g DW h. However, ammonium was considered only as a nitrogen source without restrictions for either transport or consumption (see Table S3). The shown analysis of microaerobic fermentation in Table 2 predicted a growth specific velocity of μ=0.322 mmol/g DW h. For this value, deviations of 2.42 and 3.87% with respect to the values in silico and experimental were calculated, respectively. Moreover, the value of ethanol flux = 21.01 mmol/g DW h showed deviations of 1.31 and 4.63% with respect to the in silico and experimental values [15].
Table 2.
Comparison of predictions in silico in microaerobic fermentation.
The oxide-fermentative growth was modelled by considering the following fluxes restrictions: glucose consumption of 12 mmol/g DW h, maximal oxygen consumption of 9 mmol/g DW h and ammonium source with a flux of 1 mmol/g DW h (see Table S4). For this simulation, a growth specific velocity of μ = 0.51 h−1 was obtained which represented a minor value of 3.77% compared with the value in silico, μ = 0.53 h−1, this value is shown in Table 3 and it was similar to the experimental value, both reported by Duarte (2004) [15]. With regard to the ethanol flux (14.03 mmol/g DW h), this represented a variation of 17.11% with respect to the value in silico and 21.10% with respect to the experimental value. Nevertheless, for acetate, our proposed model was not able to predict its production as it also had been reported for larger metabolic models [22]. Furthermore, this behavior could be attributed to the fact that the optimization was focused on maximizing the biomass production.
Table 3.
Comparison of predictions in silico under oxido-fermentative growth.
To analyze this physiological state, a set of restrictions in the fluxes were performed: the flux of glucose consumption was 2.5 mmol/g DW h, the maximal flux consumption for oxygen was 8 mmol/g DW h and ammonium was the nitrogen source without any restriction (see Table S5). Table 4 shows the numerical result of μ = 0.20 h−1 which is 9.09% lower than the value calculated in silico, and it is similar to the experimental value reported by Duarte (2004) [15]. It is observed that our model and the one reported by Duarte (2004) [15] do not predict the production of ethanol and acetate, fluxes equal to zero, this behavior could be attributed to the fact that the objective function is the maximization of growth (μ) in aerobic conditions.
Table 4.
Comparison of predictions in silico in glucose-limited aerobic growth.
In particular, our model showed good results once it was tested with all the above conditions, therefore, it was useful to analyze the effects of dilution rate for the Tequila fermentation process using S. cerevisiae in agave juice.
3.2. Simulation of agave-juice fermentation under continuous culture for tequila production: Dilution rate effect
Fluxes for fructose consumption, ethanol production and the specific growth rate were calculated (see Table S6), with base on the experimental data reported by Moran (2011) [5]. Additionally, the fluxes of volatile compounds were also estimated (see Table S7). These estimated fluxes were specified in our model for performing simulations in silico and for estimating the metabolic fluxes distribution (see Figures 1-3). The optimization process was performed under anaerobic conditions, restricting the oxygen consumption flux in the optimization problem and considering the ammonium phosphate consumption as the unique source of nitrogen. The higher-alcohols production fluxes were specified in the optimization problem as experimental restrictions to obtain a physiological state of the microorganism. The simulation showed that the model predicted an ethanol flux of 5.8 mmol/g DW h (see Table 5), which represented a deviation of -13% with respect to the calculated value from the experimental data of 6.654 mmol/g DW h. The specific growth velocity (μ) was established as the fermentor's continuous dilution rate of μ=D=0.04 h−1. Moreover, the considered cellular maintenance was m=0.7 mmol ATP/g DW h as the value reported for S. cerevisiae by Stephanopolous (1998) [29].
Figure 1.
Central metabolism flux distribution and higher alcohol fermentations of agave juice under continuous culture with Saccharomyces cerevisiae D = 0.04 h−1.
Figure 2.
Central metabolism flux distribution and higher alcohol fermentations of agave juice under continuous culture with Saccharomyces cerevisiae D = 0.08 h−1.
Figure 3.
Central metabolism flux distribution and higher alcohol fermentations of agave juice under continuous culture with Saccharomyces cerevisiae D = 0.12 h−1.
The performed in silico optimizations through FBA were analyzed for the dilution rates of D = 0.04 h−1, D = 0.08 h−1 and D = 0.12 h−1 obtaining a good adjustment regarding ethanol flux (see Table S8). However, the adjustment was reduced as the dilution rate was increased. In addition, for the dilution rate of D=0.16 h−1, and a sugar flux of 12.569 mmol glucose/g DW h, it was not possible to obtain a flux map distribution.
4.
Discussion
Observing the flux distribution map under continuous culture, it is possible to identify the activation of different metabolism paths for Saccharomyces cerevisiae such as glycolysis, pentoses phosphate, fermentative pathways, Krebs cycle, oxidative, phosphorylation, and the consume fluxes for the production of metabolites (see Figures 1-3). Particularly, when the dilution rate increases within the range D = 0.04 to 0.08 h−1 there is an increment in the fluxes of glycerol, acetaldehyde and ammonium as well as in the higher alcohols production (see Figures 1 and 2).
This phenomenon occurs due to a direct relationship between ammonium and the production of higher alcohols. In some fermentation processes, the consumption of ammonium in high levels is correlated with high glycerol, acetate and acetaldehyde syntheses resulting in a reduction of the higher alcohols synthesis [32]. If the dilution rate increases, the microorganism requires higher ammonium concentration but due to the fact that it is limited, the pathway regulation reduces the anabolic pathways of amino acids biosynthesis and then the higher alcohol synthesis increases due to the anabolic pathway from amino acids (LEU, ILEU, VAL, THR and PHE) present in the agave juice [7]. The three physiological states for Saccharomyces cerevisiae are shown in the Figures 1-3 according to the experimental restrictions used in the FBA tool.
Table 6.
Estimation of ethanol flux based on experimental data for different dilution rates.
● a) Map one represents the metabolic flux distribution for (D = 0.04 h−1) (Figure 1) (see Table S6). This physiological state had the highest fermentative capacity of the four states explored by Moran et. al. [5]. Moreover, the highest ethanol concentration was 43.92 g/L and the highest biomass concentration (5.83 g/L) has attained the minimum-residual sugar concentration in the fermentation media (3.94 g/L) by consuming the whole sugar. Additionally, the alcohol productivity reached the second place (1.76 g/L h) in comparison with the other three dilution rates.
● b) Map two represents the metabolic flux distribution for (D = 0.08 h−1) (Figure 2) (see Table S6). The physiological state features one of the two states that had the largest alcohol productivity (2.37 g/L h) similar to the dilution rate D = 0.12 h−1, in comparison with the other two dilution rates. This physiological state had the maximum sugar consumption (5.08 g/L h), the second highest ethanol concentration (29.63 g/L), a residual sugar concentration of 35.34 g/L and a biomass concentration of 3.38 g/L.
● c) Map three represents the metabolic flux distribution for (D = 0.12 h−1) (Figure 3) (see Table S6). It was one of two states that had the highest alcohol productivity (2.37 g/L h), similar to the dilution rate D = 0.08 h−1. Furthermore, it had the second highest value in the sugar consumption rate (4.69 g/L h) and the third highest value in ethanol concentration (19.76 g/L), the second highest value of the residual sugar in the media (59.75 g/L) and also including the third highest value in the biomass concentration (3.04 g/L).
The range of dilution rate (D = 0.08 to 0.12 h−1) showed a low fermentative capacity (biomass concentration) which could be due to a low content of nutrients in agave juice [25] (see Table S6). While the dilution rate increased over the range of D = 0.04 to 0.12 h−1, the concentrations for higher alcohols (n-propanol, iso-butanol, isobutyl alcohol, amyl and isoamyl alcohol and 2-Phenyl-ethanol) also increased.
5.
Conclusions
A metabolic model to analyze Saccharomyces cerevisiae in a continuous fermentation process to obtain agave juice for Tequila production was proposed and implemented. The metabolic model encompassed 94 metabolites and 117 reactions in contrast with far more complex models featuring up to 1035 biochemical reactions such as iFF708. From the 117 reactions, 93 of those were linked to biochemical internal reactions and 24 to transport fluxes between the medium and the microorganism. The developed model was validated under anaerobic and aerobic conditions and it predicted the flux values of the principal metabolites associated with Tequila fermentation. The model allowed us to obtain an estimate of the metabolic flux-map distribution of the strain Saccharomyces cerevisiae and the physiological states of the yeast during the continuous agave-juice fermentation for Tequila production. The estimated fluxes by the model were similar to experimental results reported in literature in which it was possible to visualize the central metabolism and the synthesis pathways of the higher alcohols. The importance of the present genomic model is that it is a simple model which allows the estimation of the metabolic fluxes and determines the cellular physiology state of Saccharomyces cerevisiae.
Acknowledgments
To Consejo Nacional de Ciencia y Tecnología (CONACYT) for the fellowship granted (fellowship number: 174828 and registry number: 165004) and to CIATEJ and UdeG for the facilities and support during the development of the present work.
Conflicts of interest
The authors declare no conflicts of interest.
Appendix
Appendix A. Reaction's list considered in the stoichiometric model.
Glucolysis.
1. GLC + ATP → G6P + ADP
2. FRUC + ATP → F6P + ADP
3. G6P ↔ F6P
4. F6P + ATP → DHAP + G3P + ADP
5. DHAP → G3P
6. G3P + NAD + ADP + Pi → PG3 + ATP + NADH
7. PG3 ↔ PEP
8. PEP + ADP → PYR + ATP
Fermentative pathways.
9. DHAP + NADH → GL3P + NAD
10. GL3P → GL + Pi
11. PYR → ACD + CO2
12. ACD + NADH ↔ ETH + NAD
13. ACD + NADHm ↔ ETH + NADm
14. ACD + NAD → AC + NADH
15. ACD + NADP → AC + NADPH
16. COAm + NADm + PYR → ACCOAm + CO2 + NADHm
17. AC + ATP + COA → ACCOA + ADP + Pi
Pentose phosphate pathway.
18. G6P + 2 NADP → CO2 + 2 NADPH + RL5P
19. RL5P ↔ X5P
20. RL5P ↔ R5P
21. R5P + X5P ↔ G3P + S7P
22. E4P + X5P ↔ F6P + G3P
23. G3P + S7P ↔ E4P + F6P
Citric acid cycle.
24. ATP + OAA → ADP + OAAm + Pi
25. ATP + CO2 + PYR → ADP + OAA + Pi
26. ACCOAm + OAAm → COAm + ICIT
27. ACCOA + OAAm → COA + ICIT
28. ICIT + NADm ↔ AKG + CO2 + NADHm
29. ICIT + NADPm ↔ AKG + CO2 + NADPHm
30. ADP + AKG + NADm + Pi ↔ ATP + CO2 + NADHm + SUCC
All authors declare no conflict of interest regard to this paper.
References
[1]
Khan RS, Houlihan DD, Newsome PN (2019) Investigation of jaundice. Medicine 47: 713-717.
[2]
Zakaria AS, Gamil M, Ali Eldin NH, et al. (2019) P5: Malignant obstructive jaundice; review of 232 Patients. Pan Arab J Oncol 12: 55.
[3]
Pavlidis ET, Pavlidis TE (2018) Pathophysiological consequences of obstructive jaundice and perioperative management. Hepatobiliary Pancreatic Dis Int 17: 17-21.
[4]
Papadopoulos V, Filippou D, Manolis E, et al. (2007) Haemostasis impairment in patients with obstructive jaundice. J Gastrointestin Liver Dis 16: 177.
[5]
Huynh F, Usatoff V (2019) Obstructive jaundice. Textbook of Surgery New York: John Wiley & Sons, Ltd, 643-647.
[6]
Shevchenko BF, Zeleniuk OV, Klenina IA, et al. (2019) Structural and functional state of the liver in patients with extrahepatic cholestasis of non-tumor genesis. Rep Morphol 25: 36-43.
[7]
Hajiyev JM, Taghiyev EG, Hajiyev NJ (2016) Comparative evaluation of interleukin-6 in the liver tissues, bile duct, blood serum and urine in patients with obstructive jaundice of benign etiology. J Exp Clin Surg 9: 33-38.
[8]
Martínez-Cecilia D, Reyes-Díaz M, Ruiz-Rabelo J, et al. (2016) Oxidative stress influence on renal dysfunction in patients with obstructive jaundice: A case and control prospective study. Redox Biol 8: 160-164.
[9]
Moole H, Bechtold M, Puli SR (2016) Efficacy of preoperative biliary drainage in malignant obstructive jaundice: a meta-analysis and systematic review. World J Surg Oncol 14: 182.
[10]
Luo W (2017) Research advances in animal models of obstructive jaundice. J Clin Hepatol 33: 1820-1823.
[11]
Wang N, Han Q, Wang G, et al. (2016) Resveratrol protects oxidative stress-induced intestinal epithelial barrier dysfunction by upregulating heme oxygenase-1 expression. Dig Dis Sci 61: 2522-2534.
[12]
Tian X, Zhao H, Zhang Z, et al. (2019) Intestinal mucosal injury induced by obstructive jaundice is associated with activation of TLR4/TRAF6/NF-κB pathways. PLoS One 14: e0223651.
[13]
Assimakopoulos SF, Vagianos CE, Patsoukis N, et al. (2004) Evidence for intestinal oxidative stress in obstructive jaundice-induced gut barrier dysfunction in rats. Acta Physiol Scand 180: 177-185.
[14]
Assimakopoulos SF, Scopa CD, Vagianos CE (2007) Pathophysiology of increased intestinal permeability in obstructive jaundice. World J Gastroenterol 13: 6458.
[15]
Corongiu FP, Banni S (1994) Detection of conjugated dienes by second derivative ultraviolet spectrophotometry. Methods Enzymol 23: 303-310.
[16]
Asakava T, Matsushita S (1980) Coloring conditions of thiobarbituric acid test, for detecting lipid hydroperoxides. Lipids 15: 137-140.
[17]
Colowick SP, Kaplan NO (1984) Methods in Enzymology Orlando: Academic Press.
[18]
Misra HP, Fridovich I (1972) The role of superoxide anion in the autoxidation of epinephrine and a simple assay for superoxide dismutase. J Biol Chem 247: 3170-3175.
[19]
Schosinsky KH, Lehmann HP, Beeler MF (1974) Measurement of ceruloplasmin from its oxidase activity in serum by use of o-dianisidine dihydrochloride. Clin Chem 20: 1556-1563.
[20]
Rani V, Deep G, Singh RK, et al. (2016) Oxidative stress and metabolic disorders: Pathogenesis and therapeutic strategies. Life Sci 148: 183-193.
[21]
Kolesnikova LI, Darenskaya MA, Kolesnikov SI (2017) Free radical oxidation: a pathophysiologist's view. Bull Sib Med 16: 16-29.
[22]
Kolesnikova LI, Semyonova NV, Grebenkina LA, et al. (2014) Integral indicator of oxidative stress in human blood. Bull Exp Biol Med 157: 715-717.
[23]
Vagholkar K (2020) Obstructive jaundice: understanding the pathophysiology. Int J Surg Med 6: 26-31.
[24]
Jing LI, Wu GL, Niu Q, et al. (2018) Bacterial culture of bile from patients with obstructive jaundice and antibiotic sensitivity. China J Endoscopy 24: 94-99.
[25]
Yang R, Zhu S, Pischke SE, et al. (2018) Bile and circulating HMGB1 contributes to systemic inflammation in obstructive jaundice. J Surg Res 228: 14-19.
[26]
Chowdhury AH, Camara M, Martinez-Pomares L, et al. (2016) Immune dysfunction in patients with obstructive jaundice before and after endoscopic retrograde cholangiopancreatography. Clin Sci 130: 1535-1544.
[27]
Sharifi-Rad M, Anil Kumar NV, Zucca P, et al. (2020) Lifestyle, oxidative stress, and antioxidants: Back and forth in the pathophysiology of chronic diseases. Front Physiol 11: 694.
[28]
Bjørklund G, Chirumbolo S (2017) Role of oxidative stress and antioxidants in daily nutrition and human health. Nutrition 33: 311-321.
[29]
Calabrese G, Morgan B, Riemer J (2017) Mitochondrial glutathione: regulation and functions. Antioxid Redox Signaling 27: 1162-1177.
[30]
Linder MC (2016) Ceruloplasmin and other copper binding components of blood plasma and their functions: an update. Metallomics 8: 887-905.
[31]
Onalan AK, Tuncal S, Kilicoglu S, et al. (2016) Effect of silymarin on oxidative stress and liver histopathology in experimental obstructive jaundice model. Acta Cir Bras 31: 801-806.
[32]
Savdan M, Çakir M, Vatansev H, et al. (2017) Preventing oxygen free radical damage by proanthocyanidin in obstructive jaundice. Turk J Surg 33: 62.
[33]
Winterbourn CC, Kettle AJ, Hampton MB (2016) Reactive oxygen species and neutrophil function. Annu Rev Biochem 85: 765-792.
[34]
Scheufele F, Schorn S, Demir IE, et al. (2017) Preoperative biliary stenting versus operation first in jaundiced patients due to malignant lesions in the pancreatic head: A meta-analysis of current literature. Surgery 161: 939-950.
[35]
Chang ZK, Kou ZP, Li SX, et al. (2018) To evaluate the correlation between the change of immune system function before and after the treatment of malignant obstructive type jaundice treated with biliary stent. Eur Rev Med Pharmacol Sci 22: 1638-1644.
[36]
Nehéz L, Andersson R (2002) Compromise of immune function in obstructive jaundice. Eur J Surg 168: 315-328.
[37]
Mehta MM, Weinberg SE, Chandel NS (2017) Mitochondrial control of immunity: beyond ATP. Nat Rev Immunol 17: 608-620.
[38]
Negre-Salvayre A, Auge N, Ayala V, et al. (2010) Pathological aspects of lipid peroxidation. Free Radical Res 44: 1125-1171.
[39]
Vieira SA, Zhang G, Decker EA (2017) Biological implications of lipid oxidation products. J Am Oil Chem Soc 94: 339-351.
Assyr Abdulle, Doghonay Arjmand, Edoardo Paganoni,
Exponential decay of the resonance error in numerical homogenization via parabolic and elliptic cell problems,
2019,
357,
1631073X,
545,
10.1016/j.crma.2019.05.011
3.
François Bignonnet, Karam Sab, Luc Dormieux, Sébastien Brisard, Antoine Bisson,
Macroscopically consistent non-local modeling of heterogeneous media,
2014,
278,
00457825,
218,
10.1016/j.cma.2014.05.014
4.
Doghonay Arjmand, Olof Runborg,
A time dependent approach for removing the cell boundary error in elliptic homogenization problems,
2016,
314,
00219991,
206,
10.1016/j.jcp.2016.03.009
5.
Eric Cancès, Virginie Ehrlacher, Frédéric Legoll, Benjamin Stamm, Shuyang Xiang,
An Embedded Corrector Problem for Homogenization. Part I: Theory,
2020,
18,
1540-3459,
1179,
10.1137/18M120035X
J.-C. Mourrat,
Efficient Methods for the Estimation of Homogenized Coefficients,
2019,
19,
1615-3375,
435,
10.1007/s10208-018-9389-9
8.
Ivo Babuška, Mohammad Motamed,
A fuzzy-stochastic multiscale model for fiber composites,
2016,
302,
00457825,
109,
10.1016/j.cma.2015.12.016
9.
Antti Hannukainen, Jean-Christophe Mourrat, Harmen T. Stoppels,
Computing homogenized coefficientsviamultiscale representation and hierarchical hybrid grids,
2021,
55,
0764-583X,
S149,
10.1051/m2an/2020024
10.
Julian Fischer,
The Choice of Representative Volumes in the Approximation of Effective Properties of Random Materials,
2019,
234,
0003-9527,
635,
10.1007/s00205-019-01400-w
11.
Assyr Abdulle, Doghonay Arjmand, Edoardo Paganoni,
A parabolic local problem with exponential decay of the resonance error for numerical homogenization,
2021,
31,
0218-2025,
2733,
10.1142/S0218202521500603
12.
Matti Schneider, Marc Josien, Felix Otto,
Representative volume elements for matrix-inclusion composites - a computational study on the effects of an improper treatment of particles intersecting the boundary and the benefits of periodizing the ensemble,
2022,
158,
00225096,
104652,
10.1016/j.jmps.2021.104652
13.
Antoine Gloria, Zakaria Habibi,
Reduction in the Resonance Error in Numerical Homogenization II: Correctors and Extrapolation,
2016,
16,
1615-3375,
217,
10.1007/s10208-015-9246-z
14.
Ronan Costaouec, Claude Le Bris, Frédéric Legoll,
Variance reduction in stochastic homogenization: proof of concept, using antithetic variables,
2010,
50,
1575-9822,
9,
10.1007/BF03322539
15.
ANTOINE GLORIA,
REDUCTION OF THE RESONANCE ERROR — PART 1: APPROXIMATION OF HOMOGENIZED COEFFICIENTS,
2011,
21,
0218-2025,
1601,
10.1142/S0218202511005507
16.
Assyr Abdulle, Doghonay Arjmand, Edoardo Paganoni,
An Elliptic Local Problem with Exponential Decay of the Resonance Error for Numerical Homogenization,
2023,
21,
1540-3459,
513,
10.1137/21M1452123
Sean P. Carney, Milica Dussinger, Björn Engquist,
On the Nature of the Boundary Resonance Error in Numerical Homogenization and Its Reduction,
2024,
22,
1540-3459,
811,
10.1137/23M1594492
19.
Nicolas Clozeau, Marc Josien, Felix Otto, Qiang Xu,
Bias in the Representative Volume Element method: Periodize the Ensemble Instead of Its Realizations,
2024,
24,
1615-3375,
1305,
10.1007/s10208-023-09613-y
Marina A. Darenskaya, Olga V. Smirnova, Boris G. Gubanov, Natalya V. Semenova, Lyubov I. Kolesnikova, Sergey I. Kolesnikov. Lipid peroxidation, antioxidant defense parameters, and dynamics of surgical treatment in men with mechanical jaundice of various origins[J]. AIMS Molecular Science, 2020, 7(4): 374-382. doi: 10.3934/molsci.2020018
Figure 1. Changes in parameters of LPO-AOD system in men with MJNT before and after surgical intervention; * indicates statistically significant differences compared to control group; 
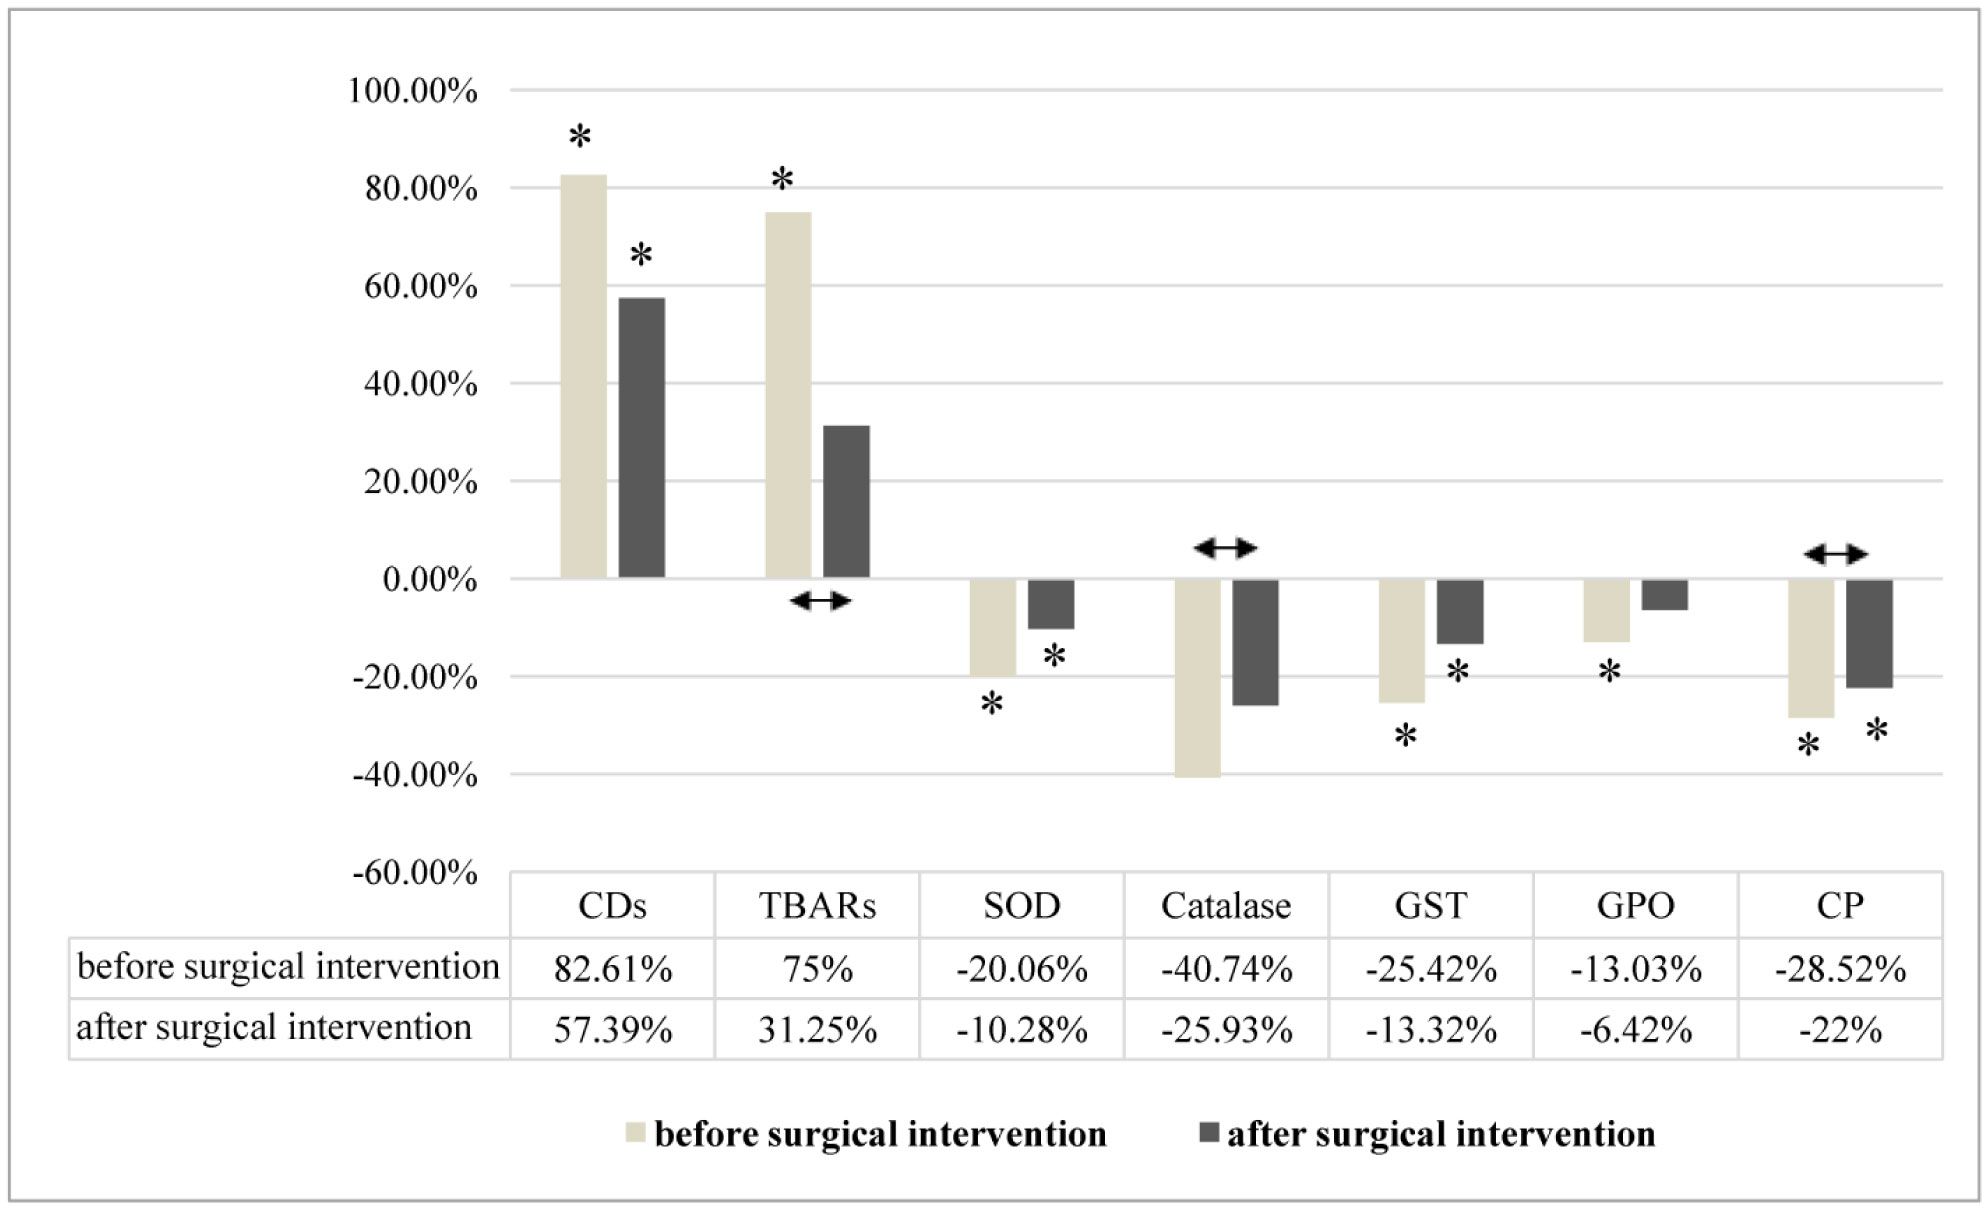
indicates statistically significant differences in men with MJNT after surgical intervention compared to group before surgical intervention
Figure 2. Changes in parameters of LPO-AOD system in men with MJT before and after surgical intervention; * indicates statistically significant differences compared to control group; indicates statistically significant differences in men with MJT after surgical intervention compared to group before surgical intervention
Catalog
Abstract
1.
Introduction
2.
Materials and methods: mathematical developments
2.1. Flux balance analysis, FBA
2.1.1. Mathematical representation
2.1.2. Reconstruction of the genomic scale model
2.1.3. Growth objective function
2.1.4. Biochemical protein synthesis
2.1.5. Higher-alcohol synthesis
2.1.6. DNA and RNA synthesis
2.1.7. Carbohydrates synthesis
2.1.8. Lipids synthesis
2.1.9. Oxidative phosphorylation
2.1.10. Cellular maintenance
2.1.11. Model description
2.1.12. Compartmentalization
3.
Results
3.1. Stoichiometric model validation
3.1.1. Stoichimetric model validation under anaerobic conditions
3.1.2. Stoichiometric model validation under aerobic conditions
3.2. Simulation of agave-juice fermentation under continuous culture for tequila production: Dilution rate effect