Vascular calcification involves the crystallization of calcium/phosphate in the form of hydroxyapatoite in the extracellular matrix of the arterial wall. Vascular calcification is categorized into 3 main etiologies: (1) inflammatory/atherosclerotic (mostly intimal), (2) metabolic (mostly medial), and (3) genetic background (mostly medial). Several overlapping mechanisms trigger all three types of calcifications. Intimal coronary artery calcification simultaneously develops with the progression of atherosclerosis and has been recognized as a surrogate marker of atherosclerotic inflammatory vascular disease. Pathologically, atherosclerotic calcification initially occurs as microcalcifications (0.5 to 15 µm) and results in larger dense calcification, eventually forming sheet calcifications (>3 mm). Among the plaque types, the degree of calcification is the highest in fibrocalcific plaques, followed by healed plaque ruptures, and is the lowest in pathologic intimal thickening. Recent pathologic and imaging-based studies suggest that massive dense calcifications are usually associated with stable plaques, whereas microcalcifications are indicative of vulnerable plaques which may cause acute thrombotic events. Although the mechanisms of calcification are not fully elucidated, apoptotic inflammatory cells and smooth muscle cells, along with the induction of bone formation, play crucial roles in its initiation and progression. A deeper understanding of vascular calcification will improve the risk stratification and patient outcomes through the development of new therapies.
Citation: Teruo Sekimoto, Takamasa Tanaka, Tatsuya Shiraki, Renu Virmani, Aloke V. Finn. How does atherosclerotic plaque become calcified, and why?[J]. AIMS Medical Science, 2024, 11(4): 421-438. doi: 10.3934/medsci.2024029
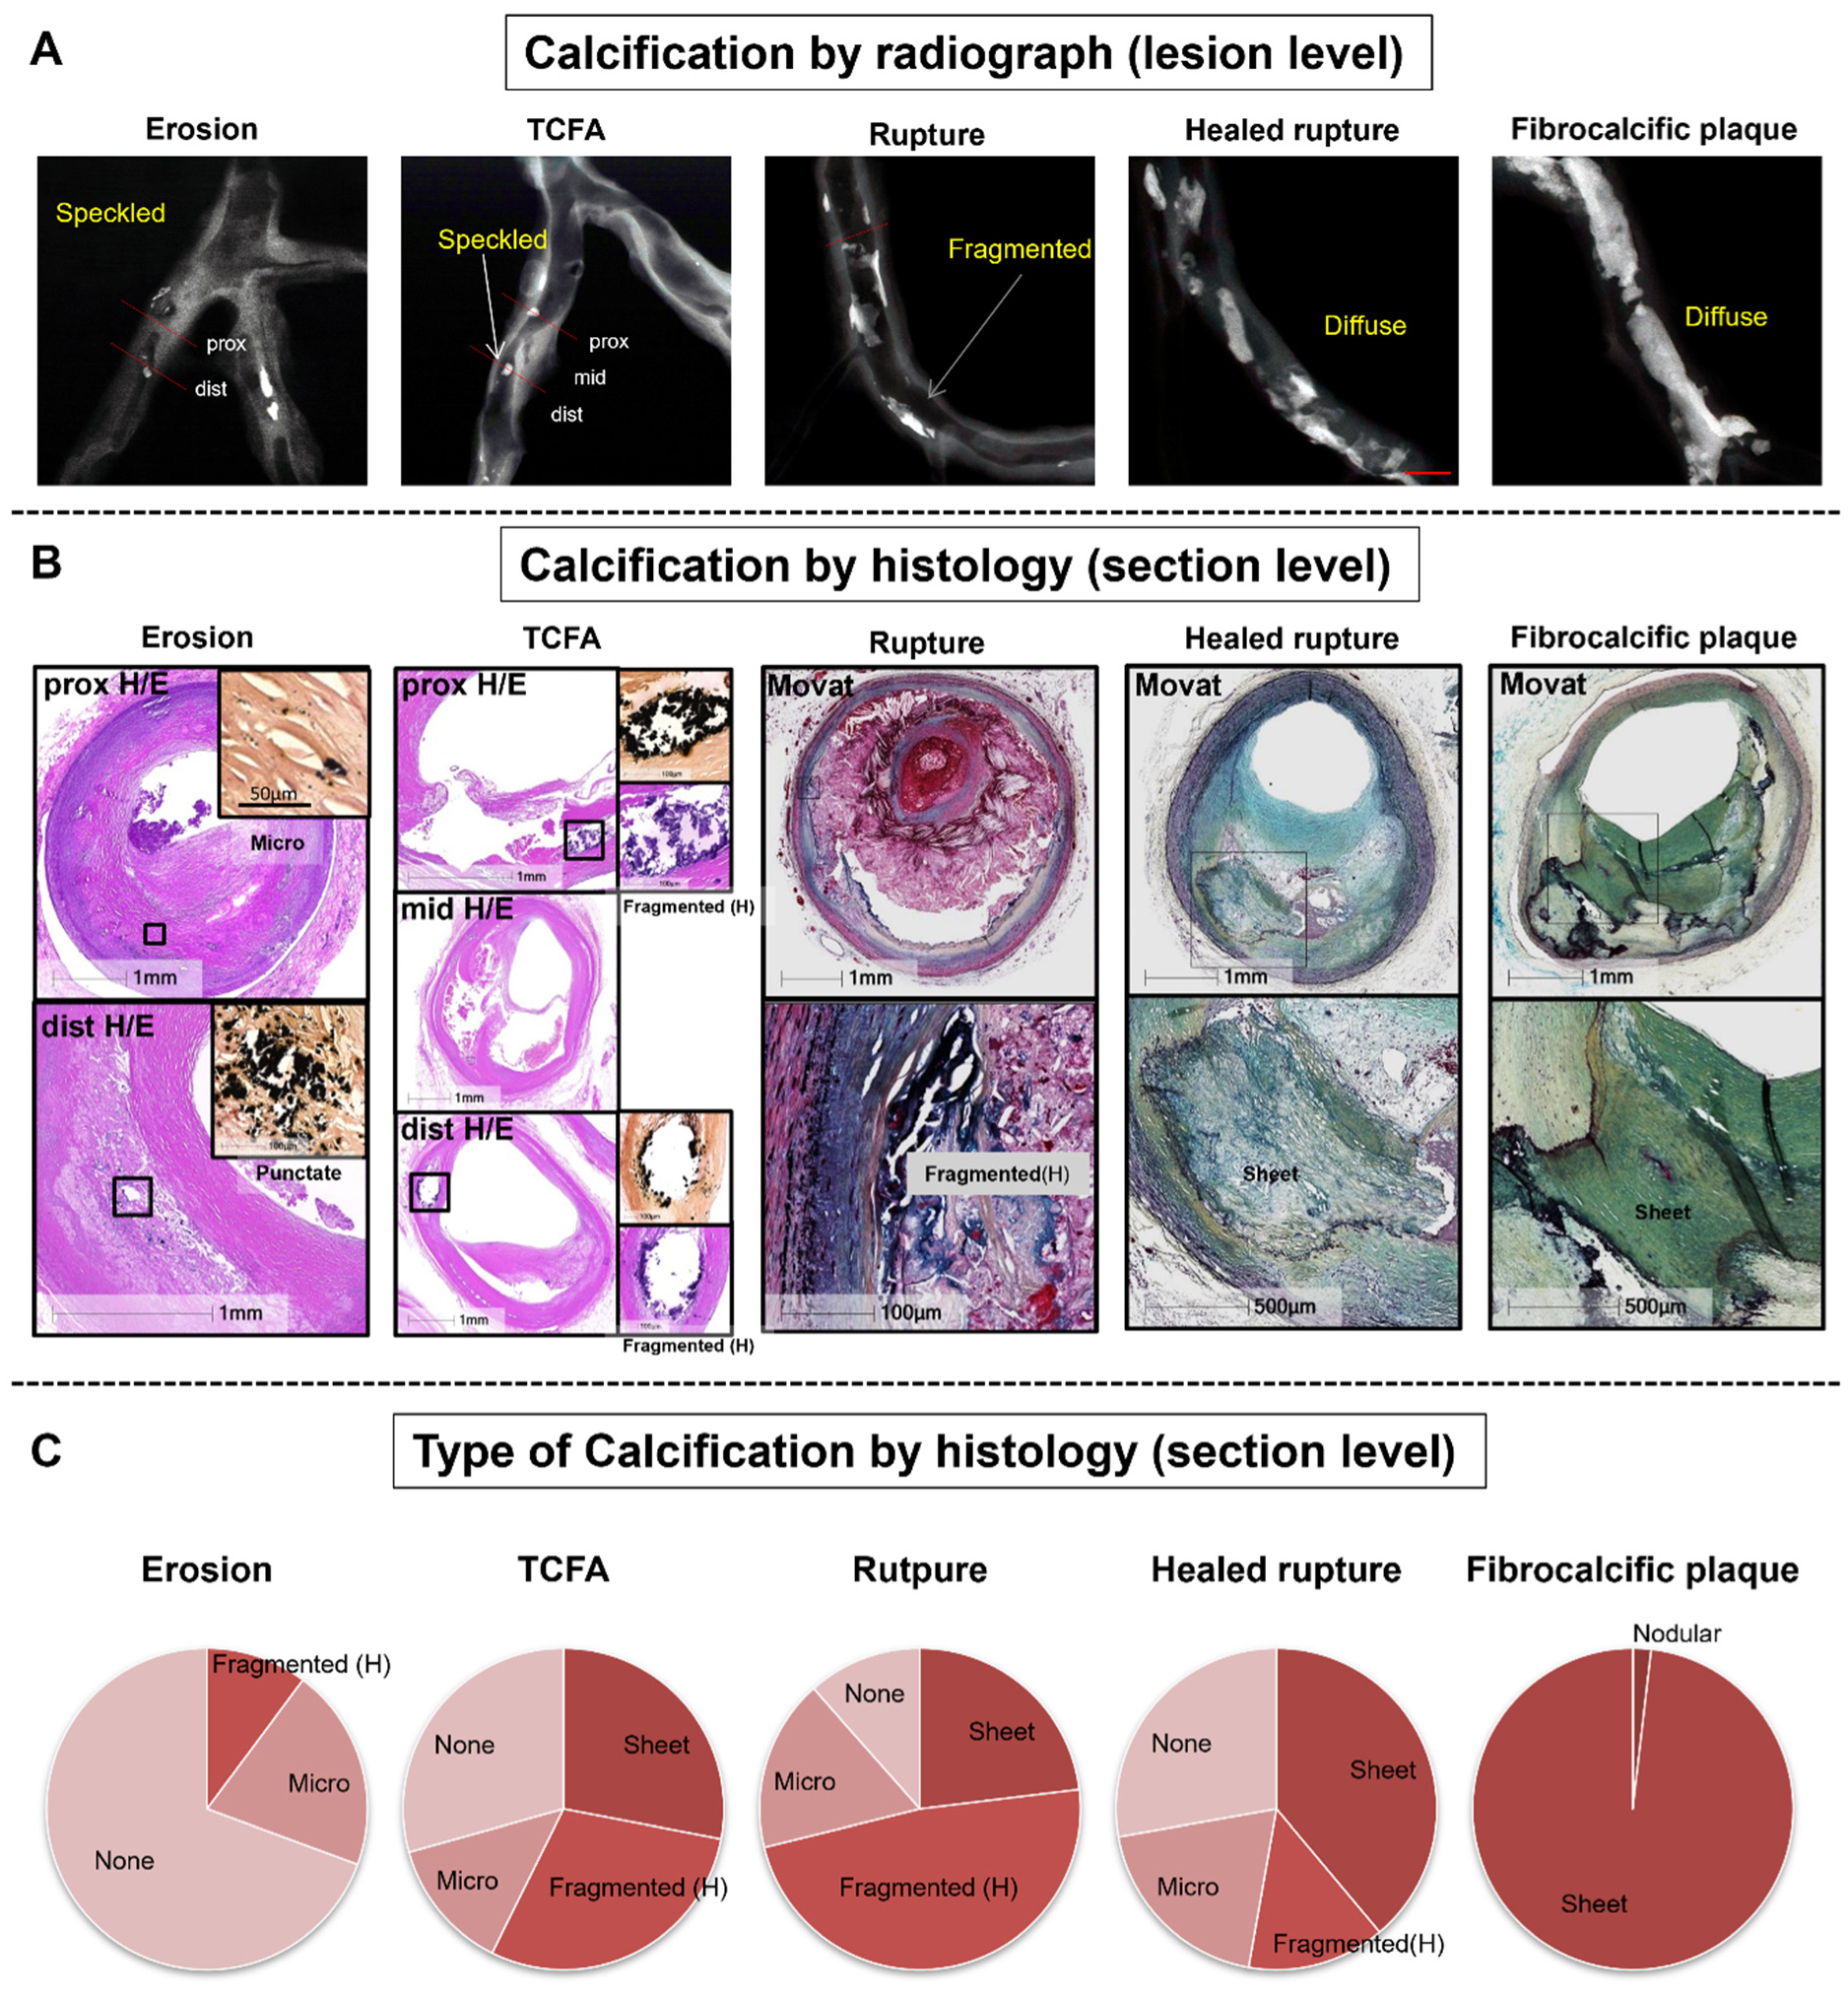
Vascular calcification involves the crystallization of calcium/phosphate in the form of hydroxyapatoite in the extracellular matrix of the arterial wall. Vascular calcification is categorized into 3 main etiologies: (1) inflammatory/atherosclerotic (mostly intimal), (2) metabolic (mostly medial), and (3) genetic background (mostly medial). Several overlapping mechanisms trigger all three types of calcifications. Intimal coronary artery calcification simultaneously develops with the progression of atherosclerosis and has been recognized as a surrogate marker of atherosclerotic inflammatory vascular disease. Pathologically, atherosclerotic calcification initially occurs as microcalcifications (0.5 to 15 µm) and results in larger dense calcification, eventually forming sheet calcifications (>3 mm). Among the plaque types, the degree of calcification is the highest in fibrocalcific plaques, followed by healed plaque ruptures, and is the lowest in pathologic intimal thickening. Recent pathologic and imaging-based studies suggest that massive dense calcifications are usually associated with stable plaques, whereas microcalcifications are indicative of vulnerable plaques which may cause acute thrombotic events. Although the mechanisms of calcification are not fully elucidated, apoptotic inflammatory cells and smooth muscle cells, along with the induction of bone formation, play crucial roles in its initiation and progression. A deeper understanding of vascular calcification will improve the risk stratification and patient outcomes through the development of new therapies.

| [1] |
Demer LL, Tintut Y (2014) Inflammatory, metabolic, and genetic mechanisms of vascular calcification. Arterioscler Thromb Vasc Biol 34: 715-723. https://doi.org/10.1161/ATVBAHA.113.302070 
|
| [2] |
Qiao JH, Mertens RB, Fishbein MC, et al. (2003) Cartilaginous metaplasia in calcified diabetic peripheral vascular disease: morphologic evidence of enchondral ossification. Hum Pathol 34: 402-407. https://doi.org/10.1053/hupa.2003.72
|
| [3] |
Mori H, Torii S, Kutyna M, et al. (2018) Coronary artery calcification and its progression: what does it really mean?. JACC Cardiovasc Imaging 11: 127-142. https://doi.org/10.1016/j.jcmg.2017.10.012
|
| [4] |
Otsuka F, Sakakura K, Yahagi K, et al. (2014) Has our understanding of calcification in human coronary atherosclerosis progressed?. Arterioscler Thromb Vasc Biol 34: 724-736. https://doi.org/10.1161/ATVBAHA.113.302642
|
| [5] |
Stary HC, Chandler AB, Glagov S, et al. (1994) A definition of initial, fatty streak, and intermediate lesions of atherosclerosis. A report from the committee on vascular lesions of the council on Arteriosclerosis, American Heart Association. Circulation 89: 2462-2478. https://doi.org/10.1161/01.cir.89.5.2462
|
| [6] |
Virmani R, Kolodgie FD, Burke AP, et al. (2000) Lessons from sudden coronary death: a comprehensive morphological classification scheme for atherosclerotic lesions. Arterioscler Thromb Vasc Biol 20: 1262-1275. https://doi.org/10.1161/01.atv.20.5.1262
|
| [7] |
Kockx MM, De Meyer GR, Muhring J, et al. (1998) Apoptosis and related proteins in different stages of human atherosclerotic plaques. Circulation 97: 2307-2315. https://doi.org/10.1161/01.cir.97.23.2307
|
| [8] |
Kelly-Arnold A, Maldonado N, Laudier D, et al. (2013) Revised microcalcification hypothesis for fibrous cap rupture in human coronary arteries. Proc Natl Acad Sci U S A 110: 10741-10746. https://doi.org/10.1073/pnas.1308814110
|
| [9] |
Kapustin AN, Shanahan CM (2012) Calcium regulation of vascular smooth muscle cell-derived matrix vesicles. Trends Cardiovasc Med 22: 133-137. https://doi.org/10.1016/j.tcm.2012.07.009
|
| [10] |
New SE, Goettsch C, Aikawa M, et al. (2013) Macrophage-derived matrix vesicles: an alternative novel mechanism for microcalcification in atherosclerotic plaques. Circ Res 113: 72-77. https://doi.org/10.1161/CIRCRESAHA.113.301036
|
| [11] |
Otsuka F, Kramer MC, Woudstra P, et al. (2015) Natural progression of atherosclerosis from pathologic intimal thickening to late fibroatheroma in human coronary arteries: a pathology study. Atherosclerosis 241: 772-782. https://doi.org/10.1016/j.atherosclerosis.2015.05.011
|
| [12] |
Yahagi K, Kolodgie FD, Otsuka F, et al. (2016) Pathophysiology of native coronary, vein graft, and in-stent atherosclerosis. Nat Rev Cardiol 13: 79-98. https://doi.org/10.1038/nrcardio.2015.164
|
| [13] |
Burke AP, Farb A, Malcom GT, et al. (1997) Coronary risk factors and plaque morphology in men with coronary disease who died suddenly. N Engl J Med 336: 1276-1282. https://doi.org/10.1056/NEJM199705013361802
|
| [14] |
Tearney GJ, Regar E, Akasaka T, et al. (2012) Consensus standards for acquisition, measurement, and reporting of intravascular optical coherence tomography studies: a report from the International Working Group for Intravascular Optical Coherence Tomography Standardization and Validation. J Am Coll Cardiol 59: 1058-1072. https://doi.org/10.1016/j.jacc.2011.09.079
|
| [15] |
Kolodgie FD, Burke AP, Farb A, et al. (2001) The thin-cap fibroatheroma: a type of vulnerable plaque: the major precursor lesion to acute coronary syndromes. Curr Opin Cardiol 16: 285-292. https://doi.org/10.1097/00001573-200109000-00006
|
| [16] |
Falk E, Nakano M, Bentzon JF, et al. (2013) Update on acute coronary syndromes: the pathologists' view. Eur Heart J 34: 719-728. https://doi.org/10.1093/eurheartj/ehs411
|
| [17] |
Cheruvu PK, Finn AV, Gardner C, et al. (2007) Frequency and distribution of thin-cap fibroatheroma and ruptured plaques in human coronary arteries: a pathologic study. J Am Coll Cardiol 50: 940-949. https://doi.org/10.1016/j.jacc.2007.04.086
|
| [18] |
Gijsen FJ, Wentzel JJ, Thury A, et al. (2008) Strain distribution over plaques in human coronary arteries relates to shear stress. Am J Physiol Heart Circ Physiol 295: H1608-H1614. https://doi.org/10.1152/ajpheart.01081.2007
|
| [19] |
Sukhova GK, Schonbeck U, Rabkin E, et al. (1999) Evidence for increased collagenolysis by interstitial collagenases-1 and -3 in vulnerable human atheromatous plaques. Circulation 99: 2503-2509. https://doi.org/10.1161/01.cir.99.19.2503
|
| [20] |
Vengrenyuk Y, Carlier S, Xanthos S, et al. (2006) A hypothesis for vulnerable plaque rupture due to stress-induced debonding around cellular microcalcifications in thin fibrous caps. Proc Natl Acad Sc U S A 103: 14678-14683. https://doi.org/10.1073/pnas.0606310103
|
| [21] |
Farb A, Burke AP, Tang AL, et al. (1996) Coronary plaque erosion without rupture into a lipid core. A frequent cause of coronary thrombosis in sudden coronary death. Circulation 93: 1354-1363. https://doi.org/10.1161/01.cir.93.7.1354
|
| [22] |
Kolodgie FD, Burke AP, Farb A, et al. (2002) Differential accumulation of proteoglycans and hyaluronan in culprit lesions: insights into plaque erosion. Arterioscler Thromb Vasc Biol 22: 1642-1648. https://doi.org/10.1161/01.atv.0000034021.92658.4c
|
| [23] |
Torii S, Sato Y, Otsuka F, et al. (2021) Eruptive calcified nodules as a potential mechanism of acute coronary thrombosis and sudden death. J Am Coll Cardiol 77: 1599-1611. https://doi.org/10.1016/j.jacc.2021.02.016
|
| [24] |
Mann J, Davies MJ (1999) Mechanisms of progression in native coronary artery disease: role of healed plaque disruption. Heart 82: 265-268. https://doi.org/10.1136/hrt.82.3.265
|
| [25] |
Mauriello A, Sangiorgi GM, Virmani R, et al. (2010) A pathobiologic link between risk factors profile and morphological markers of carotid instability. Atherosclerosis 208: 572-580. https://doi.org/10.1016/j.atherosclerosis.2009.07.048
|
| [26] |
Detrano R, Guerci AD, Carr JJ, et al. (2008) Coronary calcium as a predictor of coronary events in four racial or ethnic groups. N Engl J Med 358: 1336-1345. https://doi.org/10.1056/NEJMoa072100
|
| [27] |
Nandalur KR, Baskurt E, Hagspiel KD, et al. (2006) Carotid artery calcification on CT may independently predict stroke risk. AJR Am J Roentgenol 186: 547-552. https://doi.org/10.2214/AJR.04.1216
|
| [28] |
Kuntz SH, Torii S, Jinnouchi H, et al. (2020) Pathology and multimodality imaging of acute and chronic femoral stenting in humans. JACC Cardiovasc Interv 13: 418-427. https://doi.org/10.1016/j.jcin.2019.10.060
|
| [29] |
Kawai K, Sato Y, Hokama JY, et al. (2023) Histology, OCT, and Micro-CT evaluation of coronary calcification treated with intravascular lithotripsy: atherosclerotic cadaver study. JACC Cardiovasc Interv 16: 2097-2108. https://doi.org/10.1016/j.jcin.2023.06.021
|
| [30] |
Jinnouchi H, Sato Y, Sakamoto A, et al. (2020) Calcium deposition within coronary atherosclerotic lesion: implications for plaque stability. Atherosclerosis 306: 85-95. https://doi.org/10.1016/j.atherosclerosis.2020.05.017
|
| [31] |
Buckler AJ, Gotto AM, Rajeev A, et al. (2023) Atherosclerosis risk classification with computed tomography angiography: A radiologic-pathologic validation study. Atherosclerosis 366: 42-48. https://doi.org/10.1016/j.atherosclerosis.2022.11.013
|
| [32] | Buckler AJ, Abbara S, Budoff MJ, et al. (2024) Special report on the consensus QIBA profile for objective analytical validation of non-calcified and high-risk plaque and other biomarkers using computed tomography angiography. Acad Radiol . https://doi.org/10.1016/j.acra.2024.07.014 |
| [33] |
Razavi AC, van Assen M, De Cecco CN, et al. (2022) Discordance between coronary artery calcium area and density predicts long-term atherosclerotic cardiovascular disease risk. JACC Cardiovasc Imaging 15: 1929-1940. https://doi.org/10.1016/j.jcmg.2022.06.007
|
| [34] |
Bhatia HS, McClelland RL, Denenberg J, et al. (2023) Coronary artery calcium density and cardiovascular events by volume level: the MESA. Circ Cardiovasc Imaging 16: e014788. https://doi.org/10.1161/CIRCIMAGING.122.014788
|
| [35] |
Nakano M, Yahagi K, Yamamoto H, et al. (2016) Additive value of integrated backscatter IVUS for detection of vulnerable plaque by optical frequency domain imaging: an ex vivo autopsy study of human coronary arteries. JACC Cardiovasc Imaging 9: 163-172. https://doi.org/10.1016/j.jcmg.2015.07.011
|
| [36] |
Sakakura K, Nakano M, Otsuka F, et al. (2014) Comparison of pathology of chronic total occlusion with and without coronary artery bypass graft. Eur Heart J 35: 1683-1693. https://doi.org/10.1093/eurheartj/eht422
|
| [37] |
Burke AP, Farb A, Malcom G, et al. (2001) Effect of menopause on plaque morphologic characteristics in coronary atherosclerosis. Am Heart J 141: S58-S62. https://doi.org/10.1067/mhj.2001.109946
|
| [38] |
Sato Y, Kawakami R, Sakamoto A, et al. (2022) Sex differences in coronary atherosclerosis. Curr Atheroscler Rep 24: 23-32. https://doi.org/10.1007/s11883-022-00980-5
|
| [39] |
Rajendran A, Minhas AS, Kazzi B, et al. (2023) Sex-specific differences in cardiovascular risk factors and implications for cardiovascular disease prevention in women. Atherosclerosis 384: 117269. https://doi.org/10.1016/j.atherosclerosis.2023.117269
|
| [40] |
Budoff MJ, Young R, Burke G, et al. (2018) Ten-year association of coronary artery calcium with atherosclerotic cardiovascular disease (ASCVD) events: the multi-ethnic study of atherosclerosis (MESA). Eur Heart J 39: 2401-2408. https://doi.org/10.1093/eurheartj/ehy217
|
| [41] |
Shaw LJ, Min JK, Nasir K, et al. (2018) Sex differences in calcified plaque and long-term cardiovascular mortality: observations from the CAC Consortium. Eur Heart J 39: 3727-3735. https://doi.org/10.1093/eurheartj/ehy534
|
| [42] |
Maas AH, van der Schouw YT, Atsma F, et al. (2007) Breast arterial calcifications are correlated with subsequent development of coronary artery calcifications, but their aetiology is predominantly different. Eur J Radiol 63: 396-400. https://doi.org/10.1016/j.ejrad.2007.02.009
|
| [43] |
Quispe R, Al-Rifai M, Di Carlo PA, et al. (2019) Breast arterial calcium: a game changer in women's cardiovascular health?. JACC Cardiovasc Imaging 12: 2538-2548. https://doi.org/10.1016/j.jcmg.2018.07.035
|
| [44] |
Koh TJW, Tan HJH, Ravi PRJ, et al. (2023) Association between breast arterial calcifications and cardiovascular disease: a systematic review and meta-analysis. Can J Cardiol 39: 1941-1950. https://doi.org/10.1016/j.cjca.2023.07.024
|
| [45] |
Burke AP, Kolodgie FD, Zieske A, et al. (2004) Morphologic findings of coronary atherosclerotic plaques in diabetics: a postmortem study. Arterioscler Thromb Vasc Biol 24: 1266-1271. https://doi.org/10.1161/01.ATV.0000131783.74034.97
|
| [46] |
Yahagi K, Kolodgie FD, Lutter C, et al. (2017) Pathology of human coronary and carotid artery atherosclerosis and vascular calcification in diabetes mellitus. Arterioscler Thromb Vasc Biol 37: 191-204. https://doi.org/10.1161/ATVBAHA.116.306256
|
| [47] |
Lamprea-Montealegre JA, McClelland RL, Astor BC, et al. (2013) Chronic kidney disease, plasma lipoproteins, and coronary artery calcium incidence: the Multi-Ethnic Study of Atherosclerosis. Arterioscler Thromb Vasc Biol 33: 652-658. https://doi.org/10.1161/ATVBAHA.112.300624
|
| [48] |
Kestenbaum BR, Adeney KL, de Boer IH, et al. (2009) Incidence and progression of coronary calcification in chronic kidney disease: the Multi-Ethnic Study of Atherosclerosis. Kidney Int 76: 991-998. https://doi.org/10.1038/ki.2009.298
|
| [49] |
Shroff GR, Sanchez OA, Miedema MD, et al. (2020) Coronary artery calcium progresses rapidly and discriminates incident cardiovascular events in chronic kidney disease regardless of diabetes: The Multi-Ethnic Study of Atherosclerosis (MESA). Atherosclerosis 310: 75-82. https://doi.org/10.1016/j.atherosclerosis.2020.07.026
|
| [50] |
Hutcheson JD, Goettsch C (2023) Cardiovascular calcification heterogeneity in chronic kidney disease. Circ Res 132: 993-1012. https://doi.org/10.1161/CIRCRESAHA.123.321760
|
| [51] |
Lee SE, Chang HJ, Sung JM, et al. (2018) Effects of statins on coronary atherosclerotic plaques: the PARADIGM study. JACC Cardiovasc Imaging 11: 1475-1484. https://doi.org/10.1016/j.jcmg.2018.04.015
|
| [52] |
van Rosendael AR, van den Hoogen IJ, Gianni U, et al. (2021) Association of statin treatment with progression of coronary atherosclerotic plaque composition. JAMA Cardiol 6: 1257-1266. https://doi.org/10.1001/jamacardio.2021.3055
|


Figures(5)

Teruo Sekimoto, Takamasa Tanaka, Tatsuya Shiraki, Renu Virmani, Aloke V. Finn. How does atherosclerotic plaque become calcified, and why?[J]. AIMS Medical Science, 2024, 11(4): 421-438. doi: 10.3934/medsci.2024029


 DownLoad: