To investigate the clinical characteristics and risk factors for coronary artery lesion (CAL) in Kawasaki disease (KD) through a comprehensive analysis of 418 pediatric cases, thereby enhancing the diagnostic and therapeutic approaches for this condition.
We conducted a retrospective analysis of 418 children diagnosed with KD and hospitalized between January 2017 and January 2024. Data on clinical manifestations, laboratory findings, echocardiography results, and treatment outcomes were systematically reviewed.
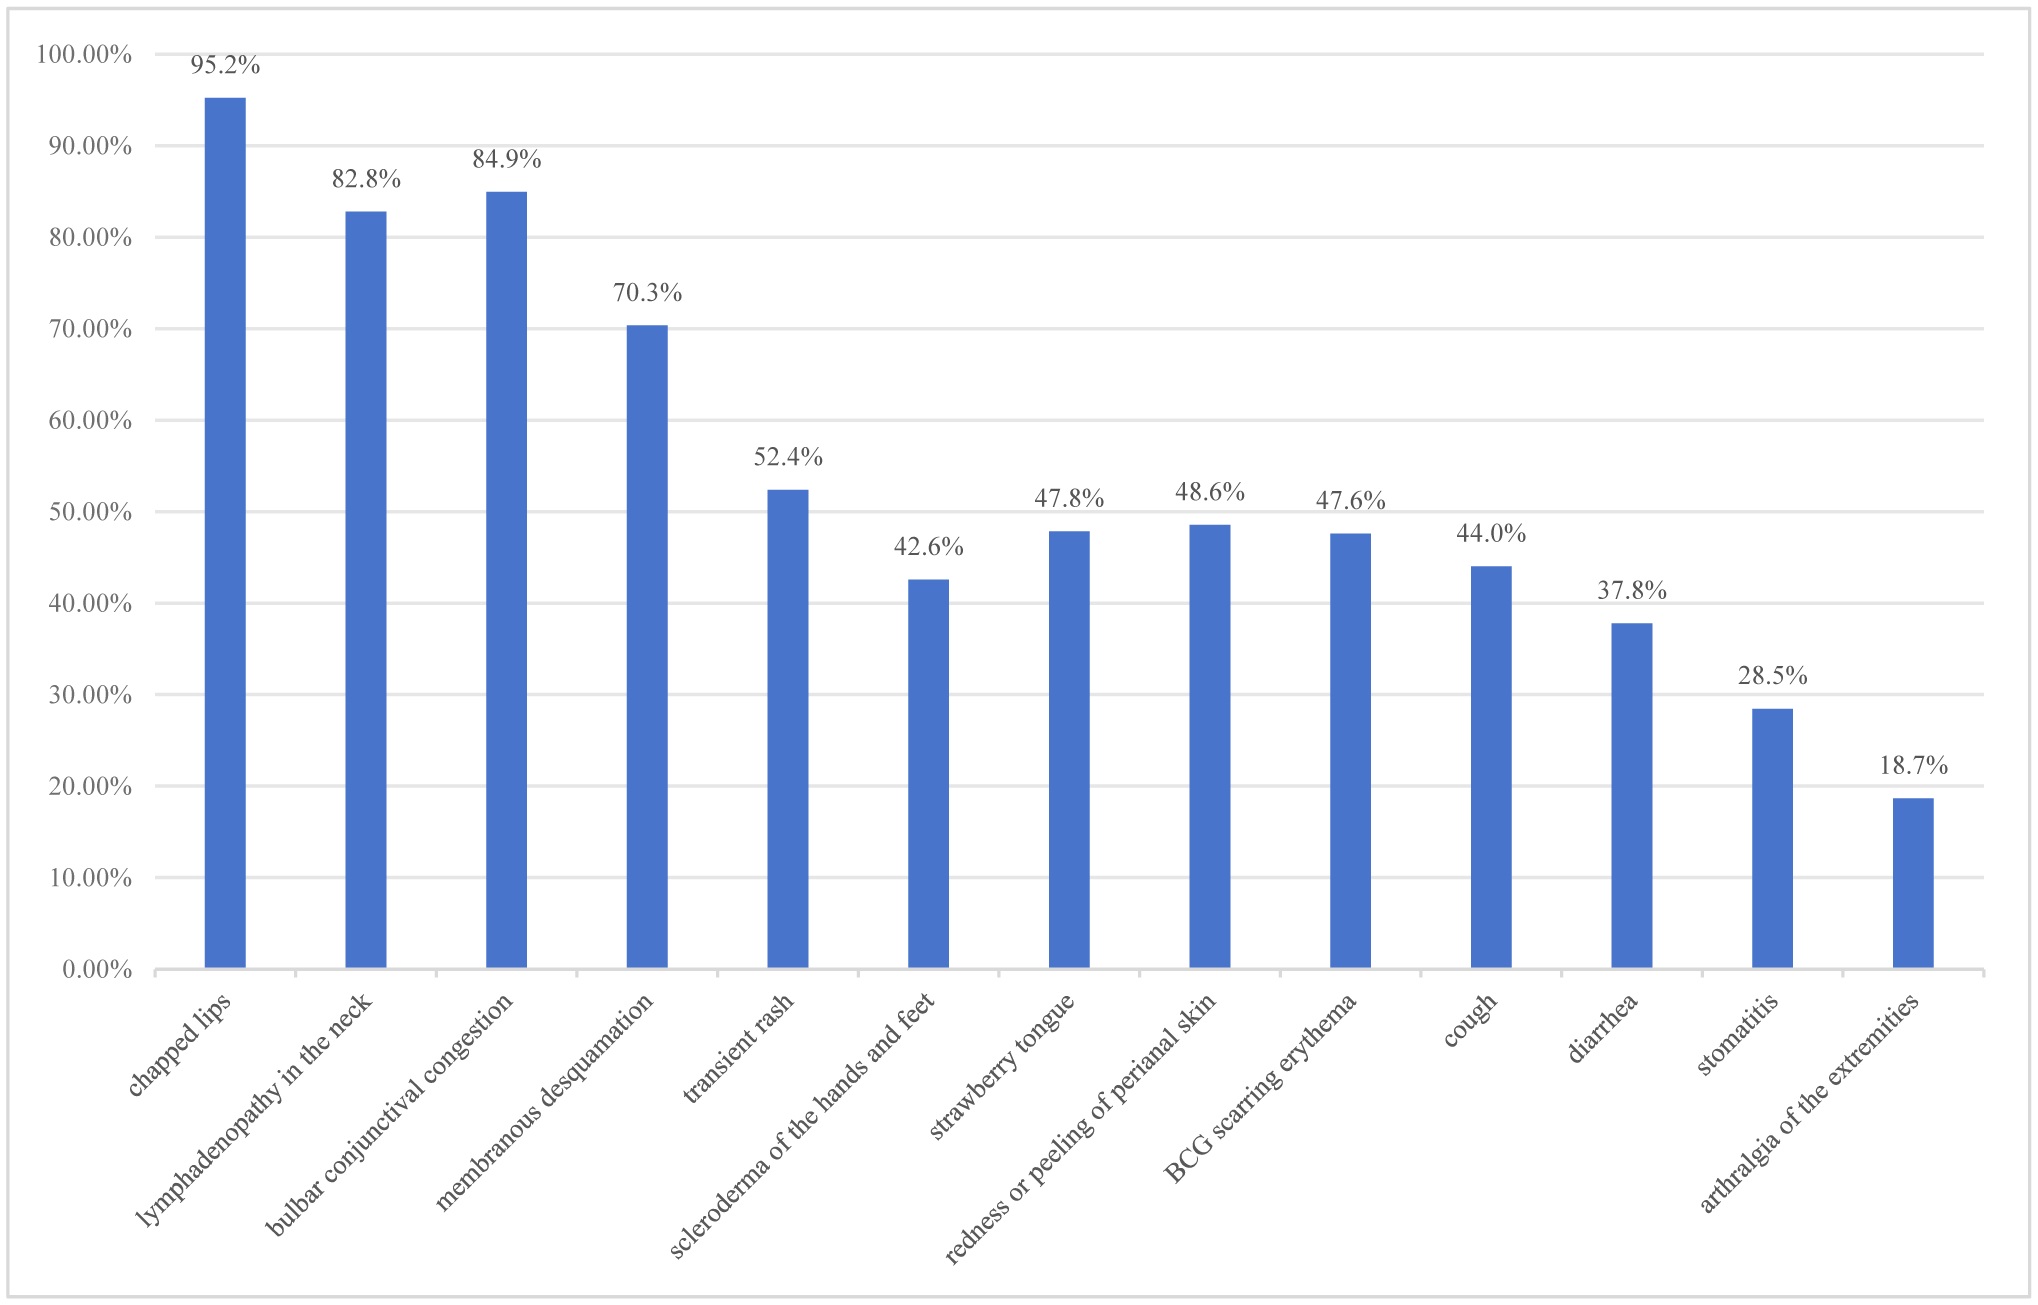
Among the 418 KD patients, the male-to-female ratio was 2.07:1 (276 males, 66.03%; 142 females, 33.97%), with 84.92% (355/418) under 5 years of age. The cohort included 292 cases (69.86%) of typical KD and 126 cases (30.14%) of incomplete KD. Coronary artery lesions were identified in 11.72% (49/418) of patients, with significantly higher incidence in the incomplete KD group [23.02% (29/126)] compared to the typical KD group [6.85% (20/292); χ² = 16.00, P < 0.001]. Subgroup analysis revealed that infants < 1 year old had a higher CAL rate [24.72% (22/89)] than 1–5-year-olds [9.40% (25/266); χ² = 11.95, P < 0.001]. Regarding treatment timing, the CAL incidence was significantly lower in patients receiving intravenous IVIG within 7 days of fever onset [6.74% (18/267)] compared to those treated at 7–10 days [20.53% (31/151); χ² = 16.53, P < 0.001].
Kawasaki disease primarily affects infants, with children under 1 year at higher risk for coronary artery lesions. Incomplete cases often present with atypical symptoms, requiring prompt diagnosis through imaging and lab tests. Early Intravenous immunoglobulin (IVIG) (2 g/kg) combined with aspirin within 7 days of onset significantly reduces coronary complications (6.74% vs. 20.53% with delayed treatment). Glucocorticoids are reserved for severe or IVIG-resistant cases. Immediate treatment initiation, regular echocardiography monitoring (using Z-score), and anticoagulation for high-risk patients are essential. Long-term follow-up is mandatory, with lifetime management for coronary abnormalities. The key strategy involves early recognition, standardized treatment within 10 days (optimally 7 days), and systematic follow-up to improve outcomes.
Citation: Xijia Xu, Fuyong Jiao, Fan Yang, Xinxin Xue, Yufen Hui, Hongping Zhong. Clinical features of Kawasaki disease and analysis of risk factors for coronary damage[J]. AIMS Medical Science, 2025, 12(2): 223-235. doi: 10.3934/medsci.2025014
To investigate the clinical characteristics and risk factors for coronary artery lesion (CAL) in Kawasaki disease (KD) through a comprehensive analysis of 418 pediatric cases, thereby enhancing the diagnostic and therapeutic approaches for this condition.
We conducted a retrospective analysis of 418 children diagnosed with KD and hospitalized between January 2017 and January 2024. Data on clinical manifestations, laboratory findings, echocardiography results, and treatment outcomes were systematically reviewed.
Among the 418 KD patients, the male-to-female ratio was 2.07:1 (276 males, 66.03%; 142 females, 33.97%), with 84.92% (355/418) under 5 years of age. The cohort included 292 cases (69.86%) of typical KD and 126 cases (30.14%) of incomplete KD. Coronary artery lesions were identified in 11.72% (49/418) of patients, with significantly higher incidence in the incomplete KD group [23.02% (29/126)] compared to the typical KD group [6.85% (20/292); χ² = 16.00, P < 0.001]. Subgroup analysis revealed that infants < 1 year old had a higher CAL rate [24.72% (22/89)] than 1–5-year-olds [9.40% (25/266); χ² = 11.95, P < 0.001]. Regarding treatment timing, the CAL incidence was significantly lower in patients receiving intravenous IVIG within 7 days of fever onset [6.74% (18/267)] compared to those treated at 7–10 days [20.53% (31/151); χ² = 16.53, P < 0.001].
Kawasaki disease primarily affects infants, with children under 1 year at higher risk for coronary artery lesions. Incomplete cases often present with atypical symptoms, requiring prompt diagnosis through imaging and lab tests. Early Intravenous immunoglobulin (IVIG) (2 g/kg) combined with aspirin within 7 days of onset significantly reduces coronary complications (6.74% vs. 20.53% with delayed treatment). Glucocorticoids are reserved for severe or IVIG-resistant cases. Immediate treatment initiation, regular echocardiography monitoring (using Z-score), and anticoagulation for high-risk patients are essential. Long-term follow-up is mandatory, with lifetime management for coronary abnormalities. The key strategy involves early recognition, standardized treatment within 10 days (optimally 7 days), and systematic follow-up to improve outcomes.

| [1] | Huang GY, Wang TY (2022) Pediatrics. People's Health Press. (Book in Chinese) |
| [2] | Park WY, Sang YL, Kim GB, et al. (2021) Clinical aspects for differential diagnosis of Kawasaki disease shock syndrome: a case control study. BMC Pediatr 21. https://doi.org/10.1186/s12887-020-02488-w |
| [3] | Center for Diagnosis and Treatment of Kawasaki Disease/Children's Hospital of Shaanxi Provincial People's Hospital, National Children's Medical Center/Beijing Children's Hospital, Capital Medical University, Children's Hospital, Shanghai Jiao Tong University School of Medicine, et al. (2023) Evidence-based guidelines for the diagnosis and treatment of Kawasaki disease in Chinese children (2023). Chinese J Contemp Pediatr 25: 1198-1210. https://doi.org/10.7499/j.issn.1008-8830.2309038 (Article in Chinese) |
| [4] |
Kobayashi T, Ayusawa M, Suzuki H, et al. (2020) Revision of diagnostic guidelines for Kawasaki disease (6th revised edition). Pediatr Int 62: 1135-1138. https://doi.org/10.1111/ped.14326 
|
| [5] | Hu YM (2015) Zhufutang practical pediatrics (8th Eds.). People's Health Publishing House (PRC), 778-788. (Book in Chinese) |
| [6] |
Mastrangelo G, Cimaz R, Calabri GB, et al. (2019) Kawasaki disease in infants less than one year of age: an Italian cohort from a single center. BMC Pediatr 19: 321. https://doi.org/10.1186/s12887-019-1695-0
|
| [7] |
Imasawa T, Saito C, Kai H, et al. (2023) Long-term effectiveness of a primary care practice facilitation program for chronic kidney disease management: an extended follow-up of a cluster-randomized FROM-J study. Nephrol Dial Transplant 38: 158-166. https://doi.org/10.1093/ndt/gfac041
|
| [8] |
Cai JH, Tang M, Zhang HX, et al. (2023) Therapeutic window of intravenous IVIG and its correlation with IVIG-resistant in Kawasaki disease: a retrospective study. J Pediatr 99: 161-167. https://doi.org/10.1016/j.jped.2022.07.003
|
| [9] |
Portman MA, Dahdah NS, Slee A, et al. (2019) Etanercept with IVIg for acute Kawasaki disease: a randomized controlled trial. Pediatrics 143: e20183675. https://doi.org/10.1542/peds.2018-3675
|
| [10] |
McCrindle BW, Rowley AH, Newburger JW, et al. (2017) Diagnosis, treatment, and long-term management of Kawasaki disease: a scientific statement for health professionals from the American Heart Association. Circulation 135: e927-e999. https://doi.org/10.1161/CIR.0000000000000484
|
| [11] | Guo YS, Tao YF, Yao FF (2024) Diagnostic value of echocardiography in children with acute Kawasaki disease with coronary artery dilation. J Rare Dis 31: 63-65. https://doi.org/10.3969/j.issn.1009-3257.2024.7.025 (Article in Chinese) |
| [12] |
Saliba T, Nevesny F, Antiochos P, et al. (2025) Progressive coronary aneurysms in Kawasaki disease: a case report and long-term follow-up. Radiol Case Rep 20: 2459-2462. https://doi.org/10.1016/j.radcr.2025.01.090
|
| [13] | Luo P, L JL, L CL (2022) Comparison of the value of CT and echocardiography in the assessment of cardiac function in pediatric patients with coronary artery lesions in Kawasaki disease. Chinese J CT MRI 20: 85-87. https://doi.org/10.3969/j.issn.1672-5131.2022.01.027 (Article in Chinese) |
| [14] | Ren J, Wang Y (2019) A case report of neonatal Kawasaki disease. Chinese J Evid Based Pediatr 14: 220-222. https://doi.org/10.3969/j.issn.1673-5501.2019.03.012. (Article in Chinese) |
| [15] | Cardiovascular Group of Chinese Medical Association Pediatrics, Rheumatology Group of Chinese Medical Association Pediatrics, Immunology Group of Chinese Medical Association Pediatrics, et al. (2022) Expert consensus on the diagnosis and acute phase treatment of Kawasaki disease. Chinese J Pediatr 60: 6-13. https://doi.org/10.3760/cma.j.cn112140-20211018-00879 (Article in Chinese) |
| [16] |
Fukazawa R, Kobayashi J, Ayusawa M, et al. (2020) JCS/JSCS 2020 guideline on diagnosis and management of cardiovascular sequelae in Kawasaki disease. Circ J 84: 1348-1407. https://doi.org/10.1253/circj.CJ-19-1094
|
| [17] | Jone PN, Tremoulet A, Choueiter N, et al. (2024) Update on diagnosis and management of Kawasaki disease: a scientific statement from the American Heart Association. Circulation 150: e481-e500. https://doi.org/10.1161/CIR.0000000000001295 |
| [18] |
Honkanen VE, McCrindle BW, Laxer RM, et al. (2003) Clinical relevance of the risk factors for coronary artery inflammation in Kawasaki disease. Pediatr Cardiol 24: 122-126. https://doi.org/10.1007/s00246-002-0063-1
|
| [19] |
Nakamura Y, Yashiro M, Uehara R, et al. (2012) Epidemiologic features of Kawasaki disease in Japan: results of the 2009-2010 nationwide survey. J Epidemiol 22: 216-221. https://doi.org/10.2188/jea.je20110126
|
| [20] | Ma WW, Zhao DA (2024) Research progress of cardiovascular complications in Kawasaki disease. Modern Clinical Medicine 50: 230-233. (Article in Chinese) |
| [21] | Wang SB, Pan SL, Luo G, et al. (2023) Systematic evaluation and meta-analysis of the efficacy and safety of infliximab in the treatment of IVIG-naïve Kawasaki disease. J Pediatr Pharm 29: 34-38. https://doi.org/10.13407/j.cnki.jpp.1672-108X.2023.01.011 (Article in Chinese) |
| [22] | The Subspecialty Group of Cardiology, the Society of Pediatrics, Chinese Medical Association, the Editorial Board, Chinese Journal of Pediatrics, Huang GY (2022) Recommendations for clinical management of coronary artery lesions in Kawasaki disease (2020 revision). Chinese J Pediatr 58: 718-724. https://doi.org/10.3760/cma.j.cn112140-20200422-00421 (Article in Chinese) |
| [23] |
Wang QH (2023) Clinical characterization of incomplete Kawasaki disease. China Contemp Med 30: 88-91. https://doi.org/10.3969/j.issn.1674-4721.2023.06.022 (Article in Chinese)
|
| [24] |
Kindgren E, Guerrero-Bosagna C, Ludvigsson J (2019) Heavy metals in fish and its association with autoimmunity in the development of juvenile idiopathic arthritis: a prospective birth cohort study. Pediatr Rheumatol 17: 33. https://doi.org/10.1186/s12969-019-0344-3
|
| [25] | Wang Y, Jiang JY, Deng Y, et al. (2025) Diagnosis of coronary artery lesions in children based on Z-score regression model. Chinese J Contemp Pediatr 27: 176-183. https://doi.org/10.7499/j.issn.1008-8830.2405030 (Article in Chinese) |
Figures(1) / Tables(5)

Xijia Xu, Fuyong Jiao, Fan Yang, Xinxin Xue, Yufen Hui, Hongping Zhong. Clinical features of Kawasaki disease and analysis of risk factors for coronary damage[J]. AIMS Medical Science, 2025, 12(2): 223-235. doi: 10.3934/medsci.2025014


 DownLoad: