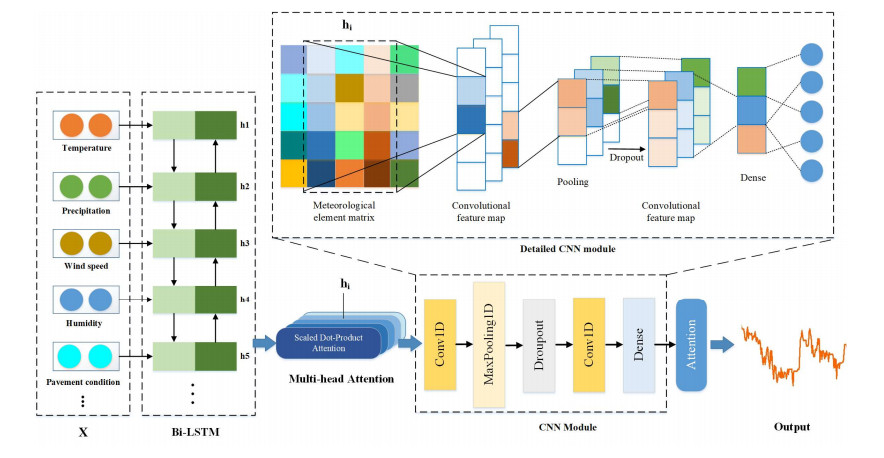
Meteorological disasters along highways significantly reduce road traffic efficiency. Low visibility caused by heavy fog is a severe meteorological disaster that greatly increases highway traffic accidents. Accurately predicting highway visibility and taking timely response measures can reduce the impact of meteorological disasters and improve traffic safety. We proposed an Attention-based BiLSTM-CNN (ABCNet) model, which synergized attention mechanisms with BiLSTM and CNN technologies to forecast atmospheric visibility more accurately. First, the Bi-LSTM module processed information both forward and backward, capturing intricate temporal dependencies in the model. Second, the multi-head attention mechanism following the Bi-LSTM distilled and prioritized salient features from multiple aspects of the sequence data. Third, the CNN module recognized local spatial features, and a singular attention mechanism refined the feature map after the CNN module, further enhancing the model's accuracy and predictive capability. Experiments showed that the model was accurate, effective, and significantly advanced compared to conventional models. It could fully extract the spatiotemporal characteristics of meteorological elements. The model was integrated into practical systems with positive results. Additionally, this study provides a self-collected meteorological dataset for highways in high-altitude mountainous areas.
Citation: Wen Li, Xuekun Yang, Guowu Yuan, Dan Xu. ABCNet: A comprehensive highway visibility prediction model based on attention, Bi-LSTM and CNN[J]. Mathematical Biosciences and Engineering, 2024, 21(3): 4397-4420. doi: 10.3934/mbe.2024194
Meteorological disasters along highways significantly reduce road traffic efficiency. Low visibility caused by heavy fog is a severe meteorological disaster that greatly increases highway traffic accidents. Accurately predicting highway visibility and taking timely response measures can reduce the impact of meteorological disasters and improve traffic safety. We proposed an Attention-based BiLSTM-CNN (ABCNet) model, which synergized attention mechanisms with BiLSTM and CNN technologies to forecast atmospheric visibility more accurately. First, the Bi-LSTM module processed information both forward and backward, capturing intricate temporal dependencies in the model. Second, the multi-head attention mechanism following the Bi-LSTM distilled and prioritized salient features from multiple aspects of the sequence data. Third, the CNN module recognized local spatial features, and a singular attention mechanism refined the feature map after the CNN module, further enhancing the model's accuracy and predictive capability. Experiments showed that the model was accurate, effective, and significantly advanced compared to conventional models. It could fully extract the spatiotemporal characteristics of meteorological elements. The model was integrated into practical systems with positive results. Additionally, this study provides a self-collected meteorological dataset for highways in high-altitude mountainous areas.

| [1] |
R. Faturechi, E. Miller-Hooks, Measuring the performance of transportation infrastructure systems in disasters: A comprehensive review, J. Infrastruct. Syst., 21 (2015), 04014025. https://doi.org/10.1061/(ASCE)IS.1943-555X.0000212 doi: 10.1061/(ASCE)IS.1943-555X.0000212

|
| [2] |
Y. Zou, Y. Zhang, K. Cheng, Exploring the impact of climate and extreme weather on fatal traffic accidents, Sustainability, 13 (2021), 390. https://doi.org/10.3390/su13010390 doi: 10.3390/su13010390
|
| [3] |
E. Petrova, Natural hazard impacts on transport infrastructure in Russia, Nat. Hazards Earth Syst. Sci., 20 (2020), 1969–1983. https://doi.org/10.5194/nhess-20-1969-2020 doi: 10.5194/nhess-20-1969-2020
|
| [4] |
H. Lu, M. Chen, W. Kuang, The impacts of abnormal weather and natural disasters on transport and strategies for enhancing ability for disaster prevention and mitigation, Transp. Policy, 98 (2020), 2–9. https://doi.org/10.1016/j.tranpol.2019.10.006 doi: 10.1016/j.tranpol.2019.10.006
|
| [5] |
S. Zhu, H. Yang, D. Liu, H. Wang, L. Zhou, C. Zhu, et al., Observations and forecasts of urban transportation meteorology in China: A review, Atmosphere, 13 (2022), 1823. https://doi.org/10.3390/atmos13111823 doi: 10.3390/atmos13111823
|
| [6] |
C. Zhang, M. Wu, J. Chen, K. Chen, C. Zhang, C. Xie, et al., Weather visibility prediction based on multimodal fusion, IEEE Access, 7 (2019), 74776–74786. https://doi.org/10.1109/ACCESS.2019.2920865 doi: 10.1109/ACCESS.2019.2920865
|
| [7] |
S. Cornejo-Bueno, D. Casillas-Pérez, L. Cornejo-Bueno, M. I. Chidean, A. J. Caamaño, J. Sanz-Justo, et al., Persistence analysis and prediction of low-visibility events at Valladolid Airport, Spain, Symmetry, 12 (2020), 1045. https://doi.org/10.3390/sym12061045 doi: 10.3390/sym12061045
|
| [8] |
H. Kamangir, W. Collins, P. Tissot, S. A. King, H. T. H. Dinh, N. Durham, et al., FogNet: A multiscale 3D CNN with double-branch dense block and attention mechanism for fog prediction, Mach. Learn. Appl., 5 (2021), 100038. https://doi.org/10.1016/j.mlwa.2021.100038 doi: 10.1016/j.mlwa.2021.100038
|
| [9] |
Z. Liu, Y. Chen, X. Gu, J. K. Yeoh, Q. Zhang, Visibility classification and influencing-factors analysis of airport: A deep learning approach, Atmos. Environ., 278 (2022), 119085. https://doi.org/10.1016/j.atmosenv.2022.119085 doi: 10.1016/j.atmosenv.2022.119085
|
| [10] |
Z. Yu, Y. Qu, Y. Wang, J. Ma, Y. Cao, Application of machine-learning-based fusion model in visibility forecast: A case study of Shanghai, China, Remote Sens., 13 (2021), 2096. https://doi.org/10.3390/rs13112096 doi: 10.3390/rs13112096
|
| [11] |
Z. Zang, X. Bao, Y. Li, Y. Qu, D. Niu, N. Liu, et al., A modified rnn-based deep learning method for prediction of atmospheric visibility, Remote Sens., 15 (2023), 553. https://doi.org/10.3390/rs15030553 doi: 10.3390/rs15030553
|
| [12] |
L. C. Ortega, L. D. Otero, M. Solomon, C. E. Otero, A. Fabregas, Deep learning models for visibility forecasting using climatological data, Int. J. Forecasting, 39 (2023), 992–1004. https://doi.org/10.1016/j.ijforecast.2022.03.009 doi: 10.1016/j.ijforecast.2022.03.009
|
| [13] |
C. Peláez-Rodríguez, J. Pérez-Aracil, A. de Lopez-Diz, C. Casanova-Mateo, D. Fister, S. Jiménez-Fernández, et al., Deep learning ensembles for accurate fog-related low-visibility events forecasting, Neurocomputing, 549 (2023), 126435. https://doi.org/10.1016/j.neucom.2023.126435 doi: 10.1016/j.neucom.2023.126435
|
| [14] |
M. Kim, K. Lee, Y. H. Lee, Visibility data assimilation and prediction using an observation network in South Korea, Pure Appl. Geophys., 177 (2020), 1125–1141. https://doi.org/10.1007/s00024-019-02288-z doi: 10.1007/s00024-019-02288-z
|
| [15] |
W. Qian, J. C. H. Leung, Y. Chen, S. Huang, Applying anomaly-based weather analysis to the prediction of low visibility associated with the coastal fog at Ningbo-Zhoushan Port in East China, Adv. Atmos. Sci., 36 (2019), 1060–1077. https://doi.org/10.1007/s00376-019-8252-5 doi: 10.1007/s00376-019-8252-5
|
| [16] |
S. Fernández-González, P. Bolgiani, J. Fernández-Villares, P. González, A. García-Gil, J. C. Suárez, et al., A. Forecasting of poor visibility episodes in the vicinity of Tenerife Norte Airport, Atmos. Res., 223 (2019), 49–59. https://doi.org/10.1016/j.atmosres.2019.03.012 doi: 10.1016/j.atmosres.2019.03.012
|
| [17] |
R. Pahlavan, M. Moradi, S. Tajbakhsh, M. Azadi, M. Rahnama, Numerical prediction of several radiation and CBL fog events over Iran using the WRF model for late December 2015, J. Earth Space Phys., 46 (2020), 561–582. https://doi.org/10.22059/jesphys.2020.299678.1007202 doi: 10.22059/jesphys.2020.299678.1007202
|
| [18] |
S. Egli, B. Thies, J. Bendix, A hybrid approach for fog retrieval based on a combination of satellite and ground truth data, Remote Sens., 10 (2018), 628. https://doi.org/10.3390/rs10040628 doi: 10.3390/rs10040628
|
| [19] |
B. Y. Kim, J. W. Cha, K. H. Chang, C. Lee, Visibility prediction over South Korea based on random forest, Atmosphere, 12 (2021), 552. https://doi.org/10.3390/atmos12050552 doi: 10.3390/atmos12050552
|
| [20] |
W. Wen, L. Li, P. W. Chan, Y. Y. Liu, M. Wei, Research on the usability of different machine learning methods in visibility forecasting, Atmósfera, 37 (2023). https://doi.org/10.20937/atm.53053 doi: 10.20937/atm.53053
|
| [21] |
M. Zhen, M. Yi, T. Luo, F. Wang, K. Yang, X. Ma, et al., Application of a fusion model based on machine learning in visibility prediction, Remote Sens., 15 (2023), 1450. https://doi.org/10.3390/rs15051450 doi: 10.3390/rs15051450
|
| [22] | X. Shi, Z. Feng, H. Zhao, X. Zhao, Q. Yang, Y. Pan, Research on Starlink constellation simulation and target area visibility algorithm, in International Conference on Signal Processing, Computer Networks, and Communications (SPCNC 2022), 12626 (2023), 443–450. https://doi.org/10.1117/12.2674416 |
| [23] | Yunnan Provincial Market Supervision Administration, Technical Specifications for Construction of Highway Meteorological Station Networks (DB53/T 1091-2022), 2022. Yunnan Province Local Standards. |
| [24] | National Engineering Laboratory for Surface Transportation Weather Impacts Prevention, Broadvision Engineering Consultants Co., Ltd., Highway Meteorological Dataset, 2023. Available from: https://www.kaggle.com/datasets/liphynix2003/highway-meteorological-dataset/. |
| [25] | THREDDS meteogalicia raw Iowa State University, Weather Forecasting at Vigo Airport Using AI, 2020. Available from: https://www.kaggle.com/datasets/jorgerobinat/weather-forecasting-at-vigo-airport-using-ai/data. |
| [26] |
A. Galassi, M. Lippi, P. Torroni, Attention in natural language processing, IEEE Trans. Neural Networks Learn. Syst., 32 (2020), 4291–4308. https://doi.org/10.1109/TNNLS.2020.3019893 doi: 10.1109/TNNLS.2020.3019893
|
| [27] |
A. Vaswani, N. Shazeer, N. Parmar, J. Uszkoreit, L. Jones, A. N. Gomez, et al., Attention is all you need, Adv. Neural Inf. Process. Syst., 30 (2017). https://doi.org/10.48550/arXiv.1706.03762 doi: 10.48550/arXiv.1706.03762
|
| [28] |
V. I. Kontopoulou, A. D. Panagopoulos, I. Kakkos, G. K. Matsopoulos, A review of ARIMA vs. machine learning approaches for time series forecasting in data driven networks, Future Internet, 15 (2023), 255. https://doi.org/10.3390/fi15080255 doi: 10.3390/fi15080255
|
| [29] |
D. K. Singh, N. Rawat. Machine learning for weather forecasting: XGBoost vs SVM vs random forest in predicting temperature for visakhapatnam, Int. J. Intell. Syst. Appl., 15 (2023), 1–12. https://doi.org/10.5815/ijisa.2023.05.05. doi: 10.5815/ijisa.2023.05.05
|
| [30] |
R. Huang, C. Wei, B. Wang, J. Yang, X. Xu, S. Wu, et al., Well performance prediction based on Long Short-Term Memory (LSTM) neural network, J. Pet. Sci. Eng., 208 (2022), 109686. https://doi.org/10.1016/j.petrol.2021.109686 doi: 10.1016/j.petrol.2021.109686
|
| [31] |
S. Jung, J. Moon, S. Park, E. Hwang, An attention-based multilayer GRU model for multistep-ahead short-term load forecasting, Sensors, 21 (2021), 1639. https://doi.org/10.3390/s21051639 doi: 10.3390/s21051639
|
| [32] | C. Han, H. Park, Y. Kim, G. Gim, Hybrid CNN-LSTM based time series data prediction model study, in IEEE/ACIS International Conference on Big Data, Cloud Computing, and Data Science Engineering, Danang, Vietnam, (2022), 43–54. https://doi.org/10.1007/978-3-031-19608-9_4 |
| [33] |
H. Abbasimehr, R. Paki, Improving time series forecasting using LSTM and attention models, J. Ambient Intell. Hum. Comput., (2022), 1–19. https://doi.org/10.1007/s12652-020-02761-x doi: 10.1007/s12652-020-02761-x
|
| [34] | A. Zeng, M. Chen, L. Zhang, Q. Xu, Are transformers effective for time series forecasting, in Proceedings of the AAAI Conference on Artificial Intelligence, Washington DC, USA, 37 (2023), 11121–11128. https://doi.org/10.1609/aaai.v37i9.26317 |
| [35] | National Engineering Laboratory for Surface Transportation Weather Impacts Prevention & Broadvision Engineering Consultants Co., Ltd. Highway Traffic Meteorological Intelligent Monitoring and Proactive Control System, 2024. Available from: https://220.163.107.220: 11020/jtqx. |


Figures(11) / Tables(8)

Wen Li, Xuekun Yang, Guowu Yuan, Dan Xu. ABCNet: A comprehensive highway visibility prediction model based on attention, Bi-LSTM and CNN[J]. Mathematical Biosciences and Engineering, 2024, 21(3): 4397-4420. doi: 10.3934/mbe.2024194


 DownLoad: