Biometric authentication prevents losses from identity misuse in the artificial intelligence (AI) era. The fusion method integrates palmprint and palm vein features, leveraging their stability and security and enhances counterfeiting prevention and overall system efficiency through multimodal correlations. However, most of the existing multi-modal palmprint and palm vein feature extraction methods extract only feature information independently from different modalities, ignoring the importance of the correlation between different modal samples in the class to the improvement of recognition performance. In this study, we addressed the aforementioned issues by proposing a feature-level joint learning fusion approach for palmprint and palm vein recognition based on modal correlations. The method employs a sparse unsupervised projection algorithm with a "purification matrix" constraint to enhance consistency in intra-modal features. This minimizes data reconstruction errors, eliminating noise and extracting compact, and discriminative representations. Subsequently, the partial least squares algorithm extracts high grayscale variance and category correlation subspaces from each modality. A weighted sum is then utilized to dynamically optimize the contribution of each modality for effective classification recognition. Experimental evaluations conducted for five multimodal databases, composed of six unimodal databases including the Chinese Academy of Sciences multispectral palmprint and palm vein databases, yielded equal error rates (EER) of 0.0173%, 0.0192%, 0.0059%, 0.0010%, and 0.0008%. Compared to some classical methods for palmprint and palm vein fusion recognition, the algorithm significantly improves recognition performance. The algorithm is suitable for identity recognition in scenarios with high security requirements and holds practical value.
Citation: Wei Wu, Yuan Zhang, Yunpeng Li, Chuanyang Li. Fusion recognition of palmprint and palm vein based on modal correlation[J]. Mathematical Biosciences and Engineering, 2024, 21(2): 3129-3145. doi: 10.3934/mbe.2024139
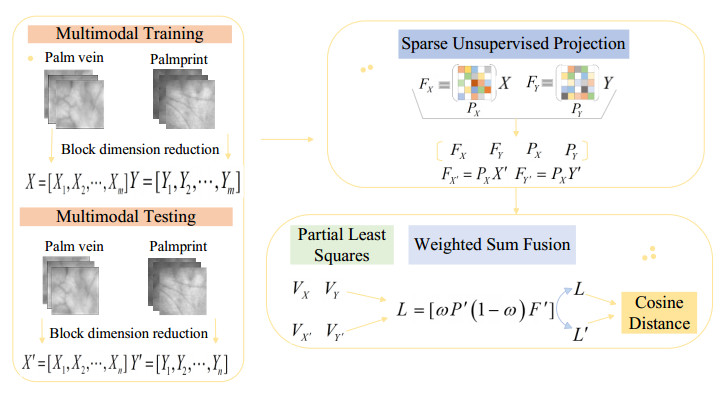
Biometric authentication prevents losses from identity misuse in the artificial intelligence (AI) era. The fusion method integrates palmprint and palm vein features, leveraging their stability and security and enhances counterfeiting prevention and overall system efficiency through multimodal correlations. However, most of the existing multi-modal palmprint and palm vein feature extraction methods extract only feature information independently from different modalities, ignoring the importance of the correlation between different modal samples in the class to the improvement of recognition performance. In this study, we addressed the aforementioned issues by proposing a feature-level joint learning fusion approach for palmprint and palm vein recognition based on modal correlations. The method employs a sparse unsupervised projection algorithm with a "purification matrix" constraint to enhance consistency in intra-modal features. This minimizes data reconstruction errors, eliminating noise and extracting compact, and discriminative representations. Subsequently, the partial least squares algorithm extracts high grayscale variance and category correlation subspaces from each modality. A weighted sum is then utilized to dynamically optimize the contribution of each modality for effective classification recognition. Experimental evaluations conducted for five multimodal databases, composed of six unimodal databases including the Chinese Academy of Sciences multispectral palmprint and palm vein databases, yielded equal error rates (EER) of 0.0173%, 0.0192%, 0.0059%, 0.0010%, and 0.0008%. Compared to some classical methods for palmprint and palm vein fusion recognition, the algorithm significantly improves recognition performance. The algorithm is suitable for identity recognition in scenarios with high security requirements and holds practical value.

| [1] |
S. P. Zhao, L. K. Fei, J. Wen, Multiview-learning-based generic palmprint recognition: A literature review, Mathematics, 11 (2023), 1261–1261. https://doi.org/10.3390/math11051261 doi: 10.3390/math11051261

|
| [2] |
S. Y. Li, B. Zhang, Joint discriminative sparse coding for robust hand-based multimodal recognition, IEEE Trans. Inf. Forensics and Secur., 16 (2021), 3186–3198. https://doi.org/10.1109/TIFS.2021.3074315 doi: 10.1109/TIFS.2021.3074315
|
| [3] | K. Zhang, H. Wang, C. Yu, M. Du, L. Tao, Class constraint-based discriminative features learning algorithm for palm print and palm vein fusion recognition, in 2022 7th International Conference on Signal and Image Processing (ICSIP), (2022), 275–280. https://doi.org/10.1109/ICSIP55141.2022.9886189 |
| [4] | H. S. Kala, S. Kumar, R. B. Reddy, N. Shastry, R. Thakur, Contactless authentication device using palm vein and palm print fusion biometric technology for post covid world, in 2021 International Conference on Design Innovations for 3Cs Compute Communicate Control (ICDI3C), (2021), 281–285. https://doi.org/10.1109/ICDI3C53598.2021.00063 |
| [5] | T. R. Yashavanth, M. Suresh, Performance analysis of multimodal biometric system using LBP and PCA, in 2023 International Conference on Recent Trends in Electronics and Communication (ICRTEC), (2023), 1–5. https://doi.org/10.1109/ICRTEC56977.2023.10111925 |
| [6] | S. Li, B. Zhang, L. Wu, R. Ma, X. Ning, Robust and sparse least square regression for finger vein and finger knuckle print recognition, IEEE Trans. Inf. Forensics Secur., (2024), 2709–2719. https://doi.org/10.1109/TIFS.2024.3352389 |
| [7] |
T. Wu, L. Leng, M. K. Khan, F. A. Khan, Palmprint-palmvein fusion recognition based on deep hashing network, IEEE Access, 9 (2021), 135816–135827. https://doi.org/10.1109/ACCESS.2021.3112513 doi: 10.1109/ACCESS.2021.3112513
|
| [8] | L. G. Oldal, A. Kovács, Hand geometry and palmprint-based authentication using image processing, in 2020 IEEE 18th International Symposium on Intelligent Systems and Informatics (SISY), (2020), 125–130. https://doi.org/10.1109/SISY50555.2020.9217068 |
| [9] | C. Ramachandran, D. Sankar, Score level based fusion method for multimodal biometric recognition using palmprint and Iris, in 2020 Advanced Computing and Communication Technologies for High Performance Applications (ACCTHPA), (2020), 281–286. https://doi.org/10.1109/ACCTHPA49271.2020.9213216 |
| [10] |
N. Bala, R. Gupta, A. Kumar, Multimodal biometric system based on fusion techniques: A review, Inf. Secur. J., 31(2022), 289–337. https://doi.org/10.1080/19393555.2021.1974130 doi: 10.1080/19393555.2021.1974130
|
| [11] |
S. C. Cho, B. S. Oh, K. A. Toh, Z. P. Lin, Extraction and cross-matching of palm-vein and palmprint from the RGB and the NIR spectrums for identity verification, IEEE Access, 8(2020), 4005–4021. https://doi.org/10.1109/ACCESS.2019.2963078 doi: 10.1109/ACCESS.2019.2963078
|
| [12] | H. S. Mohammad, A. D. Mohammad, S. Hamed, A hybrid approach for multimodal biometric recognition based on feature level fusion in reproducing Kernel Hilbert Space, in 2022 30th International Conference on Electrical Engineering (ICEE), (2022), 796–802. https://doi.org/10.1109/ICEE55646.2022.9827154 |
| [13] | D. V. R. Devi, K. N. Rao, Decision level fusion schemes for a multimodal biometric system using local and global wavelet features, in 2020 IEEE International Conference on Electronics, Computing and Communication Technologies (CONECCT), (2020), 1–6. http://dx.doi.org/10.1109/conecct50063.2020.9198547 |
| [14] | W. L. Yang, J. D. Huang, D. Luo, W. X. Kang, Efficient disentangled representation learning for multi-modal finger biometrics, Pattern Recognit., 145 (2024). https://doi.org/10.1016/j.patcog.2023.109944 |
| [15] | H. S. Kala, K. Shreya, B. R. Rakshanda, S. Nishanth, T. Rounak, Contactless authentication device using palm vein and palmprint fusion biometric technology for post covid world, in 2021 International Conference on Design Innovations for 3Cs Compute Communicate Control (ICDI3C), (2021), 281–285. https://doi.org/10.1109/ICDI3C53598.2021.00063 |
| [16] |
T. F. Wu, L. Leng, M. K. Khan, F. A. Khan, Palmprint-palmvein fusion recognition based on deep hashing network, IEEE Access, 9 (2021), 135816–135827. https://doi.org/10.1109/ACCESS.2021.3112513 doi: 10.1109/ACCESS.2021.3112513
|
| [17] |
C. Y. Zhou, J. Huang, F. Yang, Y. Q. Liu, A hybrid fusion model of iris, palm vein and finger vein for multi-biometric recognition system, Multimedia Tools Appl., 79 (2020), 1–22. https://doi.org/10.1007/s11042-020-08914-6 doi: 10.1007/s11042-020-08914-6
|
| [18] | S. A. Bala, Z. B. Abdullahi, C. Ponlawat, A. Muhammad, Sequence-wise multimodal biometric fingerprint and finger-vein recognition network (STMFPFV-Net), Intell. Syst. Appl., 19 (2023). https://doi.org/10.2139/ssrn.4432356 |
| [19] |
W. Wu, Q. Wang, S. Q. Yu, Q. Luo, S. Lin, Z. Han, Y. D. Tang, Outside box and contactless palm vein recognition based on a wavelet denoising ResNet, IEEE Access, 9 (2021), 82471–82484. https://doi.org/10.1109/ACCESS.2021.3086811 doi: 10.1109/ACCESS.2021.3086811
|
| [20] | L. Zhang, L. Li, A. Yang, Y. Shen, M. Yang, Towards contactless palmprint recognition: A novel device, a new benchmark, and a collaborative representation based identification approach, Pattern Recognit., 69 (2017), 199–212. https://doi.org/10.1016/j.patcog.2017.04.016 |
| [21] |
Y. Zhou, A. Kumar, Human identification using palm-vein images, IEEE Trans. Inf. Forensics Secur., 6 (2011), 1259–1274. https://doi.org/10.1109/TIFS.2011.2158423 doi: 10.1109/TIFS.2011.2158423
|
| [22] |
D. Zhang, Z. Guo, G. M. Lu, L. Zhang, W. M. Zuo, An online system of multispectral palmprint verification, IEEE Trans. Instrum. Measurement, 59 (2010), 480–490. https://doi.org/10.1109/TIM.2009.2028772 doi: 10.1109/TIM.2009.2028772
|
| [23] | W. Q. Yuan, W. Wu, S. Lin, H. Song, H. T. Zhang, Non-contact biometric recognition of palm vein based on block and partial least squares, Chinese J. Sci. Instrum., 34 (2013), 31–39. |
| [24] |
B. Jay, K. Ajay, On estimating performance indices for biometric identification, Pattern Recognit., 42 (2009), 1803–1815. https://doi.org/10.1016/j.patcog.2008.10.004 doi: 10.1016/j.patcog.2008.10.004
|
| [25] |
J. Y. Wang, L. Wang, F. P. Nie, X. L. Li, Joint feature selection and extraction with sparse unsupervised projection, IEEE Trans. Neural Networks Learn. Syst., 34 (2021), 3071–3081. https://doi.org/10.1109/TNNLS.2021.3111714 doi: 10.1109/TNNLS.2021.3111714
|
| [26] |
E. Alhatami, U. A. Bhatti, M. X. Huang, S. L. Feng, Review and enhancement of discrete cosine transform (DCT) for medical image fusion, Springer Nat. Singapore, 614 (2023), 89–97. http://dx.doi.org/10.1007/978-981-19-9331-2_8 doi: 10.1007/978-981-19-9331-2_8
|
| [27] |
J. Almaghtuf, F. Khelifi, A. Bouridane, Fast and efficient difference of block means code for palmprint recognition, Mach. Vision Appl., 31 (2020), 478–487. https://doi.org/10.1007/s00138-020-01103-3 doi: 10.1007/s00138-020-01103-3
|
| [28] |
G. Manas, D. Aniruddha, Fractional-weighted entropy-based fuzzy G-2DLDA algorithm: A new facial feature extraction method, Multimedia Tools Appl., 82 (2022), 2689–2707. https://doi.org/10.1007/s11042-022-13328-7 doi: 10.1007/s11042-022-13328-7
|
| [29] |
A. Zainab, W. L. Jong, A. K. Muhammad, S. Muhammad, A. K. Sajid, R. Naveed, Optical character recognition (OCR) using partial least square (PLS) based feature reduction: an application to artificial intelligence for biometric identification, J. Enterp. Inf. Manage., 36 (2020), 767–789. https://doi.org/10.1108/JEIM-02-2020-0076 doi: 10.1108/JEIM-02-2020-0076
|
| [30] |
X. W. Zhao, J. Guo, F. P. Nie, L. Chen, Z. H. Li, H. X. Zhang, Joint principal component and discriminant analysis for dimensionality reduction, IEEE Trans. Neural Networks Learn. Syst., 31 (2020), 433–444. https://doi.org/10.1109/TNNLS.2019.2904701 doi: 10.1109/TNNLS.2019.2904701
|


Figures(7) / Tables(6)

Wei Wu, Yuan Zhang, Yunpeng Li, Chuanyang Li. Fusion recognition of palmprint and palm vein based on modal correlation[J]. Mathematical Biosciences and Engineering, 2024, 21(2): 3129-3145. doi: 10.3934/mbe.2024139


 DownLoad: