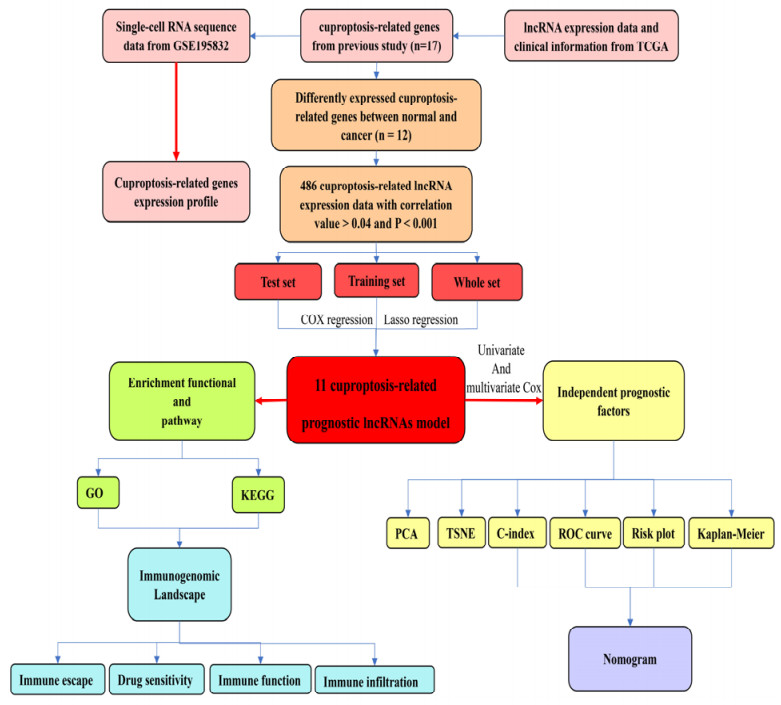
Head and neck squamous cell carcinoma (HNSCC) is an urgent public health issue due to its poor prognosis and resistance to anti-cancer agents. However, the role of cuproptosis, a newly identified form cell death, in applications of HNSCC is still not a known. In this study, single-cell RNA sequencing data was used to explore cuproptosis-related gene expression in the tumour microenvironment. A prognostic model was constructed based on the cuproptosis-related lncRNA. Various methods were performed to predict the overall survival (OS) of different risk score patients and explore difference in enrichment function and pathways between the risk score patients. Finally, a series of immunogenomic landscape analyses were performed and evaluated the immune function, immune infiltration and sensitivity to chemotherapeutic agents. Cancer cell cluster expressed the essential cuproptosis-related gene. As the risk score increased of HNSCC patients, a significant decrease in survival status and time occurred for patients in the high-risk score patient. The AUC for predicting 1-, 3-, and 5-years OS were 0.679, 0.713 and 0.656, indicating that the model regarded as an independent prognostic signature in comparison with the clinical-pathological characteristics. As a results of GO, the immune function and immune infiltration of different risk score patients were assessed, revealing significant differences in T cell function and abundance of different types of T cells. Low-risk score patients are relatively insensitive to chemotherapy agents such as docetaxel and cisplatin, and easily resistant to immunotherapy. A cuproptosis-related lncRNA prognostic model was constructed to predict OS of HNSCC patients and provided the newly therapeutic strategies.
Citation: Changxiang Huan, Jiaxin Gao. A novel cuproptosis-related lncRNA prognostic signature for predicting treatment and immune environment of head and neck squamous cell carcinoma[J]. Mathematical Biosciences and Engineering, 2022, 19(12): 12127-12145. doi: 10.3934/mbe.2022564
Head and neck squamous cell carcinoma (HNSCC) is an urgent public health issue due to its poor prognosis and resistance to anti-cancer agents. However, the role of cuproptosis, a newly identified form cell death, in applications of HNSCC is still not a known. In this study, single-cell RNA sequencing data was used to explore cuproptosis-related gene expression in the tumour microenvironment. A prognostic model was constructed based on the cuproptosis-related lncRNA. Various methods were performed to predict the overall survival (OS) of different risk score patients and explore difference in enrichment function and pathways between the risk score patients. Finally, a series of immunogenomic landscape analyses were performed and evaluated the immune function, immune infiltration and sensitivity to chemotherapeutic agents. Cancer cell cluster expressed the essential cuproptosis-related gene. As the risk score increased of HNSCC patients, a significant decrease in survival status and time occurred for patients in the high-risk score patient. The AUC for predicting 1-, 3-, and 5-years OS were 0.679, 0.713 and 0.656, indicating that the model regarded as an independent prognostic signature in comparison with the clinical-pathological characteristics. As a results of GO, the immune function and immune infiltration of different risk score patients were assessed, revealing significant differences in T cell function and abundance of different types of T cells. Low-risk score patients are relatively insensitive to chemotherapy agents such as docetaxel and cisplatin, and easily resistant to immunotherapy. A cuproptosis-related lncRNA prognostic model was constructed to predict OS of HNSCC patients and provided the newly therapeutic strategies.

| [1] | B. Solomon, R. J. Young, D. Rischin, Head and neck squamous cell carcinoma: Genomics and emerging biomarkers for immunomodulatory cancer treatments, in Seminars in Cancer Biology, 52 (2018), 228-240. https://doi.org/10.1016/j.semcancer.2018.01.008 |
| [2] |
H. Sung, J. Ferlay, R. L. Siegel, M. Laversanne, I. Soerjomataram, A. Jemal, et al., Global cancer statistics 2020: GLOBOCAN estimates of incidence and mortality worldwide for 36 cancers in 185 countries, CA Cancer J. Clin., 71 (2021), 209-249. https://doi.org/10.3322/caac.21660 doi: 10.3322/caac.21660

|
| [3] |
T. Keswani, S. Mitra, A. Bhattacharyya, Copper-induced immunotoxicity involves cell cycle arrest and cell death in the liver, Environ. Toxicol., 30 (2015), 411-421. https://doi.org/10.1002/tox.21916 doi: 10.1002/tox.21916
|
| [4] |
E. V. Polishchuk, A. Merolla, J. Lichtmannegger, A. Romano, A. Indrieri, E. Y. Ilyechova, et al., Activation of autophagy, observed in liver tissues from patients with wilson disease and from ATP7B-Deficient animals, protects hepatocytes from copper-induced apoptosis, Gastroenterology, 156 (2019), 1173-1189. https://doi.org/10.1053/j.gastro.2018.11.032 doi: 10.1053/j.gastro.2018.11.032
|
| [5] |
X. Ren, Y. Li, Y. Zhou, W. Hu, C. Yang, Q. Jing, et al., Overcoming the compensatory elevation of NRF2 renders hepatocellular carcinoma cells more vulnerable to disulfiram/copper-induced ferroptosis, Redox Biol., 46 (2021), 102122. https://doi.org/10.1016/j.redox.2021.102122 doi: 10.1016/j.redox.2021.102122
|
| [6] |
P. Tsvetkov, S. Coy, B. Petrova, M. Dreishpoon, A. Verma, M. Abdusamad, et al., Copper induces cell death by targeting lipoylated TCA cycle proteins, Science, 375 (2022), 1254-1261. https://doi.org/10.1126/science.abf0529 doi: 10.1126/science.abf0529
|
| [7] |
V. Oliveri, Selective targeting of cancer cells by copper ionophores: An overview, Front. Mol. Biosci., 9 (2022), 841814. https://doi.org/10.3389/fmolb.2022.841814 doi: 10.3389/fmolb.2022.841814
|
| [8] | L. M. Zhang, H. Y. Ju, Y. T. Wu, W. Guo, L. Mao, H. L. Ma, et al., Long non-coding RNA ANRIL promotes tumorgenesis through regulation of FGFR1 expression by sponging miR-125a-3p in head and neck squamous cell carcinoma, Am. J. Cancer Res., 8 (2018), 2296-2310. |
| [9] |
G. P. Naudé, R. N. S. Foster, M. Bartley, M. P. Martinetti, L. O. Ayers, D. D. Reed, Predicting adverse consequences of alcohol consumption in underage college students using a novel fake ID purchase task, Exp. Clin. Psychopharmacol., 28 (2020), 669-676. https://doi.org/10.1037/pha0000345 doi: 10.1037/pha0000345
|
| [10] |
Z. Shen, Q. Li, H. Deng, D. Lu, H. Song, J. Guo, Long non-coding RNA profiling in laryngeal squamous cell carcinoma and its clinical significance: potential biomarkers for LSCC, PLoS One, 9 (2014), e108237. https://doi.org/10.1371/journal.pone.0108237 doi: 10.1371/journal.pone.0108237
|
| [11] |
H. Yuan, H. Jiang, Y. Wang, Y. Dong, Increased expression of lncRNA FTH1P3 predicts a poor prognosis and promotes aggressive phenotypes of laryngeal squamous cell carcinoma, Biosci. Rep., 39 (2019), 1-11. https://doi.org/10.1042/bsr20181644 doi: 10.1042/bsr20181644
|
| [12] |
X. Zheng, K. Zhao, T. Liu, L. Liu, C. Zhou, M. Xu, Long noncoding RNA PVT1 promotes laryngeal squamous cell carcinoma development by acting as a molecular sponge to regulate miR-519d-3p, J. Cell Biochem., 120 (2019), 3911-3921. https://doi.org/10.1002/jcb.27673 doi: 10.1002/jcb.27673
|
| [13] |
Q. Jiang, S. Liu, L. Hou, Y. Guan, S. Yang, Z. Luo, The implication of LncRNA MALAT1 in promoting chemo-resistance of laryngeal squamous cell carcinoma cells, J. Clin. Lab. Anal., 34 (2020), e23116. https://doi.org/10.1002/jcla.23116 doi: 10.1002/jcla.23116
|
| [14] | J. Chen, X. Chen, L. Fu, J. Chen, Y. Chen, F. Liu, LncRNA GACAT1 targeting miRNA-149 regulates the molecular mechanism of proliferation, apoptosis and autophagy of oral squamous cell carcinoma cells, Aging (Albany NY), 13 (2021), 20359-20371. https://doi.org/10.18632/aging.203416 |
| [15] |
X. Lu, L. Chen, Y. Li, R. Huang, X. Meng, F. Sun, Long non-coding RNA LINC01207 promotes cell proliferation and migration but suppresses apoptosis and autophagy in oral squamous cell carcinoma by the microRNA-1301-3p/lactate dehydrogenase isoform A axis, Bioengineered, 12 (2021), 7780-7793. https://doi.org/10.1080/21655979.2021.1972784 doi: 10.1080/21655979.2021.1972784
|
| [16] |
J. Wang, Y. Zhu, S. Ni, S. Liu, LncRNA GAS5 suppressed proliferation and promoted apoptosis in laryngeal squamous cell carcinoma by targeting MiR-26a-5p and modifying ULK2, Cancer Manage. Res., 13 (2021), 871-887. https://doi.org/10.2147/cmar.S250778 doi: 10.2147/cmar.S250778
|
| [17] |
Y. Tang, C. Li, Y. J. Zhang, Z. H. Wu, Ferroptosis-related long non-coding RNA signature predicts the prognosis of head and neck squamous cell carcinoma, Int. J. Biol. Sci., 17 (2021), 702-711. https://doi.org/10.7150/ijbs.55552 doi: 10.7150/ijbs.55552
|
| [18] |
A. Obradovic, D. Graves, M. Korrer, Y. Wang, S. Roy, A. Naveed, et al., Immunostimulatory cancer-associated fibroblast subpopulations can predict immunotherapy response in head and neck cancer, Clin. Cancer Res., 28 (2022), 2094-2109. https://doi.org/10.1158/1078-0432.Ccr-21-3570 doi: 10.1158/1078-0432.Ccr-21-3570
|
| [19] |
J. Dong, X. Wang, C. Xu, M. Gao, S. Wang, J. Zhang, et al., Inhibiting NLRP3 inflammasome activation prevents copper-induced neuropathology in a murine model of Wilson's disease, Cell Death Dis., 12 (2021), 87. https://doi.org/10.1038/s41419-021-03397-1 doi: 10.1038/s41419-021-03397-1
|
| [20] | A. Butler, P. Hoffman, P. Smibert, E. Papalexi, R. Satija, Integrating single-cell transcriptomic data across different conditions, technologies, and species, Nat. Biotechnol., 36 (2018), 411-420. https://doi.org/10.1038/nbt.4096 |
| [21] |
M. E. Ritchie, B. Phipson, D. Wu, Y. Hu, C. W. Law, W. Shi, et al., limma powers differential expression analyses for RNA-sequencing and microarray studies, Nucleic Acids Res., 43 (2015), e47. https://doi.org/10.1093/nar/gkv007 doi: 10.1093/nar/gkv007
|
| [22] |
G. Yu, L. G. Wang, Y. Han, Q. Y. He, ClusterProfiler: An R package for comparing biological themes among gene clusters, Omics, 16 (2012), 284-287. https://doi.org/10.1089/omi.2011.0118 doi: 10.1089/omi.2011.0118
|
| [23] |
S. Hänzelmann, R. Castelo, J. Guinney, GSVA: Gene set variation analysis for microarray and RNA-seq data, BMC Bioinf., 14 (2013), 7. https://doi.org/10.1186/1471-2105-14-7 doi: 10.1186/1471-2105-14-7
|
| [24] |
A. M. Newman, C. L. Liu, M. R. Green, A. J. Gentles, W. Feng, Y. Xu, et al., Robust enumeration of cell subsets from tissue expression profiles, Nat. Methods, 12 (2015), 453-457. https://doi.org/10.1038/nmeth.3337 doi: 10.1038/nmeth.3337
|
| [25] |
O. Kaidar-Person, Z. Gil, S. Billan, Precision medicine in head and neck cancer, Drug Resist. Updates, 40 (2018), 13-16. https://doi.org/10.1016/j.drup.2018.09.001 doi: 10.1016/j.drup.2018.09.001
|
| [26] |
A. Vyas, U. Duvvuri, K. Kiselyov, Copper-dependent ATP7B up-regulation drives the resistance of TMEM16A-overexpressing head-and-neck cancer models to platinum toxicity, Biochem. J., 476 (2019), 3705-3719. https://doi.org/10.1042/bcj20190591 doi: 10.1042/bcj20190591
|
| [27] |
Y. M. Park, Y. Y. Go, S. H. Shin, J. G. Cho, J. S. Woo, J. J. Song, Anti-cancer effects of disulfiram in head and neck squamous cell carcinoma via autophagic cell death, PLoS One, 13 (2018), e0203069. https://doi.org/10.1371/journal.pone.0203069 doi: 10.1371/journal.pone.0203069
|
| [28] |
S. Ryumon, T. Okui, Y. Kunisada, K. Kishimoto, T. Shimo, K. Hasegawa, et al., Ammonium tetrathiomolybdate enhances the antitumor effect of cisplatin via the suppression of ATPase copper transporting beta in head and neck squamous cell carcinoma, Oncol. Rep., 42 (2019), 2611-2621. https://doi.org/10.3892/or.2019.7367 doi: 10.3892/or.2019.7367
|
| [29] |
T. McFate, A. Mohyeldin, H. Lu, J. Thakar, J. Henriques, N. D. Halim, et al., Pyruvate dehydrogenase complex activity controls metabolic and malignant phenotype in cancer cells, J. Biol. Chem., 283 (2008), 22700-22708. https://doi.org/10.1074/jbc.M801765200 doi: 10.1074/jbc.M801765200
|
| [30] |
A. Bhan, M. Soleimani, S. S. Mandal, Long noncoding RNA and cancer: A new paradigm, Cancer Res., 77 (2017), 3965-3981. https://doi.org/10.1158/0008-5472.Can-16-2634 doi: 10.1158/0008-5472.Can-16-2634
|
| [31] | J. M. Babu, R. Prathibha, V. S. Jijith, R. Hariharan, M. R. Pillai, A miR-centric view of head and neck cancers, Biochim. Biophys. Acta, Rev. Cancer, 1816 (2011), 67-72. https://doi.org/10.1016/j.bbcan.2011.04.003 |
| [32] |
F. Citron, I. Segatto, L. Musco, I. Pellarin, G. L. R. Vinciguerra, G. Franchin, et al., miR-9 modulates and predicts the response to radiotherapy and EGFR inhibition in HNSCC, EMBO Mol. Med., 13 (2021), e12872. https://doi.org/10.15252/emmm.202012872 doi: 10.15252/emmm.202012872
|
| [33] |
Y. Hu, G. Guo, J. Li, J. Chen, P. Tan, Screening key lncRNAs with diagnostic and prognostic value for head and neck squamous cell carcinoma based on machine learning and mRNA-lncRNA co-expression network analysis, Cancer Biomarkers, 27 (2020), 195-206. https://doi.org/10.3233/cbm-190694 doi: 10.3233/cbm-190694
|
| [34] |
S. Lina, Identification of hub lncRNAs in head and neck cancer based on weighted gene co-expression network analysis and experiments, FEBS Open Bio, 11 (2021), 2060-2073. https://doi.org/10.1002/2211-5463.13134 doi: 10.1002/2211-5463.13134
|
| [35] |
Y. Z. Dai, Y. D. Liu, J. Li, M. T. Chen, M. Huang, F. Wang, et al., METTL16 promotes hepatocellular carcinoma progression through downregulating RAB11B-AS1 in an m(6)A-dependent manner, Cell Mol. Biol. Lett., 27 (2022), 41. https://doi.org/10.1186/s11658-022-00342-8 doi: 10.1186/s11658-022-00342-8
|
| [36] |
S. Miyauchi, S. S. Kim, J. Pang, K. A. Gold, J. S. Gutkind, J. A. Califano, et al., Immune modulation of head and neck squamous cell carcinoma and the tumor microenvironment by conventional therapeutics, Clin. Cancer Res., 25 (2019), 4211-4223. https://doi.org/10.1158/1078-0432.Ccr-18-0871 doi: 10.1158/1078-0432.Ccr-18-0871
|
| [37] |
S. V. Hato, A. Khong, I. J. de Vries, W. J. Lesterhuis, Molecular pathways: The immunogenic effects of platinum-based chemotherapeutics, Clin. Cancer Res., 20 (2014), 2831-2837. https://doi.org/10.1158/1078-0432.Ccr-13-3141 doi: 10.1158/1078-0432.Ccr-13-3141
|
| [38] |
K. Bardhan, T. Anagnostou, V. A. Boussiotis, The PD1:PD-L1/2 pathway from discovery to clinical implementation, Front. Immunol., 7 (2016), 550. https://doi.org/10.3389/fimmu.2016.00550 doi: 10.3389/fimmu.2016.00550
|
| [39] |
B. Burtness, K. J. Harrington, R. Greil, D. Soulières, M. Tahara, G. de Castro Jr, et al., Pembrolizumab alone or with chemotherapy versus cetuximab with chemotherapy for recurrent or metastatic squamous cell carcinoma of the head and neck (KEYNOTE-048): A randomised, open-label, phase 3 study, Lancet, 394 (2019), 1915-1928. https://doi.org/10.1016/s0140-6736(19)32591-7 doi: 10.1016/s0140-6736(19)32591-7
|
| [40] |
C. Nordfors, N. Grün, N. Tertipis, A. Ährlund-Richter, L. Haeggblom, L. Sivars, et al., CD8+ and CD4+ tumour infiltrating lymphocytes in relation to human papillomavirus status and clinical outcome in tonsillar and base of tongue squamous cell carcinoma, Eur. J. Cancer, 49 (2013), 2522-2530. https://doi.org/10.1016/j.ejca.2013.03.019 doi: 10.1016/j.ejca.2013.03.019
|
| [41] |
P. Balermpas, Y. Michel, J. Wagenblast, O. Seitz, C. Weiss, F. Rödel, et al., Tumour-infiltrating lymphocytes predict response to definitive chemoradiotherapy in head and neck cancer, Br. J. Cancer, 110 (2014), 501-509. https://doi.org/10.1038/bjc.2013.640 doi: 10.1038/bjc.2013.640
|
| [42] |
S. E. Matlung, P. M. W. van Kempen, N. Bovenschen, D. V. Baarle, S. M. Willems, Differences in T-cell infiltrates and survival between HPV+ and HPV- oropharyngeal squamous cell carcinoma, Future Sci. OA, 2 (2016), FSO88. https://doi.org/10.4155/fso.15.88 doi: 10.4155/fso.15.88
|
| [43] |
L. W. Pfannenstiel, C. M. Diaz-Montero, Y. F. Tian, J. Scharpf, J. S. Ko, B. R. Gastman, Immune-checkpoint blockade opposes CD8(+) T-cell suppression in human and murine cancer, Cancer Immunol. Res., 7 (2019), 510-525. https://doi.org/10.1158/2326-6066.Cir-18-0054 doi: 10.1158/2326-6066.Cir-18-0054
|
| [44] |
P. André, C. Denis, C. Soulas, C. Bourbon-Caillet, J. Lopez, T. Arnoux, et al., Anti-NKG2A mAb is a checkpoint inhibitor that promotes anti-tumor immunity by unleashing both T and NK cells, Cell, 175 (2018), 1731-1743. https://doi.org/10.1016/j.cell.2018.10.014 doi: 10.1016/j.cell.2018.10.014
|
| [45] |
Y. Zhang, M. Zhao, H. Gao, G. Yu, Y. Zhao, F. Yao, et al., MAPK signalling-induced phosphorylation and subcellular translocation of PDHE1α promotes tumour immune evasion, Nat. Metab., 4 (2022), 374-388. https://doi.org/10.1038/s42255-022-00543-7 doi: 10.1038/s42255-022-00543-7
|
 mbe-19-12-564-supplementary.pdf mbe-19-12-564-supplementary.pdf |
 |


Figures(8)

Changxiang Huan, Jiaxin Gao. A novel cuproptosis-related lncRNA prognostic signature for predicting treatment and immune environment of head and neck squamous cell carcinoma[J]. Mathematical Biosciences and Engineering, 2022, 19(12): 12127-12145. doi: 10.3934/mbe.2022564


 DownLoad: