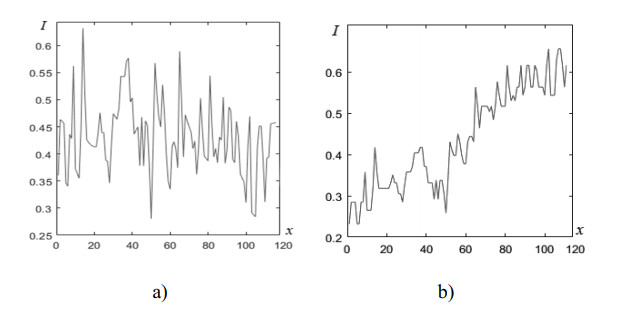
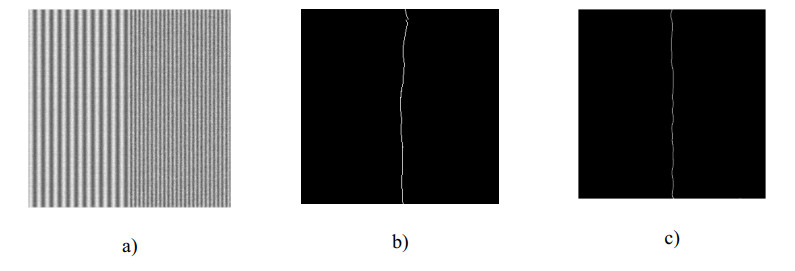
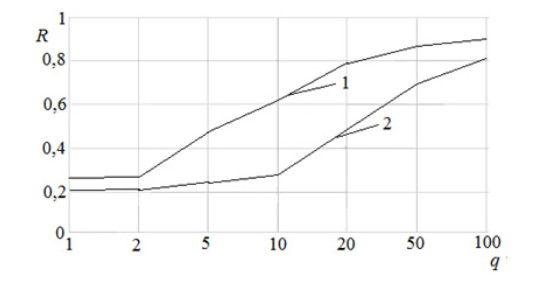
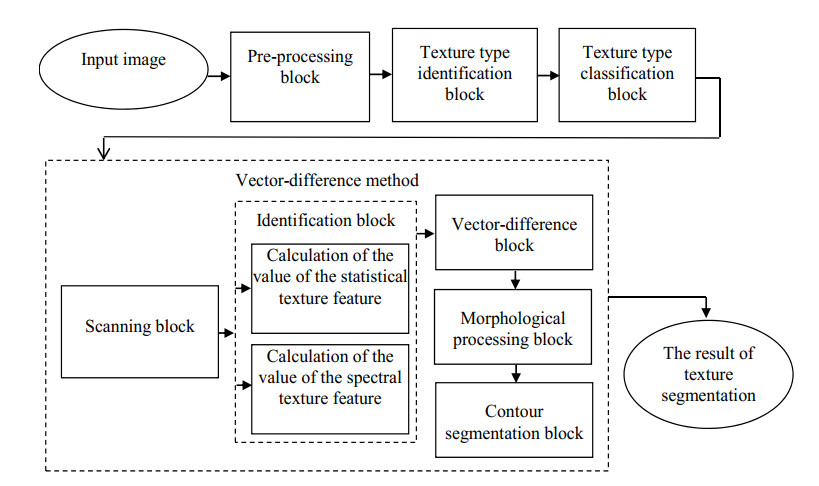
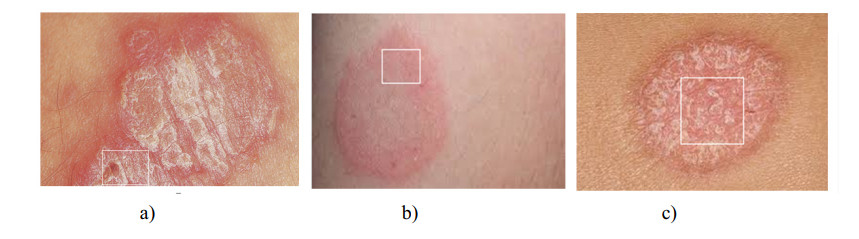
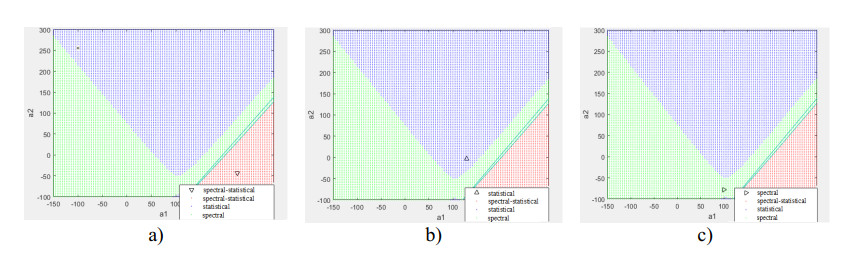
An important component of the computer systems of medical diagnostics in dermatology is the device for recognition of visual images (DRVI), which includes identification and segmentation procedures to build the image of the object for recognition. In this study, the peculiarities of the application of detection, classification and vector-difference approaches for the segmentation of textures of different types in images of dermatological diseases were considered. To increase the quality of segmented images in dermatologic diagnostic systems using a DRVI, an improved vector-difference method for spectral-statistical texture segmentation has been developed. The method is based on the estimation of the number of features and subsequent calculation of a specific texture feature, and it uses wavelets obtained by transforming the graph of the power function at the stage of contour segmentation. Based on the above, the authors developed a modulus for spectral-statistical texture segmentation, which they applied to segment images of psoriatic disease; the Pratt's criterion was used to assess the quality of segmentation. The reliability of the classification of the spectral-statistical texture images was confirmed by using the True Positive Rate (TPR) and False Positive Rate (FPR) metrics calculated on the basis of the confusion matrix. The results of the experimental research confirmed the advantage of the proposed vector-difference method for the segmentation of spectral-statistical textures. The method enables further supplementation of the vector of features at the stage of identification through the use of the most informative features based on characteristic points for different degrees and types of psoriatic disease.
Citation: Xinlin Liu, Viktor Krylov, Su Jun, Natalya Volkova, Anatoliy Sachenko, Galina Shcherbakova, Jacek Woloszyn. Segmentation and identification of spectral and statistical textures for computer medical diagnostics in dermatology[J]. Mathematical Biosciences and Engineering, 2022, 19(7): 6923-6939. doi: 10.3934/mbe.2022326
An important component of the computer systems of medical diagnostics in dermatology is the device for recognition of visual images (DRVI), which includes identification and segmentation procedures to build the image of the object for recognition. In this study, the peculiarities of the application of detection, classification and vector-difference approaches for the segmentation of textures of different types in images of dermatological diseases were considered. To increase the quality of segmented images in dermatologic diagnostic systems using a DRVI, an improved vector-difference method for spectral-statistical texture segmentation has been developed. The method is based on the estimation of the number of features and subsequent calculation of a specific texture feature, and it uses wavelets obtained by transforming the graph of the power function at the stage of contour segmentation. Based on the above, the authors developed a modulus for spectral-statistical texture segmentation, which they applied to segment images of psoriatic disease; the Pratt's criterion was used to assess the quality of segmentation. The reliability of the classification of the spectral-statistical texture images was confirmed by using the True Positive Rate (TPR) and False Positive Rate (FPR) metrics calculated on the basis of the confusion matrix. The results of the experimental research confirmed the advantage of the proposed vector-difference method for the segmentation of spectral-statistical textures. The method enables further supplementation of the vector of features at the stage of identification through the use of the most informative features based on characteristic points for different degrees and types of psoriatic disease.

| [1] |
Y. Yemchenko, K. Ischeikin, Features of the clinical course of psoriasis in patients with obesity, Med. Ecol. Probl., 24 (2020), 3-7. https://doi.org/10.31718/mep.2020.24.1-2.01 doi: 10.31718/mep.2020.24.1-2.01

|
| [2] |
K. G. Paulson, D. Gupta, T. S. Kim, J. R. Veatch, D. R. Byrd, S. Bhatia, et al., Age-specific incidence of melanoma in the United States, JAMA Dermatol., 156 (2020), 57-64. https://doi.org/10.1001/jamadermatol.2019.3353. doi: 10.1001/jamadermatol.2019.3353
|
| [3] |
M. J. Schaap, N. J. Cardozo, A. Patel, E. M. G. J. de Jong, B. van Ginneken, M. M. B. Seyger, Image-based automated psoriasis area severity index scoring by convolutional neural networks, J. Eur. Acad. Dermatol. Venereol., 36 (2022), 68-75. https://doi.org/10.1111/jdv.17711 doi: 10.1111/jdv.17711
|
| [4] |
S. Gerdes, A. Krber, M. Biermann, C. Karnthaler, M. Reinhardt, Absolute and relative psoriasis area and severity index (PASI) treatment goals and their association with health-related quality of life, J. Dermatol. Treat., 31 (2020), 470-475. https://doi.org/10.1080/09546634.2020.1746734 doi: 10.1080/09546634.2020.1746734
|
| [5] | A. U. R. Butt, W. Ahmad, R. Ashraf, M. Asif, S. A Cheema, Computer aided diagnosis (CAD) for segmentation and classification of burnt human skin, in Proceedings of the 2019 International Conference on Electrical, Communication, and Computer Engineering (ICECCE), (2019), 1-5. https://doi.org/10.1109/ICECCE47252.2019.8940758. |
| [6] |
J. Glaister, A. Wong, Segmentation of skin lesions from digital images using joint statistical texture distinctiveness, IEEE Trans. Biomed. Eng., 61 (2014), 1220-1230. https://doi.org/10.1109/TBME.2013.2297622 doi: 10.1109/TBME.2013.2297622
|
| [7] | F. S. Saleh, R. Azmi, Automatic multiple regions segmentation of dermoscopy images, in Proceedings of the 2015 The International Symposium on Artificial Intelligence and Signal Processing (AISP), (2015), 24-29. https://doi.org/10.1109/AISP.2015.7123482 |
| [8] | Y. Li, Z. Wu, S. Zhao, X. Wu, Y. Kuang, Y. Yan, et al., PSENet: Psoriasis severity evaluation network, in Proceedings of the The Thirty-Fourth AAAI Conference on Artificial Intelligence (AAAI-20), (2020), 800-807. https://doi.org/10.1609/aaai.v34i01.5424 |
| [9] |
E. F. López, Á. M. García, L. S. D. Blanco, J. F. Marinero, J. P. Turiel, Automatic gauze tracking in laparoscopic surgery using image texture analysis, Comput. Methods Programs Biomed., 190 (2020), 1-11. https://doi.org/10.1016/j.cmpb.2020.105378 doi: 10.1016/j.cmpb.2020.105378
|
| [10] |
S. Wen, T. M. Kurc, Y. Gao, T. Zhao, J. H. Saltz, W. Zhu, Quality assessment in nucleus segmentation of histopathology image, J. Pathol. Inf., 8 (2017), 1-12. https://doi.org/10.4103/jpi.jpi_43_17 doi: 10.4103/jpi.jpi_43_17
|
| [11] |
M. A. Kassem, K. M. Hosny, R. Damaševičius, M. M. Eltoukhy, Machine learning and deep learning methods for skin lesion classification and diagnosis: A systematic review, Diagnostics, 11 (2021), 1390. https://doi.org/10.3390/diagnostics11081390 doi: 10.3390/diagnostics11081390
|
| [12] |
L. Rundo, A. Tangherloni, P. Cazzaniga, M. Mistri, S. Galimberti, R. Woitek, et al., A CUDA-powered method for the feature extraction and unsupervised analysis of medical images, J. Supercomput., 77 (2021), 8514-8531. https://doi.org/10.1007/S11227-020-03565-8 doi: 10.1007/S11227-020-03565-8
|
| [13] |
V. K. Shrivastava, N. D. Londhe, R. S. Sonawane, J. S. Suri, Computer-aided diagnosis of psoriasis skin images with HOS, texture and color features: A first comparative study of its kind, Comput. Methods Programs Biomed., 126 (2016), 98-109. https://doi.org/10.1016/j.cmpb.2015.11.013 doi: 10.1016/j.cmpb.2015.11.013
|
| [14] |
M. Hazgui, H. Ghazouani, W. Barhoumi, Genetic programming-based fusion of HOG and LBP features for fully automated texture classification, Vis. Comput., 38 (2022), 457–476. https://doi.org/10.1007/s00371-020-02028-8. doi: 10.1007/s00371-020-02028-8
|
| [15] | S. A. Almola, Find edge map for medical images based on texture characteristics, in Proceedings of the 2021 International Conference on Communication & Information Technology (ICICT), (2021), 7-12. https://doi.org/10.1109/ICICT52195.2021.9568424 |
| [16] |
N. Sharma, A. K. Ray, S. Sharma, K. K. Shukla, S. Pradhan, L. M. Aggarwal, Segmentation and classification of medical images using texture-primitive features: Application of BAM-type artificial neural network, J. Med. Phys., 33 (2008), 119–126. https://doi.org/10.4103/0971-6203.42763 doi: 10.4103/0971-6203.42763
|
| [17] |
T. S. Jarad, A. J. Dawood, Computer-aided diagnosis psoriasis lesion using skin color and texture features, Int. J. Comput. Digital Syst., 7 (2018), 145-154. https://doi.org/10.12785/IJCDS/070303 doi: 10.12785/IJCDS/070303
|
| [18] |
M. R. Mookiah, J. H. Tan, C. K. Chua, E. Y. Ng, A. Laude, L. Tong, Automated characterization and detection of diabetic retinopathy using texture measures, J. Mechan. Med. Biol., 15 (2015), 1550045. https://doi.org/10.1142/S0219519415500451 doi: 10.1142/S0219519415500451
|
| [19] | D. Gornea, D. Popescu, L. Ichim, Remote assessment of flooded areas based on inter-spectral statistical features, in Proceedings of the 2016 39th International Conference on Telecommunications and Signal Processing (TSP), (2016), 707-710. https://doi.org/10.1109/TSP.2016.7760976 |
| [20] | D. N. Anh, Detection of lesion region in skin images by moment of patch, in Proceedings of the 2016 IEEE RIVF International Conference on Computing & Communication Technologies, Research, Innovation, and Vision for the Future (RIVF), (2016), 217-222. https://doi.org/10.1109/RIVF.2016.7800297 |
| [21] |
V. N. Krylov, N. P. Volkova, Vector-difference texture segmentation method in technical and medical express diagnostic systems, Herald Adv. Inf. Technol., 3 (2020), 174-186. https://doi.org/10.15276/hait.04.2020.2 doi: 10.15276/hait.04.2020.2
|
| [22] |
L. A. Soares, K. F. Côco, P. M. Ciarelli, E. O. T. Salles, A class-independent texture-separation method based on a pixel-wise binary classification, Sensors, 20 (2020), 5432. https://doi.org/10.3390/s20185432 doi: 10.3390/s20185432
|
| [23] | T. Lacombe, H. Favrelière, M. Pillet, Modal features for image texture classification, preprint, arXiv: 2005.01928. https://doi.org/10.1016/j.patrec.2020.04.036 |
| [24] |
D. Zahorodnia, Y. Pigovsky, P. Bykovyy, Canny-based method of image contour segmentation, Int. J. Comput., 15 (2016), 200-205. https://doi.org/10.47839/ijc.15.3.853 doi: 10.47839/ijc.15.3.853
|
| [25] |
A. Zollanvari, B. Abibullaev, Bias correction for linear discriminant analysis, Pattern Recognit. Lett., 151 (2021), 41-47. https://doi.org/10.1016/J.PATREC.2021.07.026 doi: 10.1016/J.PATREC.2021.07.026
|
| [26] |
N. P. Volkova, V. N. Krylov, Hybrid texture identification method, Herald Adv. Inf. Technol., 4 (2021), 123-134. https://doi.org/10.15276/hait.02.2021.2 doi: 10.15276/hait.02.2021.2
|
| [27] | E. Li, Y. Huang, D. Xu, H. Li, Shape DNA: Basic generating functions for geometric moment invariants, preprint, arXiv: 1703.02242. https://arXiv.org/pdf/1703.02242.pdf |
| [28] |
H. Nasser, P. Ngo, I. Debled-Rennesson, Dominant point detection based on discrete curve structure and applications, J. Comput. Syst. Sci., 95 (2018), 177-192. https://doi.org/10.1016/j.jcss.2017.07.007 doi: 10.1016/j.jcss.2017.07.007
|
| [29] | R. Sjamaar, Lebesgue integration, All Math You Missed, (2021), 255-265. https://doi.org/10.1017/9781108992879.016 |
| [30] | G. Shcherbakova, S. Antoshchuk, A. Sachenko, M. Gerganov, M. Polyakova, V. Krylov, Areal multistart method of optimization for image recognition, in Proceedings of the IEEE Second International Conference on Data Stream Mining & Processing, (2018), 605-608. https://doi.org/10.1109/DSMP.2018.8478551 |
| [31] | G. Shcherbakova, V. Krylov, B. Rusyn, A. Sachenko, P. Bykovyy, D. Zahorodnia, et al., Optimization methods on the wavelet transformation base for technical diagnostic information systems, in Proceedings of the 11th IEEE International Conference on Intelligent Data Acquisition and Advanced Computing Systems: Technology and Applications (IDAACS'2021), (2021), 767-773. https://doi.org/10.1109/IDAACS53288.2021.9660927 |
| [32] |
H. Zhengbing, I. Tereikovskyi, D. Chernyshev, L. Tereikovska, O. Tereikovskyi, W. Dong, Procedure for processing biometric parameters based on wavelet transformations, Int. J. Mod. Educ. Comput. Sci, 13 (2021), 11-22. https://doi.org/10.5815/ijmecs.2021.02.02 doi: 10.5815/ijmecs.2021.02.02
|
| [33] | I. Paliy, A. Sachenko, V. Koval, Y. Kurylyak, Approach to face recognition using neural networks, in Proceedings of the IEEE International Conference on Intelligent Data Acquisition and Advanced Computing Systems: Technology and Applications (IDAACS'2005), (2005), 112-115. doi: 10.1109/IDAACS.2005.282951 |
Figures(6) / Tables(3)

Xinlin Liu, Viktor Krylov, Su Jun, Natalya Volkova, Anatoliy Sachenko, Galina Shcherbakova, Jacek Woloszyn. Segmentation and identification of spectral and statistical textures for computer medical diagnostics in dermatology[J]. Mathematical Biosciences and Engineering, 2022, 19(7): 6923-6939. doi: 10.3934/mbe.2022326


 DownLoad: