Single-stranded DNA-binding protein 1 (SSBP1) plays an important role in DNA repair processes and the maintenance of genomic stability. The aim of this study was to evaluate the expression of SSBP1 and its prognostic value in lung adenocarcinoma (LUAD) using bioinformatics approaches.
We applied databases including UALCAN, Kaplan-Meier plotter, LinkedOmics, Webgestalt, cBioPortal and TIMER2.0 in this study.
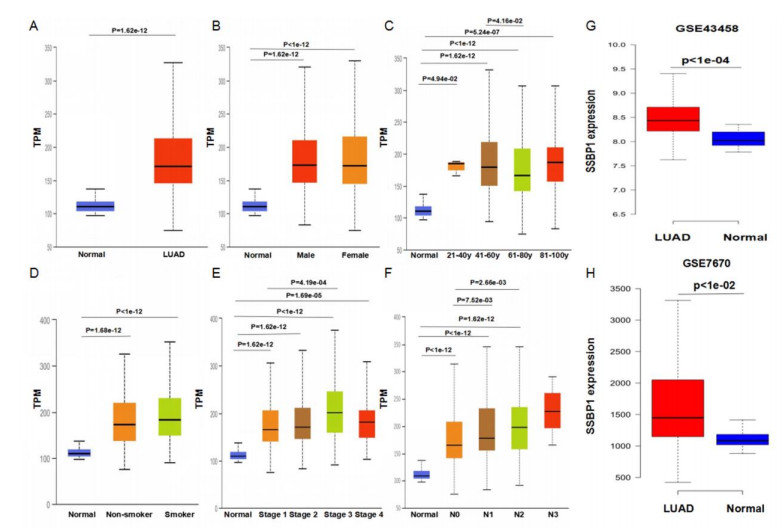
We found that SSBP1 expression was up-regulated in LUAD samples and was correlated with clinicopathological features including age, cancer stage, and nodal metastasis status by the UALCAN analysis. Multivariate Cox regression analysis by the Kaplan-Meier plotter showed that high SSBP1 expression was independently correlated with poor overall survival (hazard ratio = 1.63, 95% confidence interval: 1.08−2.46, logrank P = 0.02). The LinkedOmics analysis showed that 5078 genes were positively correlated with SSBP1 expression, whereas 7905 genes were negatively correlated with SSBP1 in LUAD. Functional enrichment analysis using the Webgestalt tool showed that for SSBP1 and the genes positively correlating with it, the significantly enriched biological process was ribosomal large subunit biogenesis, and the significantly enriched pathway was proteasome. According to the cBioPortal database, the frequency of SSBP1 alterations was 1.7% in LUAD patients, and patients with SSBP1 alterations had worse prognosis (logrank P = 4.26e-05) compared with those unaltered for SSBP1. Finally, SSBP1 expression was negatively correlated with B cell infiltration level (Rho = −0.193, P = 1.54e-05) and the expression of B cell biomarkers including CD79A and CD19.
Our results suggest that SSBP1 may be a prognostic marker for human LUAD.
Citation: Jian Huang, Zheng-Fu Xie. Identification of SSBP1 as a prognostic marker in human lung adenocarcinoma using bioinformatics approaches[J]. Mathematical Biosciences and Engineering, 2022, 19(3): 3022-3035. doi: 10.3934/mbe.2022139
Single-stranded DNA-binding protein 1 (SSBP1) plays an important role in DNA repair processes and the maintenance of genomic stability. The aim of this study was to evaluate the expression of SSBP1 and its prognostic value in lung adenocarcinoma (LUAD) using bioinformatics approaches.
We applied databases including UALCAN, Kaplan-Meier plotter, LinkedOmics, Webgestalt, cBioPortal and TIMER2.0 in this study.
We found that SSBP1 expression was up-regulated in LUAD samples and was correlated with clinicopathological features including age, cancer stage, and nodal metastasis status by the UALCAN analysis. Multivariate Cox regression analysis by the Kaplan-Meier plotter showed that high SSBP1 expression was independently correlated with poor overall survival (hazard ratio = 1.63, 95% confidence interval: 1.08−2.46, logrank P = 0.02). The LinkedOmics analysis showed that 5078 genes were positively correlated with SSBP1 expression, whereas 7905 genes were negatively correlated with SSBP1 in LUAD. Functional enrichment analysis using the Webgestalt tool showed that for SSBP1 and the genes positively correlating with it, the significantly enriched biological process was ribosomal large subunit biogenesis, and the significantly enriched pathway was proteasome. According to the cBioPortal database, the frequency of SSBP1 alterations was 1.7% in LUAD patients, and patients with SSBP1 alterations had worse prognosis (logrank P = 4.26e-05) compared with those unaltered for SSBP1. Finally, SSBP1 expression was negatively correlated with B cell infiltration level (Rho = −0.193, P = 1.54e-05) and the expression of B cell biomarkers including CD79A and CD19.
Our results suggest that SSBP1 may be a prognostic marker for human LUAD.

| [1] |
K. C. Thandra, A. Barsouk, K. Saginala, J. S. Aluru, A. Barsouk, Epidemiology of lung cancer, Contemp. Oncol., 25 (2021), 45−52. https://doi.org/10.5114/wo.2021.103829 doi: 10.5114/wo.2021.103829

|
| [2] |
Y. Li, E. Bolderson, R. Kumar, P. A. Muniandy, Y. Xue, D. J. Richard, et al., HSSB1 and hSSB2 form similar multiprotein complexes that participate in DNA damage response, J. Biol. Chem., 284 (2009), 23525−23531. https://doi.org/10.1074/jbc.C109.039586 doi: 10.1074/jbc.C109.039586
|
| [3] |
D. J. Richard, K. Savage, E. Bolderson, L. Cubeddu, S. So, M. Ghita, et al., hSSB1 rapidly binds at the sites of DNA double-strand breaks and is required for the efficient recruitment of the MRN complex, Nucleic. Acids. Res., 39 (2011), 1692−1702. https://doi.org/10.1093/nar/gkq1098 doi: 10.1093/nar/gkq1098
|
| [4] |
D. J. Richard, E. Bolderson, L. Cubeddu, R. I. Wadsworth, K. Savage, G. G. Sharma, et al., Single-stranded DNA-binding protein hSSB1 is critical for genomic stability, Nature, 453 (2008), 677−681. https://doi.org/10.1038/nature06883 doi: 10.1038/nature06883
|
| [5] |
P. Gu, W. Deng, M. Lei, S. Chang, Single strand DNA binding proteins 1 and 2 protect newly replicated telomeres, Cell Res., 23 (2013), 705−719. https://doi.org/10.1038/cr.2013.31 doi: 10.1038/cr.2013.31
|
| [6] |
Y. S. Kim, J. D. Hwan, S. Bae, D. H. Bae, W. A. Shick, Identification of differentially expressed genes using an annealing control primer system in stage Ⅲ serous ovarian carcinoma, BMC. Cancer., 10 (2010), 576. https://doi.org/10.1186/1471-2407-10-576 doi: 10.1186/1471-2407-10-576
|
| [7] |
Y. Ye, A. Huang, C. Huang, J. Liu, B. Wang, K. Lin, et al., Comparative mitochondrial proteomic analysis of hepatocellular carcinoma from patients, Proteomics Clin. Appl., 7 (2013), 403−415. doi: 10.1002/prca.201100103 doi: 10.1002/prca.201100103
|
| [8] |
Y. Yang, C. Pan, L. Yu, H. Ruan, L. Chang, J. Yang, et al., SSBP1 Upregulation in colorectal cancer regulates mitochondrial mass, Cancer Manag. Res., 11 (2019), 10093−10106. https://doi.org/10.2147/CMAR.S211292 doi: 10.2147/CMAR.S211292
|
| [9] |
D. S. Chandrashekar, B. Bashel, S. A. H. Balasubramanya, C. J. Creighton, I. Ponce-Rodriguez, B. V. S. K. Chakravarthi, et al., UALCAN: A portal for facilitating tumor subgroup gene expression and survival analyses, Neoplasia, 19 (2017), 649−658. https://doi.org/10.1016/j.neo.2017.05.002 doi: 10.1016/j.neo.2017.05.002
|
| [10] |
C. H. Chen, J. M. Lai, T. Y. Chou, C. Y. Chen, L. J. Su, Y. C. Lee, et al., VEGFA upregulates FLJ10540 and modulates migration and invasion of lung cancer via PI3K/AKT pathway, PLoS One, 4 (2009), e5052. https://doi.org/10.1371/journal.pone.0005052 doi: 10.1371/journal.pone.0005052
|
| [11] |
M. Kabbout, M. M. Garcia, J. Fujimoto, D. D. Liu, D. Woods, C. W. Chow, et al., ETS2 mediated tumor suppressive function and MET oncogene inhibition in human non-small cell lung cancer, Clin. Cancer Res., 19 (2013), 3383−3395. https://doi.org/10.1158/1078-0432.CCR-13-0341 doi: 10.1158/1078-0432.CCR-13-0341
|
| [12] |
B. Györffy, A. Lanczky, A. C. Eklund, C. Denkert, J. Budczies, Q. Li, et al., An online survival analysis tool to rapidly assess the effect of 22,277 genes on breast cancer prognosis using microarray data of 1,809 patients, Breast. Cancer Res. Treat., 123 (2010), 725−731. https://doi.org/10.1007/s10549-009-0674-9 doi: 10.1007/s10549-009-0674-9
|
| [13] |
S. V. Vasaikar, P. Straub, J. Wang, B. Zhang, LinkedOmics: analyzing multi-omics data within and across 32 cancer types, Nucleic Acids Res., 46 (2018), D956−D963. https://doi.org/10.1093/nar/gkx1090 doi: 10.1093/nar/gkx1090
|
| [14] |
Y. Liao, J. Wang, E. J. Jaehnig, Z. Shi, B. Zhang, WebGestalt 2019: gene set analysis toolkit with revamped UIs and APIs, Nucleic Acids Res., 47 (2019), W199−W205. https://doi.org/10.1093/nar/gkz401 doi: 10.1093/nar/gkz401
|
| [15] |
L. Chang, G. Zhou, O. Soufan, J. Xia, miRNet 2.0: network-based visual analytics for miRNA functional analysis and systems biology, Nucleic Acids Res., 48 (2020), W244−W251. https://doi.org/10.1093/nar/gkaa467 doi: 10.1093/nar/gkaa467
|
| [16] |
T. Li, J. Fan, B. Wang, N. Traugh, Q. Chen, J. S. Liu, et al., TIMER: A web server for comprehensive analysis of tumor-infiltrating immune cells, Cancer Res., 77 (2017), e108−e110. https://doi.org/10.1158/0008-5472.CAN-17-0307 doi: 10.1158/0008-5472.CAN-17-0307
|
| [17] |
Z. W. Chen, B. Liu, N. W. Tang, Y. H. Xu, X. Y. Ye, Z. M. Li, et al., FBXL5-mediated degradation of single-stranded DNA-binding protein hSSB1 controls DNA damage response, Nucleic Acids Res., 42 (2014), 11560−11569. https://doi.org/10.1093/nar/gku876 doi: 10.1093/nar/gku876
|
| [18] |
Y. Wang, L. Hu, X. Zhang, H. Zhao, H. Xu, Y. Wei, et al., Downregulation of mitochondrial single stranded DNA binding protein (SSBP1) induces mitochondrial dysfunction and increases the radiosensitivity in non-small cell lung cancer cells, J. Cancer, 8 (2017), 1400−1409. https://doi.org/10.7150/jca.18170.eCollection2017 doi: 10.7150/jca.18170.eCollection2017
|
| [19] |
E. Koedoot, M. Fokkelman, V. M. Rogkoti, M. Smid, I. van de Sandt, H. de Bont, et al., Uncovering the signaling landscape controlling breast cancer cell migration identifies novel metastasis driver genes, Nat. Commun., 10 (2019), 2983. https://doi.org/10.1038/s41467-019-11020-3 doi: 10.1038/s41467-019-11020-3
|
| [20] |
W. Xu, H. Huang, L. Yu, L. Cao, Meta-analysis of gene expression profiles indicates genes in spliceosome pathway are up-regulated in hepatocellular carcinoma (HCC), Med. Oncol., 32 (2015), 96. https://doi.org/10.1007/s12032-014-0425-6 doi: 10.1007/s12032-014-0425-6
|
| [21] |
T. Y. Hsu, L. M. Simon, N. J. Neill, R. Marcotte, A. Sayad, C. S. Bland, et al., The spliceosome is a therapeutic vulnerability in MYC-driven cancer, Nature., 525 (2015), 384−388. https://doi.org/10.1038/nature14985 doi: 10.1038/nature14985
|
| [22] |
T. Saiki, T. Kawai, K. Morita, M. Ohta, T. Saito, K. Rokutan, et al., Identification of marker genes for differential diagnosis of chronic fatigue syndrome, Mol. Med., 14 (2008), 599−607. https://doi.org/10.2119/2007-00059.Saiki doi: 10.2119/2007-00059.Saiki
|
| [23] |
J. He, H. C. Ford, J. Carroll, C. Douglas, E. Gonzales, S. Ding, et al., Assembly of the membrane domain of ATP synthase in human mitochondria, Proc. Natl. Acad. Sci., 115 (2018), 2988−2993. https://doi.org/10.1073/pnas.1722086115 doi: 10.1073/pnas.1722086115
|
| [24] |
C. Galber, G. Minervini, G. Cannino, F. Boldrin, V. Petronilli, S. Tosatto, et al., The f subunit of human ATP synthase is essential for normal mitochondrial morphology and permeability transition, Cell. Rep., 35 (2021), 109111. https://doi.org/10.1016/j.celrep.2021.109111 doi: 10.1016/j.celrep.2021.109111
|
| [25] |
S. Tamilzhalagan, M. Muthuswami, J. Periasamy, M. H. Lee, S. Y. Rha, P. Tan, et al., Upregulated, 7q21-22 amplicon candidate gene SHFM1 confers oncogenic advantage by suppressing p53 function in gastric cancer, Cell. Signal., 27 (2015), 1075−1086. https://doi.org/10.1016/j.cellsig.2015.02.010 doi: 10.1016/j.cellsig.2015.02.010
|
| [26] |
K. L. Pokrzywinski, T. G. Biel, D. Kryndushkin, V.A. Rao, Therapeutic targeting of the mitochondria initiates excessive superoxide production and mitochondrial depolarization causing decreased mtDNA integrity, PLoS. One., 11 (2016), e0168283. https://doi.org/10.1371/journal.pone.0168283 doi: 10.1371/journal.pone.0168283
|
| [27] |
A. Tartarone, V. Lapadula, C. Di Micco, G. Rossi, C. Ottanelli, A. Marini, et al., Beyond conventional: The new horizon of targeted therapy for the treatment of advanced non small cell lung cancer, Front. Oncol., 11 (2021), 632256. https://doi.org/10.3389/fonc.2021.632256 doi: 10.3389/fonc.2021.632256
|
| [28] |
Z. Tan, H. Xue, Y. Sun, C. Zhang, Y. Song, Y. Qi, The role of tumor inflammatory microenvironment in lung cancer, Front. Pharmacol., 12 (2021), 688625. https://doi.org/10.3389/fphar.2021.688625 doi: 10.3389/fphar.2021.688625
|
| [29] |
A. M. van der Leun, D. S. Thommen, T. N. Schumacher, CD8+ T cell states in human cancer: insights from single-cell analysis, Nat. Rev. Cancer, 20 (2020), 218−232. https://doi.org/10.1038/s41568-019-0235-4 doi: 10.1038/s41568-019-0235-4
|
| [30] |
J. Mei, Z. Xiao, C. Guo, Q. Pu, L. Ma, C. Liu, et al., Prognostic impact of tumor-associated macrophage infiltration in non-small cell lung cancer: A systemic review and meta-analysis, Oncotarget., 7 (2016), 34217−34228. https://doi.org/10.18632/oncotarget.9079 doi: 10.18632/oncotarget.9079
|
| [31] |
S. S. Wang, W. Liu, D. Ly, H. Xu, L. Qu, L. Zhang, Tumor-infiltrating B cells: Their role and application in anti-tumor immunity in lung cancer, Cell. Mol. Immunol., 16 (2019), 6−18. https://doi.org/10.1038/s41423-018-0027-x doi: 10.1038/s41423-018-0027-x
|
 mbe-19-03-139-Supplementary.doc mbe-19-03-139-Supplementary.doc |
 |


Figures(7)

Jian Huang, Zheng-Fu Xie. Identification of SSBP1 as a prognostic marker in human lung adenocarcinoma using bioinformatics approaches[J]. Mathematical Biosciences and Engineering, 2022, 19(3): 3022-3035. doi: 10.3934/mbe.2022139


 DownLoad: