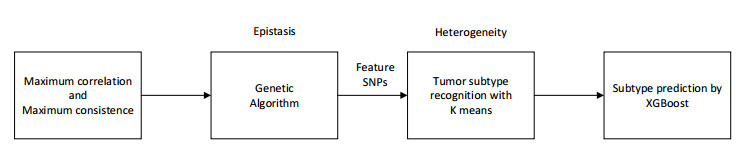
Tumor heterogeneity significantly increases the difficulty of tumor treatment. The same drugs and treatment methods have different effects on different tumor subtypes. Therefore, tumor heterogeneity is one of the main sources of poor prognosis, recurrence and metastasis. At present, there have been some computational methods to study tumor heterogeneity from the level of genome, transcriptome, and histology, but these methods still have certain limitations. In this study, we proposed an epistasis and heterogeneity analysis method based on genomic single nucleotide polymorphism (SNP) data. First of all, a maximum correlation and maximum consistence criteria was designed based on Bayesian network score K2 and information entropy for evaluating genomic epistasis. As the number of SNPs increases, the epistasis combination space increases sharply, resulting in a combination explosion phenomenon. Therefore, we next use an improved genetic algorithm to search the SNP epistatic combination space for identifying potential feasible epistasis solutions. Multiple epistasis solutions represent different pathogenic gene combinations, which may lead to different tumor subtypes, that is, heterogeneity. Finally, the XGBoost classifier is trained with feature SNPs selected that constitute multiple sets of epistatic solutions to verify that considering tumor heterogeneity is beneficial to improve the accuracy of tumor subtype prediction. In order to demonstrate the effectiveness of our method, the power of multiple epistatic recognition and the accuracy of tumor subtype classification measures are evaluated. Extensive simulation results show that our method has better power and prediction accuracy than previous methods.
Citation: Xia Chen, Yexiong Lin, Qiang Qu, Bin Ning, Haowen Chen, Xiong Li. An epistasis and heterogeneity analysis method based on maximum correlation and maximum consistence criteria[J]. Mathematical Biosciences and Engineering, 2021, 18(6): 7711-7726. doi: 10.3934/mbe.2021382
Tumor heterogeneity significantly increases the difficulty of tumor treatment. The same drugs and treatment methods have different effects on different tumor subtypes. Therefore, tumor heterogeneity is one of the main sources of poor prognosis, recurrence and metastasis. At present, there have been some computational methods to study tumor heterogeneity from the level of genome, transcriptome, and histology, but these methods still have certain limitations. In this study, we proposed an epistasis and heterogeneity analysis method based on genomic single nucleotide polymorphism (SNP) data. First of all, a maximum correlation and maximum consistence criteria was designed based on Bayesian network score K2 and information entropy for evaluating genomic epistasis. As the number of SNPs increases, the epistasis combination space increases sharply, resulting in a combination explosion phenomenon. Therefore, we next use an improved genetic algorithm to search the SNP epistatic combination space for identifying potential feasible epistasis solutions. Multiple epistasis solutions represent different pathogenic gene combinations, which may lead to different tumor subtypes, that is, heterogeneity. Finally, the XGBoost classifier is trained with feature SNPs selected that constitute multiple sets of epistatic solutions to verify that considering tumor heterogeneity is beneficial to improve the accuracy of tumor subtype prediction. In order to demonstrate the effectiveness of our method, the power of multiple epistatic recognition and the accuracy of tumor subtype classification measures are evaluated. Extensive simulation results show that our method has better power and prediction accuracy than previous methods.

| [1] |
E. A. Ashley, Towards precision medicine, Nat. Rev. Genet., 17 (2016), 507. doi: 10.1038/nrg.2016.86

|
| [2] |
H. Peng, X. Zeng, Y. Zhou, D. Zhang, R. Nussinov, F. Cheng, A component overlapping attribute clustering (COAC) algorithm for single-cell RNA sequencing data analysis and potential pathobiological implications, PLoS Comput. Biol., 15 (2019), e1006772. doi: 10.1371/journal.pcbi.1006772
|
| [3] |
X. Liu, Z. Hong, J. Liu, Y. Lin, R. Alfonso, Q. Zou, et al, Computational methods for identifying the critical nodes in biological networks, Briefings Bioinf., 21 (2020), 486-497. doi: 10.1093/bib/bbz011
|
| [4] |
A. Alizadeh, V. Aranda, A. Bardelli, C. Blanpain, C. Bock, C. Borowski, et al., Toward understanding and exploiting tumor heterogeneity, Nat. Med., 21 (2015), 846-853 doi: 10.1038/nm.3915
|
| [5] |
Q. Jia, W. Wu, Y. Wang, P. B. Alexander, C. Sun, Z. Gong, et al, Local mutational diversity drives intratumoral immune heterogeneity in non-small cell lung cancer, Nat. Commun., 9 (2018), 1-10. doi: 10.1038/s41467-017-02088-w
|
| [6] |
Y. Gu, Y. Gao, X. Tang, H. Xian, K. Shi, Bioinformatics analysis identifies CPZ as a tumor immunology biomarker for gastric cancer, Curr. Bioinf., 16 (2021), 98-105. doi: 10.2174/1574893615999200707145643
|
| [7] | W. Ran, X. Chen, B. Wang, Y. Ping, X. Xiao, Whole-exome sequencing of tumor-only samples reveals the association between somatic alterations and clinical features in pancreatic cancer, Curr. Bioinf., 15 (2020), 1160-1167. |
| [8] | Z. Lv, F. Cui, Q. Zou, L. Zhang, L. Xu, Anticancer peptides prediction with deep representation learning features, Briefings Bioinf., (2021), bbab008. |
| [9] |
A. C. Iliopoulos, G. Beis, P. Apostolou, I. Papasotiriou, Complex networks, gene expression and cancer complexity: a brief review of methodology and applications, Curr. Bioinf., 15 (2020), 629-655. doi: 10.2174/1574893614666191017093504
|
| [10] |
A. Ghosh, H. Yan, Stability analysis at key positions of EGFR related to non-small cell lung cancer, Curr. Bioinf., 15 (2020), 260-267. doi: 10.2174/1574893614666191212112026
|
| [11] |
Z. Ramzan, M. A. Hassan, H. M. S. Asif, A. Farooq, A Machine Learning-based Self-risk Assessment Technique for Cervical Cancer, Curr. Bioinf., 16 (2021), 315-332. doi: 10.2174/1574893615999200608130538
|
| [12] |
Y. Luo, X. Wang, L. Li, Q. Wang and Y. Luo, Bioinformatics analysis reveals centromere protein K can serve as potential prognostic biomarker and therapeutic target for non-small cell lung cancer, Curr. Bioinf., 16 (2021), 106-119. doi: 10.2174/1574893615999200728100730
|
| [13] |
S. Liu, H. Tang, H. Liu, J. Wang, Multi-abel learning for the diagnosis of cancer and identification of novel biomarkers with high-throughput omics, Curr. Bioinf., 16 (2021), 261-273. doi: 10.2174/1574893615999200623130416
|
| [14] |
L. Yang, H. Gao, K. Wu, H. Zhang, L. Tang, Identification of cancerlectins by using cascade linear discriminant analysis and optimal g-gap tripeptide composition, Curr. Bioinf., 15 (2020), 528-537. doi: 10.2174/1574893614666190730103156
|
| [15] |
Z. Lv, J. Zhang, H. Ding, Q. Zou, RF-PseU: a random forest predictor for RNA pseudouridine sites, Front. Bioeng. Biotechnol., 8 (2020), 134. doi: 10.3389/fbioe.2020.00134
|
| [16] | Q. Yang, B. Li, S. Chen, T. Jing, Y. Li, L. Yi, et al, MMEASE: online meta-analysis of metabolomic data by enhanced metabolite annotation, marker selection and enrichment analysis, J. Proteomics, (2021), 104023. |
| [17] | Z. Lv, P. Wang, Q. Zou, Q. Jiang, Identification of Sub-Golgi protein localization by use of deep representation learning features, Bioinformatics, 36 (2020), 5600-5609. |
| [18] |
F. Wang, G. Qin, J. Liu, X. Wang, B. Ye, Bio-analytical identification of key genes that could contribute to the progression and metastasis of osteosarcoma, Curr. Bioinf., 16 (2021), 216-224. doi: 10.2174/1574893615999200801014939
|
| [19] | Z. Lv, S. Jin, H. Ding, Q. Zou, A random forest sub-Golgi protein classifier optimized via dipeptide and amino acid composition features, Front. Bioeng. Biotechnol., 7 (2019). |
| [20] | Z. Lv, C. Ao, Q. Zou, Protein function prediction: from traditional classifier to deep learning, Proteomics, 19 (2019), 1900119. |
| [21] |
J. Pan, X. Luo, T. Shao, C. Li, G. Wang, Identification of genomic islands in synechococcus sp. WH8102 using genomic barcode and whole-genome microarray analysis, Curr. Bioinf., 16 (2021), 24-30. doi: 10.2174/1574893615666200121160615
|
| [22] |
H. Wang, Y. Ding, J. Tang, F. Guo, Identification of membrane protein types via multivariate information fusion with Hilbert-Schmidt Independence Criterion, Neurocomputing, 383 (2020), 257-269. doi: 10.1016/j.neucom.2019.11.103
|
| [23] |
Y. Shen, J. Tang, F. Guo, Identification of protein subcellular localization via integrating evolutionary and physicochemical information into Chou's general PseAAC, J. Theor. Biol., 462 (2019), 230-239. doi: 10.1016/j.jtbi.2018.11.012
|
| [24] |
Y. Ding, J. Jun, G. Fei, Identification of drug-target interactions via dual laplacian regularized least squares with multiple kernel fusion, Knowl.-Based Syst., 204 (2020), 106254. doi: 10.1016/j.knosys.2020.106254
|
| [25] | H. Wang, Y. Ding, J. Jun, G. Fei, Exploring associations of non-coding RNAs in human diseases via three-matrix factorization with hypergraph-regular terms on center kernel alignment, Briefings Bioinf., 2021. |
| [26] | Y. Ding, J. Tang, F. Guo, Identification of drug-target interactions via fuzzy bipartite local model, Neural. Comput. Appl., 23 (2020), 10303-10319. |
| [27] |
X. Zeng, X. Song, T. Ma, X. Pan, Y. Zhou, Y Hou, Repurpose open data to discover therapeutics for COVID-19 using deep learning, J. Proteome Res., 19 (2020), 4624-4636. doi: 10.1021/acs.jproteome.0c00316
|
| [28] | G. Turashvili, E. Brogi, Tumor heterogeneity in breast cancer, Front. Biomed., (2017), 227. |
| [29] | M. Hofree, J. P. Shen, H. Carter, G. Andrew, I. Trey, Network-based stratification of tumor mutations, Nat. Med., 10 (2013), 1108-1115. |
| [30] |
X. Li, A fast and exhaustive method for heterogeneity and epistasis analysis based on multi-objective optimization, Bioinformatics, 33 (2017), 2829-2836. doi: 10.1093/bioinformatics/btx339
|
| [31] |
H. Xu, W. Zeng, D. Zhang, X. Zeng, MOEA/HD: a multiobjective evolutionary algorithm based on hierarchical decomposition, IEEE. Trans. Cybern., 49 (2019), 517-526. doi: 10.1109/TCYB.2017.2779450
|
| [32] |
H. Xu, W. Zeng, X. Zeng, G. Gary, An evolutionary algorithm based on Minkowski distance for many-objective optimization, IEEE. Trans. Cybern., 49 (2019), 3968-3979. doi: 10.1109/TCYB.2018.2856208
|
| [33] |
X. Zeng, W. Wang, C. Chen, G. Yen, A consensus community-based particle swarm optimization for dynamic community detection, IEEE. Trans. Cybern., 50 (2020), 2502-2513. doi: 10.1109/TCYB.2019.2938895
|
| [34] | X. Li, C. Wang, L. Liu, X. Xia, A method for heterogeneity analysis of complex diseases based on clustering algorithm, in 2017 13th International Conference on Computational Intelligence and Security (CIS), (2017). |
| [35] |
L. Jiang, Y. Ding, J. Tang, G. Fei, MDA-SKF: similarity kernel fusion for accurately discovering miRNA-disease association, Front. Genet., 9 (2018), 1-13. doi: 10.3389/fgene.2018.00001
|
| [36] |
B. Liu, X. Gao, H. Zhang, BioSeq-Analysis2.0: an updated platform for analyzing DNA, RNA and protein sequences at sequence level and residue level based on machine learning approaches, Nucleic Acids Res., 47 (2019), e127. doi: 10.1093/nar/gkz740
|
| [37] |
B. Liu, C. Li, K. Yan, DeepSVM-fold: Protein fold recognition by combining Support Vector Machines and pairwise sequence similarity scores generated by deep learning networks, Briefings Bioinf., 21 (2020), 1733-1741. doi: 10.1093/bib/bbz098
|
| [38] |
S. Jin, X. Zeng, F. Xia, W. Huang, X. Liu, Application of deep learning methods in biological networks, Briefings Bioinf., 22 (2021), 1902-1917. doi: 10.1093/bib/bbaa043
|
| [39] | L. Cai, L. Wang, X. Fu, C. Xia, X. Zeng, Q. Zou, ITP-Pred: an interpretable method for predicting, therapeutic peptides with fused features low-dimension representation, Briefings Bioinf., 22 (2020). |
| [40] | H. Lv, F. Dao, Z. Guan, H. Yang, Y. Li, H. Lin, Deep-Kcr: accurate detection of lysine crotonylation sites using deep learning method, Briefings Bioinf., 22 (2021). |
| [41] | F. Dao, H. Lv, D. Zhang, Z. Zhang, H. Lin, DeepYY1: a deep learning approach to identify YY1-mediated chromatin loops, Briefings Bioinf., 22 (2021). |
| [42] | F. Dao, H. Lv, W. Su, Z. Sun, H. Lin, iDHS-Deep: an integrated tool for predicting DNase I hypersensitive sites by deep neural network, Briefings Bioinf., 2021. |
| [43] |
D. Wang, Z. Zhang, Y. Jiang, Z. Mao, D. Xu, DM3Loc: multi-label mRNA subcellular localization prediction and analysis based on multi-head self-attention mechanism, Nucleic Acids Res., 49 (2021), e46-e46. doi: 10.1093/nar/gkab016
|
| [44] |
Y. Jiang, D. Ma, C. Suo, Genomic and transcriptomic landscape of triple-negative breast cancers: subtypes and treatment strategies, Cancer Cell, 35 (2019), 428-440. doi: 10.1016/j.ccell.2019.02.001
|
| [45] |
M. J. Bou-Dargham, Y. Liu, Q. Sang, J. Zhang, T. Seagroves, Subgrouping breast cancer patients based on immune evasion mechanisms unravels a high involvement of transforming growth factor-beta and decoy receptor 3, PLoS One., 13 (2018), e0207799. doi: 10.1371/journal.pone.0207799
|
| [46] |
A. Robertson, J. Shih, C. Yau, E. Gibb, J. Oba, K. Mungall, et al, Integrative analysis identifies four molecular and clinical subsets in uveal melanoma, Cancer Cell, 32 (2017), 204-220. doi: 10.1016/j.ccell.2017.07.003
|
| [47] |
Z. Xiong, Q. Yang, X. Li, Effect of intra-and inter-tumoral heterogeneity on molecular characteristics of primary IDH-wild type glioblastoma revealed by single-cell analysis, CNS. Neurosci. Ther., 26 (2020), 981-989. doi: 10.1111/cns.13396
|
| [48] |
D. Lawson, K. Kessenbrock, R. Davis, N. Pervolarakis, Z. Werb, Tumour heterogeneity and metastasis at single-cell resolution, Nat. Cell Biol., 20 (2018), 1349-1360. doi: 10.1038/s41556-018-0236-7
|
| [49] | H. Xu, W. Zeng, X. Zeng, G. Yen, A polar-metric-based evolutionary algorithm, IEEE. Trans. Cybern., 2021. |
| [50] |
P. Jing, H. Shen, MACOED: a multi-objective ant colony optimization algorithm for SNP epistasis detection in genome-wide association studies, Bioinformatics, 31 (2015), 634-641. doi: 10.1093/bioinformatics/btu702
|
| [51] |
M. Srinivas, L. Patnaik, Adaptive probabilities of crossover and mutation in genetic algorithms, IEEE. Trans. Syst. Man. Cybern. 24 (1994), 656-667. doi: 10.1109/21.286385
|
| [52] | T. Chen, C. Guestrin, Xgboost: A scalable tree boosting system, in Proceedings of the 22nd acm sigkdd international conference on knowledge discovery and data mining, (2016), 785-794. |
| [53] |
R. Urbanowicz, J. Kiralis, N. A. Sinnott-Armstrong, T. Heberling, J. H. Moore, GAMETES: a fast, direct algorithm for generating pure, strict, epistatic models with random architectures, BioData Min., 5 (2012), 1-14. doi: 10.1186/1756-0381-5-1
|
| [54] |
L. Wei, Y. Ding, R. Su, Y. Jie, S. Ran, Prediction of human protein subcellular localization using deep learning, J. Parallel. Distr. Com., 117 (2018), 212-217. doi: 10.1016/j.jpdc.2017.08.009
|
| [55] | L. Wei, W. He, A. Malik, B. Manavalan, Computational prediction and interpretation of cell-specific replication origin sites from multiple eukaryotes by exploiting stacking framework, Briefings Bioinf., 22 (2021). |
| [56] |
Y. Ding, J. Tang, F. Guo, Identification of drug-side effect association via multiple information integration with centered kernel alignment, Neurocomputing, 325 (2019), 211-224. doi: 10.1016/j.neucom.2018.10.028
|
| [57] |
J. Moore, J. Gilbert, C. Tsai, F. Chiang, T. Holden, N. Barney, et al, A flexible computational framework for detecting, characterizing, and interpreting statistical patterns of epistasis in genetic studies of human disease susceptibility, J. Theor. Biol., 241 (2006), 252-261. doi: 10.1016/j.jtbi.2005.11.036
|
Figures(9) / Tables(2)

Xia Chen, Yexiong Lin, Qiang Qu, Bin Ning, Haowen Chen, Xiong Li. An epistasis and heterogeneity analysis method based on maximum correlation and maximum consistence criteria[J]. Mathematical Biosciences and Engineering, 2021, 18(6): 7711-7726. doi: 10.3934/mbe.2021382


 DownLoad: