


| Microclimate parameters | Quantification |
| Relative humidity | 56.17–68.21% |
| Light intensity | 210–1780 µmol/m2/s |
| Day temperature | 30–34 ℃ |
| Night temperature | 17–24 ℃ |
| Ambient CO2 | 388.70 µmol/mol |
Citation: Ayu Azera Izad, Rosimah Nulit, Che Azurahanim Che Abdullah, A'fifah Abdul Razak, Teh Huey Fang, Mohd Hafiz Ibrahim. Growth, leaf gas exchange and biochemical changes of oil palm (Elaeis guineensis Jacq.) seedlings as affected by iron oxide nanoparticles[J]. AIMS Materials Science, 2019, 6(6): 960-984. doi: 10.3934/matersci.2019.6.960
| [1] | Aman Santoso, Novita Agustin, Sumari Sumari, Siti Marfuah, Rini Retnosari, Ihsan Budi Rachman, Anugrah Ricky Wijaya, Muhammad Roy Asrori . Synthesis of methyl esters from palm oil, candlenut oil, and sunflower seed oil and their corrosion phenomena on iron nail. AIMS Materials Science, 2022, 9(5): 719-732. doi: 10.3934/matersci.2022044 |
| [2] | Anna Godymchuk, Alexey Ilyashenko, Yury Konyukhov, Peter Ogbuna Offor, Galiya Baisalova . Agglomeration and dissolution of iron oxide nanoparticles in simplest biological media. AIMS Materials Science, 2022, 9(4): 642-652. doi: 10.3934/matersci.2022039 |
| [3] | Denise Arrozarena Portilla, Arturo A. Velázquez López, Rosalva Mora Escobedo, Hernani Yee Madeira . Citrate coated iron oxide nanoparticles: Synthesis, characterization, and performance in protein adsorption. AIMS Materials Science, 2024, 11(5): 991-1012. doi: 10.3934/matersci.2024047 |
| [4] | Hafizah Naihi, Rubiyah Baini, Ibrahim Yakub . Oil palm biomass-based activated carbons for the removal of cadmium—a review. AIMS Materials Science, 2021, 8(3): 453-468. doi: 10.3934/matersci.2021028 |
| [5] | Yunyan Wang, Manu Hegde, Shuoyuan Chen, Penghui Yin, Pavle V. Radovanovic . Control of the spontaneous formation of oxide overlayers on GaP nanowires grown by physical vapor deposition. AIMS Materials Science, 2018, 5(1): 105-115. doi: 10.3934/matersci.2018.1.105 |
| [6] | Gérrard Eddy Jai Poinern, A F M Fahad Halim, Derek Fawcett, Peter Chapman, Rupam Sharma . Banksia Ashbyi-engineered facile green synthesis of magnetite nanoparticles: Characterization, and determination of micro-strain, stress, and physical parameters by X-ray-based Williamson-Hall analysis. AIMS Materials Science, 2024, 11(6): 1096-1124. doi: 10.3934/matersci.2024053 |
| [7] | Rasaq Kazeem, Tien-Chien Jen, Godwin Akande, Stephen Akinlabi, Esther Akinlabi . Performance evaluation of hybrid biodegradable oils as a lubricant during cylindrical turning of AISI 304 austenitic stainless steel. AIMS Materials Science, 2024, 11(2): 256-294. doi: 10.3934/matersci.2024015 |
| [8] | Iñaki López, Teresa Cebriano, Pedro Hidalgo, Emilio Nogales, Javier Piqueras, Bianchi Méndez . The role of impurities in the shape, structure and physical properties of semiconducting oxide nanostructures grown by thermal evaporation. AIMS Materials Science, 2016, 3(2): 425-433. doi: 10.3934/matersci.2016.2.425 |
| [9] | Jamal Alnofiay, Ahmed Al-Shahrie, Elsayed Shalaan . Green synthesis of high-performance gallium oxide supercapacitor: A path to outstanding energy density. AIMS Materials Science, 2024, 11(6): 1065-1082. doi: 10.3934/matersci.2024051 |
| [10] | Venkatesha Narayanaswamy, Imaddin A. Al-Omari, Aleksandr. S. Kamzin, Chandu V. V. Muralee Gopi, Abbas Khaleel, Sulaiman Alaabed, Bashar Issa, Ihab M. Obaidat . Exchange bias, and coercivity investigations in hematite nanoparticles. AIMS Materials Science, 2022, 9(1): 71-84. doi: 10.3934/matersci.2022005 |
Nanotechnology is a technique that manipulates atoms and molecules presented in nanoscale matter with size ranging less than 100 nm to create new materials, devices, and structures. Nanotechnology has become the platform for the advancement of various fields such as electronics, agriculture, cosmetics, chemical and food sector [1]. Fast-growing of nanotechnology has increased the worldwide production and usage of nanoparticles (NPs) [2]. In 2020, the worldwide production and use of NPs were predicted to reach half a million tons [3], while iron oxide will be one of the significant contributors [4].
Interest on the bright potentials of iron oxide nanoparticles (Fe3O4 NPs) in agriculture has increased due to their nanosized (1–100 nm) and unique physical characteristics [5]. Iron was extensively used in many industries and most preferred in plant studies because of its chemical stability and biocompatibility [6]. Iron oxide NPs able to accumulate in plants and bind with the organic chemicals, which then be absorbed by the plant tissues [7]. Therefore, in the agricultural sector, Fe3O4 NPs have been used as novel tools to improve crop safety, yield and quality [8]. For instance, iron oxide NPs protect plants against harmful effects induced by abiotic stress [9]. Research about drought stress conducted by Zareii et al. [10] proved that Carthamus tinctorious treated with Fe3O4 NPs able to minimize the harmful effects and initiate the yield parameters of plants. In the previous study, application of iron oxide nanoparticle-based fertilizer was found to increase crop yield and production in Glycine max by enhancing photosynthetic activities and plant growth [11]. Iron oxide NPs in fertilizer able to provide cofactors for the plants to tolerate and minimize the nutrient-deficient stress [12,13]. Iron oxide NPs is non-toxic to plants at a specific concentration. Thus, researchers believed that Fe3O4 NPs at a specific range of levels could stimulate plant growth [14] of various crops such as cucumber [15], barley [16], Chinese mungbean [17] and Arabidopsis thaliana [18]. Other than that, Fe3O4 NPs could improve the physiological processes of plants [17]. As a coin has two sides, Fe3O4 NPs were reported to have negative impacts on plant growth. Iron oxide was toxic to the plants that treated with a high concentration of Fe3O4 NPs for a long time exposure. The toxic effects reduced yield production by inhibiting germination of seed, plant growth and disrupting metabolic activities [19,20].
Rapid development and usage of Fe3O4 NPs should, along with continuous research in evaluating their impacts in plant system [21]. There are many reports concerning the positive and negative effects of NPs on various plant species because NPs may behave differently in different condition [22]. Nanoparticles gave diverse effects on plants depend on the species, growth conditions, as well as properties of the nanoparticles [23]. This suggests that different plants have varied responses to nanosized particles, and the positive and harmful biological effects of NPs are still to be fully understood. As far as the authors are aware, there is a lack of work carried out on the interaction of iron nanomaterials with oil palm seedlings. In addition, a good understanding of the relationship between iron oxide nanoparticles and oil palm would be crucial to predicting the toxicity effects of these materials, since these materials are expected to be widely used in future for fertilizer and pesticides production. With this, the objective of this study was to assess the toxicity impact of Fe3O4 NPs on the growth, leaf gas exchange and biochemical response of oil palm seedlings. Correlation analysis was also conducted to understand the relationship between different parameters within the study. This study provided preliminary results for the risk evaluation of Fe3O4 NPs in oil palm seedlings, which will be very useful when no or few data are available.
Iron oxide NPs nanopowders (50–100 nm) were purchased from Sigma Aldrich Chemical Co. (St. Louis, MO, USA), with a purity of 97%. Iron oxide NPs suspensions were prepared in distilled water. The suspension was adjusted to the concentration of 0,800, 1600 and 2400 mg/L, respectively in different containers. The Fe3O4 NPs suspension was firstly sonicated by using Sonic's Vibra-Cell (Model VCX 750) for 30 min in order to obtain a homogeneous mixture and increase dispersion.
The experiment was conducted in a glasshouse for a month. The 3-month-old tenera (Dura x Pisifera) oil palm seedlings were obtained from MPOB Breeding Group, Kluang. Each seedling was grown in a polybag filled with 3.5 kg of topsoil (Serdang Series). Four treatments of different concentration of Fe3O4 NPs (0,800, 1600 and 2400 mg/L) were applied in this experiment. Each seedling was watered directly with 50 mL of Fe3O4 NPs suspension twice a month. The microclimatic condition under the glasshouse is presented in Table 1.
| Microclimate parameters | Quantification |
| Relative humidity | 56.17–68.21% |
| Light intensity | 210–1780 µmol/m2/s |
| Day temperature | 30–34 ℃ |
| Night temperature | 17–24 ℃ |
| Ambient CO2 | 388.70 µmol/mol |
 DownLoad:
CSV
DownLoad:
CSV
The experimental design followed Randomized Completely Block Design (RCBD). There are three blocks and each block represents one replication of each treatment. Each block consisted of 4 plots. One plot consisted of 3 plants and 44 plants were used in this experiment.
Destructive plant analysis was carried out at 4th week after the first treatment was applied.
The plant height was measured by using a meter ruler whereas the digital caliper was used to measure the bole diameter. The leaves numbers were counted manually and total biomass was calculated by dividing the total fresh weight with total dry weight. The total chlorophyll content of each plant in the leaf number two was measured by using SPAD Chlorophyll Meter. The average of three readings of three spots was recorded.
Stomata density was measured by following the leaf impression method. Clear nail polish was used to make an impression of the leaf surface. The impression was peeled by using sticky tape and placed on a glass slide. Both leaf surfaces (adaxial and abaxial) was examined under the compound microscope with a magnification of 400×.
The portable photosynthesis system, LI-6400XT (Li-COR Inc; Nebraska; USA) was used to measure the leaf gas exchange characteristic of fully expanded leaf number two in the morning with the time between 9.00 am to 11.00 am. The portable instrument was left to be warmed for half an hour and ZERO IRGA mode was used for calibration. The ZERO IRGA mode was a standard calibration procedure before leaf gas exchange measurements can be conducted. The steps in the calibration process were zeroing process for the built-in flow meter and infra-red gas analyzer. The instrument was set at optimal conditions; 30 ℃ cuvette temperature, 400 μmol/mol CO2, 60% relative humidity with 500 cm3/min rates of airflow and modified cuvette condition of 800 μmol/m2/s photosynthetically photon flux density (PPFD). The recorded data were automatically stored in the LI-6400XT console. Photosyn Assistant Software (Dundee Scientific, Dundee, UK) was used to analyze the collected data.
Chlorophyll fluorimeter (Pocket Pea, Hansatech Inc) was used to measure the chlorophyll fluorescence. Chlorophyll fluorescence is light re-emitted by chlorophyll molecules during return from excited to non-excited states. It is used as an indicator of photosynthetic performance in plants whether they are under stress condition or not [24]. Firstly, the leaf-clip covered frond number two, and the shutter-plate was closed for 15–20 min for the dark adaptation process to occur effectively. Then the maximum efficiency of photosystem Ⅱ (fv/fm), Maximum quantum yield of the photochemical and non-photochemical process in photosystem Ⅱ(fv/fo), and performance index (PI) were recorded in the system.
Proline is an amino acid that acts as a reliable indicator of environmental stress [25]. Proline content determination followed a method performed by Zain et al. [26]. Five milligrams of freeze-dried and homogenized samples were extracted in 3% 5-sulphosalicylic acid (0.5 mL) for 15 min which then centrifuged at 21,000 rpm for another 15 min. The supernatant (200 µL) was transferred to polypropylene screw cap vials. Concentrated formic acid (200 µL) and 3% ninhydrin reagent (400 µL) in 2-methoxyethanol were added. The mixture was heated in a water-bath (100 ℃) for 30 min, before been transferred to 96-well plates. The proline content was at 514 nm on a microplate reader (Synergy 2, Bio-Tek, Winooski, VT, USA). The results of proline content were expressed in µg/g dry weight.
Malondialdehyde (MDA) is a reactive organic molecule formed by three-carbon molecules with two aldehyde groups. MDA content has been used as a lipid peroxidation marker of oxidative stress in plants [27]. MDA determination followed a method performed by Ibrahim and Jaafar [28]. Plant sample (1 g) was homogenized in 1 mL of 0.5% trichloracetic acid (TCA) and centrifuged at 9,000 rpm for 20 min. The supernatant (0.5 mL) was mixed with 2.5 mL TCA (20%) in TBA (0.5%) and heated in a boiling water bath for 30 min. The mixture was placed in an ice bath quickly before been centrifuged at 9,000 rpm for 10 min to measure the MDA content spectrophotometrically at the absorbance of 532 nm.
Soluble sugar determination was followed by a method described by Ibrahim et al. [29]. Samples (0.5 g) were mixed with 10 mL of distilled water, and the mixture was vortexed, which later been incubated for 10 min. Next, 0.1 g of anthrone was dissolved in 50 mL of sulphuric acid (95%) to make anthrone reagent. A standard curve was prepared to quantify sucrose in the sample by using sucrose as a standard stock solution. Dried samples were mixed with distilled water and centrifuged at 3,400 rpm for 10 min. The sample (4 mL) was mixed with 8 mL of anthrone reagent and placed in a water bath (100 ℃) for 5 min. The soluble sugar was measured spectrophotometrically at absorbance 620 nm and results were expressed as mg sucrose/g dry sample.
Phenolics and flavonoids are secondary plant metabolites, which mainly act as an antioxidant during plant stress condition [30]. The method of Ibrahim et al. [31], was used, using 10 mL of ethanol (80%) to extract 0.1 g leaf samples on an orbital shaker for 120 min at 50 ℃. The mixture was filtered and the filtrate (200 mL) was mixed with 1.5 mL of Folin-Ciocalteu reagent (Sigma Aldrich, Missouri, USA; diluted 10-fold) in order to quantify total phenolic content of the leaf samples. The absorbance was measured at 725 nm and the results were expressed as mg/g gallic acid equivalent (mg GAE/g dry sample). Then, total flavonoids were determined by mixing 1 mL of sample extract with NaNO3 (Sigma Aldrich, Missouri, USA; 0.3 mL) for 5 min. The mixture was added with 10% AlCl3 (Wako Pure Chemical Industries Ltd; Tokyo, Japan; 0.3 mL) and 1 M NaOH (Kanto Chemical Co. Inc.; Hokkaido, Japan; 2 mL). The absorbance was measured at 510 nm using a spectrophotometer with rutin as a standard. Results were expressed as mg/g rutin dry sample.
To determine the amount of iron concentration taken up by the treated plants, the determination of iron content in the leaves was done by following a method by Bienfait et al. [32]. The leaves were washed with 0.5 mmol/L CaSO4 solution for 10 min. The samples were placed in a test tube containing a mixture of 40 mL of a MES buffer solution and 10 mmol/L 2-morpholinethanesulfonic acid, 0.5 mmol/L Ca(NO3)2 and 1.5 mmol/L 2, 2′-bipyridin. Then, 2 mL of 250 mmol/L dithionate solution was added and an aliquot of the solution was withdrawn immediately for measurement of the absorbance in the spectrophotometer. Further aliquots of the solution were used for measurement of the absorbance of the Fe(bipyridin)3 complex every 2 min over the next 10 min with nitrogen being bubbled continuously through the solution.
The recorded data were analyzed using Statistical Package for Social Sciences (SPSS) version 21. All parameters were analyzed using a two-way ANOVA Test using the Duncan test to evaluate whether the means were significantly different. Data were considered significant if the p-value is ≤0.05.
Table 2 shows the growth patterns of oil palm seedlings growth as affected by iron oxide nanoparticles. These findings (Table 2) suggest that Fe3O4 NPs application did not significantly p ≤ 0.05 affect the growth of oil palm seedlings. The Fe3O4 NPs application did not influence the plant height, bole diameter, total biomass and leaf number, whereas total chlorophyll content was significantly decreased as the Fe3O4 NPs concentration increased (Table 3). total chlorophyll content was significantly decreased as the Fe3O4 NPs concentration increased. It seems possible that these results are due to little effects of Fe in plant growth since Fe is a micronutrient which needed by plants in low quantity [33]. In this study, Fe did not play a significant role in young seedlings growth within a short exposure period (1 month) as the exposure time, and plant stage is generally seen as the factors strongly related to Fe accumulation in the plant tissue [34]. The effects of the Fe on the growth of the seedling would be more convincing if the seedlings exposed to Fe3O4 NPs in longer exposure time. These results are similar to that found by Iannone et al. [34] who showed that Fe3O4 NPs did not affect the growth of wheat (Triticum aestivum L.) as exposed during a short time.
| Iron oxide (mg/L) | Height (cm) | Diameter (mm) | Total biomass (g) | Leaf number | Total chlorophyll content (TCC) |
| 0 | 41.84 ± 1.10a | 17.67 ± 0.57a | 8.32 ± 0.38a | 6.44 ± 0.18a | 49.39 ± 0.93a |
| 800 | 41.47 ± 1.39a | 16.78 ± 0.41a | 8.22 ± 0.37a | 7.11 ± 0.20a | 52.73 ± 1.06b |
| 1600 | 40.30 ± 1.11a | 16.77 ± 0.56a | 8.29 ± 0.48a | 6.89 ± 0.26a | 44.59 ± 1.33c |
| 2400 | 40.41 ± 0.80a | 17.37 ± 0.27a | 8.41 ± 0.37a | 6.78 ± 0.22a | 41.33 ± 2.59d |
DownLoad:
CSV
| S. Variation | Iron oxide | Blocks | Interaction |
| PH | ns | ns | ns |
| D | ns | ns | ns |
| T.B | ns | ns | ns |
| LN | ns | ns | ns |
| TCC | *** | ns | * |
| Adaxial | * | ns | ns |
| Abaxial | ** | ns | ns |
| T.S | ** | ns | ns |
| A | *** | ns | ns |
| WUE | * | ns | ns |
| Ci | ** | * | ns |
| fv/fm | ** | ns | ns |
| fv/fo | ** | ns | ns |
| PI | *** | ns | ns |
| Proline | *** | ns | ns |
| MDA | *** | ns | ns |
| Sugar | *** | ** | ns |
| TPC | *** | ns | ns |
| TFC | *** | ns | ns |
| Iron | *** | ns | ns |
| *Note: PH= plant height; D = Diameter; T.B = total biomass; LN = number of leaf; TCC = total chlorophyll content; Adaxial = adaxial stomata densities; Abaxial = abaxial stomata densities; T.S = Total stomata densities; A = net photosynthesis; WUE = water use efficiency; Ci = intercellular CO2; fv/fm = maximum efficiency of photosystem Ⅱ; fv/fo = maximum quantum yield of photochemical and non-photochemical process in photosystem Ⅱ; PI = photosynthetic performance index; Proline = proline content; MDA = malondialdehyde; Sugar = soluble sugar; TPC = total phenolics content; TFC = total flavonoids content; Iron = iron content. *, **, ***, significant at p ≤ 0.05, 0.01, 0.001, respectively; ns = not significant. | |||
DownLoad:
CSV
In contrast to plant growth, total chlorophyll content of seedlings exposed to 800 and 2400 mg/L Fe3O4 NPs was increased by 6.3% and 2.23% in comparison to control, respectively (Table 1). Based on Pearson correlation analysis (Table 4), it was shown that total chlorophyll content (TCC) has a significant positive (p ≤ 0.05) linear relationship between fv/fm, fv/fo and PI recording correlation coefficient value of 0.549, 0.542 and 0.557 respectively. This signifies that photosynthetic activity was lower under seedlings that had low TCC. Increased of TCC in seedlings exposed to a low concentration of Fe3O4 NPs is similar to those reported by Mohammad et al. [35] who found that the uptake of Fe3O4 NPs increased the content of chlorophyll a and chlorophyll b in soybean since iron is the fundamental component of the chlorophyll molecule. The addition of Fe3O4 NPs is able to improve photosynthetic activities [36]. However, high Fe3O4 NPs concentration significantly reduced TCC of oil palm seedlings. Seedlings under treatment of 1600 and 2400 mg/L Fe3O4 NPs were significantly reduced compared to control and 800 mg/L Fe3O4 NPs. The decrease in total chlorophyll content is general symptoms of phytotoxicity [34]. Trujillo-Reyes et al. [20] also reported the same result with the current findings where lettuce that treated with 20 mg/L of Fe3O4 NPs produce low chlorophyll content. A similar reduction was also observed in other plant species exposed to other nanoparticles. It has been reported that zinc oxide NPs decreased the chlorophyll content of green peas (Pisum sativum), Triticum aestivum and Arabidopsis [37,38,39]. Besides, titanium dioxide NPs altered the chlorophyll content of cucumber and Phaseolus vulgaris [40,41]. So, it can be concluded that the application of high levels of iron oxides did not influence plant growth characteristics. However, the application of iron oxide more than 800 mg/L would reduce the production of total chlorophyll content in oil palm seedling as observed in the present study.
| Parameters | Biomass | Leaf_no | Diameter | Height | Tcc | Adaxial | Abaxial | TS | A | WUE | Ci | fv/fm | fv/fo | PI | Proline | MDA | Sugar | TPC | TFC | Iron |
| Biomass | 1 | |||||||||||||||||||
| Leaf_no | 0.236 | 1 | ||||||||||||||||||
| Diameter | 0.590** | 0.122 | 1 | |||||||||||||||||
| Height | 0.605** | -0.044 | 0.394* | 1 | ||||||||||||||||
| TCC | 0.019 | 0.145 | -0.059 | 0.212 | 1 | |||||||||||||||
| Adaxial | 0.319 | 0.000 | 0.197 | 0.073 | 0.061 | 1 | ||||||||||||||
| Abaxial | 0.261 | 0.153 | 0.211 | -0.074 | 0.094 | 0.486* | 1 | |||||||||||||
| T.S | 0.333 | 0.097 | 0.237 | -0.009 | 0.091 | 0.832** | 0.889** | 1 | ||||||||||||
| A | -0.032 | -0.206 | 0.174 | 0.224 | 0.395 | 0.288 | 0.197 | 0.276 | 1 | |||||||||||
| WUE | -0.146 | -0.351 | -0.213 | 0.136 | 0.158 | 0.213 | 0.162 | 0.214 | 0.657** | 1 | ||||||||||
| Ci | 0.198 | -0.127 | 0.434* | 0.095 | 0.156 | 0.245 | 0.164 | 0.232 | 0.563** | -0.069 | 1 | |||||||||
| fv/fm | -0.005 | 0.008 | -0.162 | -0.007 | 0.671** | 0.198 | 0.313 | 0.302 | 0.628** | 0.361 | 0.410* | 1 | ||||||||
| fv/fo | -0.075 | -0.057 | -0.110 | -0.029 | 0.705** | 0.165 | 0.253 | 0.247 | 0.689** | 0.415* | 0.456* | 0.968** | 1 | |||||||
| PI | -0.002 | 0.064 | 0.139 | 0.057 | 0.658** | -0.077 | 0.121 | 0.037 | 0.558** | 0.176 | 0.501* | 0.677** | 0.797** | 1 | ||||||
| Proline | 0.088 | 0.328 | -0.172 | -0.156 | -0.389 | -0.309 | -0.228 | -0.306 | -0.909** | -0.555** | -0.701** | -0.658** | -0.736** | -0.592** | 1 | |||||
| MDA | -0.054 | 0.260 | -0.224 | -0.172 | -0.378 | -0.415* | -0.219 | -0.356 | -0.922** | -0.523** | -0.712** | -0.646** | -0.709** | -0.560** | 0.955** | 1 | ||||
| Sugar | 0.097 | 0.424* | -0.176 | -0.121 | -0.103 | -0.186 | 0.099 | -0.034 | -0.740** | -0.434* | -0.593** | -0.343 | -0.452* | -0.408* | 0.797** | 0.844** | 1 | |||
| TPC | -0.013 | 0.320 | -0.172 | -00.126 | -.200 | -0.265 | -0.192 | -0.261 | -0.846** | -0.416* | -0.809** | -0.507* | -0.572** | -0.501* | 0.907** | 0.879** | 0.746** | 1 | ||
| TFC | -0.110 | 0.348 | -0.052 | -0.020 | 0.017 | -0.576** | -0.255 | -0.463* | -0.518** | -0.403 | -0.643** | -0.387 | -0.404 | -0.160 | 0.641** | 0.639** | 0.548** | 0.704** | 1 | |
| Iron | -0.054 | 0.353 | -0.145 | -0.036 | -0.005 | -0.005 | -0.053 | -0.037 | -0.586** | -0.220 | -0.717** | -0.398 | -0.494* | -0.515* | 0.729** | 0.656** | 0.636** | 0.776** | 0.606** | 1 |
| *Note: Significant at p ≤ 0.01. Biomass = total biomass; Leaf_no = number of leaf; Diameter = bole diameter; Height = plant height; TCC = total chlorophyll content; Adaxial = adaxial stomata densities; Abaxial = abaxial stomata densities; T.S = Total stomata densities; A = net photosynthesis; WUE = water use efficiency; Ci = intercellular CO2; fv/fm = maximum efficiency of photosystem Ⅱ; fv/fo = maximum quantum yield of photochemical and non-photochemical process in photosystem Ⅱ; PI = photosynthetic performance index; Proline = proline content; MDA = malondialdehyde; Sugar = soluble sugar; TPC = total phenolics content; TFC = total flavonoids content; Iron = iron conten | ||||||||||||||||||||
DownLoad:
CSV
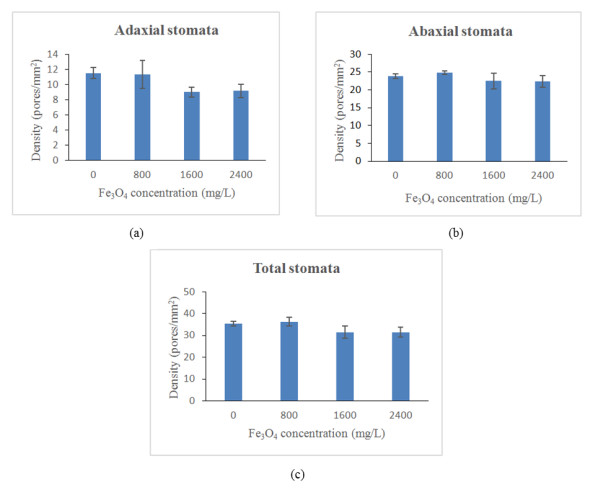
Figure 1 shows the stomatal density of oil palm seedlings treated with iron oxide nanoparticles. Generally, application of Fe3O4 NPs significantly (p ≤ 0.05) reduced the stomata densities of oil palm seedlings. Specifically, application of Fe3O4 NPs at 1600 and 2400 mg/L significantly reduced the adaxial, abaxial and total stomata densities of oil palm seedlings (Table 3). However, the difference between 1600 and 2400 mg/L Fe3O4 NPs and control were not significant. Total stomata densities and abaxial stomata density at 800 mg/L Fe3O4 NPs showed a slight increased by 2.34% and 4.03%, respectively as compared to control. Data on the stomata densities show that oil palm seedlings leaves are amphistomous, where stomata present on both adaxial and abaxial leaf surfaces. In leaves of the oil palm seedlings, the adaxial side had fewer stomata than the abaxial side. In the present study, the decreased in stomata densities might have contributed to a decrease in net photosynthesis with increasing Fe3O4 NPs concentration [42]. The increase in stomatal density contributes to an increase in higher photosynthetic rate because much CO2 is diffusing into the cells. However, as the stomata density decreased, the rate of photosynthesis decrease until it can stop entirely with no diffusion of CO2 [43]. Usually, leaves stomata density would decrease to elevated CO2 and plant under the stressful condition that was observed in the current study [44].
In Figure 2 the net photosynthesis of oil palm seedlings under iron oxide nanoparticles was shown. It seems that the effect of net photosynthesis (A) was observed to be mainly contributed by Fe3O4 NPs concentration (Figure 2; Table 3). Net photosynthesis of controlled seedlings recorded the highest value at 8.31 μmol/m2/s followed by A reached at 800 mg/L (7.91 μmol/m2/s) while that recorded at 2400 mg/L was only 3.35 μmol/m2/s. Net photosynthesis rate was negatively related to proline (r2 = -0.909; p ≤ 0.01), MDA (r2 = -0.922; p ≤ 0.01), soluble sugar (r2 = -0.740; p ≤ 0.01), total phenolics content (r2 = -0.846; p ≤ 0.01) and total flavonoids content (r2 = -0.518; p ≤ 0.01; Table 4). This showed that as photosynthesis reduced with high levels of iron oxides, there will be an accumulation of proline, MDA and soluble sugar in oil palm seedlings. High Fe3O4 NPs had shown to decrease the net photosynthesis and accumulate proline, MDA and secondary metabolites production to defend the seedlings for survival. Proline has a strong negative relationship with A (Table 4) as indicated by the high value of correlation coefficient of -0.909. This strong relationship indicates that affected seedlings exhibited low A and increased in proline production by enhancing γ-glutamyl kinase (GK) and decreased in proline oxidase (PROX) activity to promote osmotic potential so that photosynthetic activity maintained [45]. Besides, the sudden decrease in net photosynthesis might cause by stomatal limitation [46] as assessed by the lower values of stomata densities. Similarly, Izad et al. [47] demonstrated that Orthosiphon stamineus have low net photosynthesis when treated with high multi-walled carbon nanotubes application.
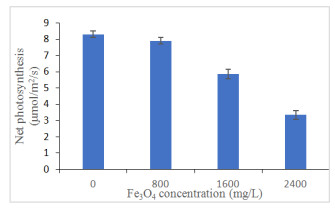
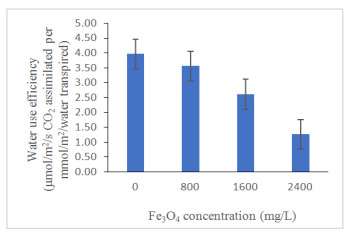
Figure 3 reveals that there has been a gradual decrease in water use efficiency (WUE) (p ≤ 0.05) with increasing Fe3O4 NPs concentration from control although there was no difference between control and 800 mg/L Fe3O4 NPs concentration. This showed the exposure of the plant to high Fe3O4 NPs lowered the WUE as a response to the stress (Table 3). The decreased of WUE in the treatment 800, 1600 and 2400 mg/L were attributed to decrease in net photosynthesis resulting from the significant positive correlation coefficient for A (R2 = 0.657; p ≤ 0.01; Table 4). Izad et al. [47] have the same finding where Orthosiphon stamineus was observed to reduce its water use efficiency and net photosynthesis when treated with high multi-walled carbon nanotubes application. So, it can be concluded that high application of iron oxide would decrease WUE that was observed in the present study.
Intercellular CO2 seemed to be dependent upon Fe3O4 NPs concentration (p ≤ 0.05; Figure 4). Intercellular CO2 was found to be decreased with increasing Fe3O4 NPs concentration. This was also observed in seedlings when 2 and a 3-fold increase in Fe3O4 NPs concentration decreased Ci by 106% and 115% of control, respectively. Intercellular CO2 display a significant positive relationship with A (0.563; p ≤ 0.01; Table 4). Intercellular CO2 is an important parameter in photosynthesis to relate photosynthetic biochemistry with environmental conditions experienced by leaves [48]. Mesophyll cells within leaves consumed CO2 during photosynthetic assimilation (A). The CO2 diffused into the leaf through stomatal pores. Thus, Ci indicates the CO2 substrate available for A [49]. This relationship indicates that low in A was due to decreasing of intercellular CO2 concentration in leaf and limited stomata performance.

Figure 5 shows the fv/fo of oil palm seedling treated with iron oxides. As can be seen, increasing Fe3O4 NPs concentration resulted in a significant decrease in fv/fo (Figure 5; Table 3). The term fv represents the maximum capacity for photochemical quenching while fo indicates emission by excited chlorophyll a molecule in Photosystem Ⅱ. The value of fv/fo was highest in 2400 mg/L (2.00), followed by 1600 mg/L (1.92), 800 mg/L (3.02) and 0 mg/L (3.49). The normal range for fv/fo value is between 4–6, however, the range are depending on the different plant species that adapt to different environments [50]. From the correlation analysis (Table 4), net photosynthesis showed a significant positive relationship with fv/fo (R2 = 0.689; p ≤ 0.01). So, the reduction of fv/fo in the present study indicates the disturbance in photosynthesis with the application of iron oxide. Furthermore, the decrease of fv/fo values may have been caused by the interruption of photosynthesis in the donor part of photosystem l and ll [26]. The interruption may be caused by the excess Fe that disequalize the electron donor and acceptor sides of PSII with the loss of connectivity or grouping between active PSII units [51].

The fv/fm of oil palm seedlings treated with iron oxide was presented in Figure 6. The fv/fm value of oil palm seedlings are likely to decline after the application of Fe3O4 NPs (Figure 6; Table 3). A significant positive relationship was established between fv/fm and A (0.628; p ≤ 0.01; Table 3) which indicate low fv/fm ratio leads to decrease in the net photosynthetic rate of oil palm seedlings as affected by Fe3O4 NPs application. A high value of fv/fm ratio recorded by controlled seedlings was due to high absorption of photon [52]. The term fv reflects maximum capacity for photochemical quenching while fm represents the maximum fluorescence value obtained for continuous light intensity. The fv/fm is an indication for the maximum quantum yield of photosystem ll, which is correlated with a quantum yield of photosynthesis [26] as well as indicate the photoinhibition or other injury caused to the photosystem ll complex [53]. The values are 0.78–0.84 and almost constant for different plants measured under non-stressed conditions [50]. In this study, only 0 mg/L record the values that more than 0.78. However, in the other concentration (700 mg/L, 1400 mg/L and 2100 mg/L) recorded low values which are below than 0.78. The decreased in the values cause the plants stressed when treated with high Fe3O4 NPs concentration. This is because the total amount of light energy transformed in the photosystem ll reaction center was decreased due to the reduction of photochemical activity of photosystem ll and further limit photosynthesis of plant [53].
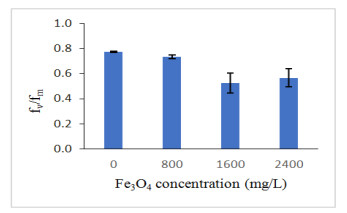
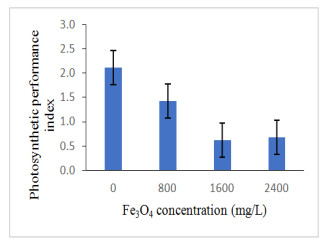
Figure 7 presents the PI of oil palm seedlings treated with iron oxide. Similarly, enhancing Fe3O4 NPs concentration to oil palm seedlings decreased the photosynthetic performance index (p ≤ 0.05; Figure 7; Table 3). The PI act as a sensor to understand plant metabolism, physiology and plant performance [54]. The measurement of this parameter would be able for us, to understand the effect of stress factors in the plant [1]. Iron plays a significant role in redox reactions as well as stabilize the light-harvesting complex subunits and photosynthetic reaction center [55,56]. Past research proved that photosynthetic activity was enhanced due to the improvement of biochemical reactions of thylakoid membranes and chloroplast [57]. High Fe3O4 NPs concentration resulted in excess production of reactive oxygen species (ROS), which damage the structure of cell membrane, DNA and proteins [58,59]. Correlation analysis showed that PI had established a significant positive relationship with net photosynthesis (R2 = 0.558; p≤0.01; Table 4). The decreasing of photosynthetic performance index the present work could be related to the increase of ROS and lowered the net photosynthesis of oil palm seedlings treated under high Fe3O4 NPs concentration.
The change in proline concentration as affected by iron oxide in oil palm seedlings is presented in Figure 8. Proline was enhanced under elevated concentrations of Fe3O4 NPs (Figure 8; Table 3). Specifically, compared with the control group, the proline content in oil palm seedlings leaves exposed to 800, 1600 and 2400 mg/L Fe3O4 NPs were increased by 21.62%, 43.4% and 54.53%, respectively. These results are similar to those reported by Soliman et al. [60] where they found that Moringa peregrina produces high proline when exposed to foliar application of Fe2O3 NPs. Accumulation of proline in the leaves measures the stress level on plants [61] by acting as a metal chelator, signalling and antioxidative defence molecule [60]. Besides, proline plays an important role in osmotic adjustment and removal of excess ROS [62]. The current results proved that elevated production of proline occurred to improve stress tolerance of oil palm seedlings towards high Fe3O4 NPs application.

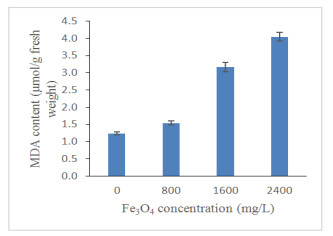
A significant increment in the level of MDA was observed after exposure to 800, 1600 and 2400 mg/L Fe3O4 NPs as compared to the control (Figure 9). At 1600 and 2400 mg/L, MDA content was significantly increased by 60.85% and 69.29%, respectively (Table 3). Malondialdehyde was commonly used as a biomarker for oxidative stress [63]. Results showed as Fe3O4 NPs concentration increased, the oxidative stress of oil palm seedlings were enhanced. Production of MDA has established a positive correlation with total phenolics and total flavonoids (Phenolics; R2 = 0.879 and Flavonoids; R2 = 0.639; p ≤ 0.01; Table 4) which indicated that increase in MDA responsible for up-regulation of the secondary metabolites production under high Fe3O4 NPs concentration. Plants that experienced high biotic stress level will increase the MDA production which also increased the lipid peroxidation since MDA was considered as a measure of lipid peroxidation [64]. Increased lipid peroxidation enhance hydrogen peroxide (H2O2) which act as a signal for the induction of plant defense systems and this could elevate secondary metabolites production [65]. What is striking in Table 4 is the significant positive correlation of MDA and proline (R2 = 0.955; p ≤ 0.01) which suggests that the proline and lipid peroxidation mechanism is known to be associated with a stress defence mechanism. However, contradicting results were showed by Palmqvis et al. [66], where Brassica napus treated with γ-Fe2O3 NPs produce low H2O2 and MDA contents. Similar findings obtained by Rui et al. [67] where the MDA content in leaves was reduced under γ-Fe2O3 treatment (10 mg/kg) and no oxidative stress was triggered.
The soluble sugar patterns of oil palm seedlings treated with iron oxide was presented in Figure 10. Total soluble sugar was significantly influenced by the treatments of Fe3O4 NPs (p ≤ 0.05; Figure 10; Table 3). Total soluble sugar was significantly increased by 56% in both 1600 and 2400 mg/L Fe3O4 NPs from the control seedlings. As it can be seen in Table 4, total soluble sugar has a positive relationship with the production of secondary plant metabolites (Phenolics; R2 = 0.746 and Flavonoids; R2 = 0.548; p ≤ 0.01). Increased in soluble sugar responsible for increasing secondary metabolites productions in plants [68]. The results are similar to that found in Guo et al. [69] where they found that increase in production of total phenolics of broccoli sprouts corresponded with the enhanced sucrose content. The increment sugar level could improve anthers tolerance during biotic stress by protecting oxidant damage Nguyen et al. [70]. So, it can be concluded that the production of soluble sugar was spiked under high application of iron oxide.

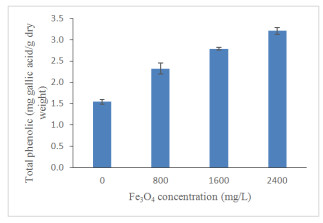
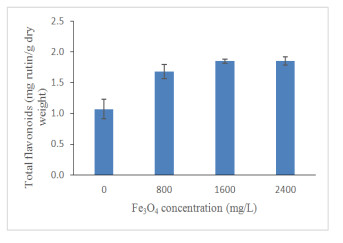
High Fe3O4 NPs concentration significantly (p ≤ 0.05; Figure 11; Table 3) increased total phenolics content (TPC) of oil palm seedlings. Total phenolics content has been increased gradually by 34%, 45% and 52% under 800, 1600 and 2400 mg/L Fe3O4 NPs treatments, respectively, compared to the control. Biotic and abiotic factors are known to influence the concentration of polyphenols [71]. Plants that were exposed to environmental stress produced phenolic compounds that are responsible for plants growing to survive [72]. Phenolic compounds have antibiotic, anti-nutritional properties and high antioxidant activity, which enable them to defend plants Lattanzio et al. [73]. It is now understood that a high concentration of Fe3O4 NPs has a significant impact on the production of high total phenolics to defend the oil palm seedlings from any further damage. Apart from Fe3O4 NPs, the study carried out by Ghorbanpour and Hadian [74] proved that the optimum use of multi-walled carbon nanotubes nanoparticles (MWCNTs NPs) has a positive effect on the biosynthesis of phenolics and flavonoids in callus culture of Satureja khuzestanica due to the activation of specific key enzymes. A recent study conducted by Izad et al. [47] has confirmed that high MWCNTs NPs application increased the total phenolics content of Orthosiphon stamineus significantly. Similar to total phenolics, Fe3O4 NPs significantly enhanced total flavonoids contents (TFC) in oil palm seedlings (Figure 12). A slight increased for the TCC in seedlings treated with 2400 mg/L compared to 1600 mg/L Fe3O4 NPs. The enhancement of plant secondary metabolites may have contributed to the increment of total soluble sugar as exhibited by the correlation coefficient (R2 = 0.548, p ≤ 0.01; Table 4) which indicate that soluble sugar accumulation has been an important factor in the increase of plant secondary metabolites.
Nanomaterials can give rise to reactive oxygen species (ROS) production, thereby damaging the DNA and proteins [75] by reacting non-specifically with lipids, proteins and nucleic acids [25]. The production of flavonoids may scavenge ROS [76,77,78] to minimize ROS that harmful to cell structures, membranes and the photosynthetic apparatus [79]. This suggests that oil palm seedlings produce more flavonoids to reduce the effects of increasing ROS produced by high Fe3O4 NPs concentration. The other nanomaterial (multi-walled carbon nanotubes) have been proved by Izad et al. [47] to reduce total flavonoids production in Orthosiphon stamineus under high concentration treatment.
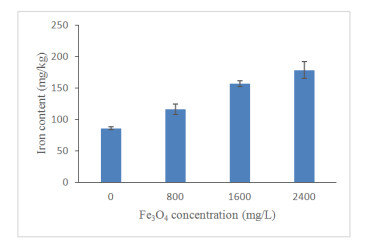
The uptake of iron elements by the treated plants was confirmed by the determination of iron content in the leaves (Figure 13). The results obtained showed that the addition of Fe3O4 NPs significantly influenced the level of iron content in plant tissues (Table 3). In comparison to the control group, the highest Fe3O4 NPs concentration significantly increased the iron content in leaves by 52%. Plants that were not treated with Fe3O4 NPs contained the lowest iron content in its leaf tissues. Table 3 reveals that iron content has a significant negative relationship with the net photosynthesis, intercellular CO2 and photosynthetic performance index. The increasing of iron content caused the decreasing of photosynthetic activities of treated plants, which agreed with the findings by Adamski et al. [80] that proved high iron concentration decreased the net photosynthesis of sweet potato plants. In general, iron is a micronutrient that plays a vital role in photosynthetic activity to sustain the growth and development of plants [81]. Most of the iron (80%) was located in the photosynthetic cells for the biosynthesis of chlorophyll and cytochromes [82]. However, excess iron content (above 500 g) is considered toxic for plant cells [83] and affect photosynthetic activities of higher plants [84]. This is because, excess iron leads to changes in stomatal movement [82], lowered the chlorophyll content [85] and reduced the photosynthetic pigments [86]. Besides, iron in excess will generate oxidative stress in chloroplasts [87] and produce reactive oxygen species (ROS) [88] which caused changes in physiology and biochemical properties of plants by damaging the cellular components [89]. A high concentration of Fe may cause disorder of active PSII units and thylakoids membrane structure [90].
The current study was performed to assess the toxicity impact of the application of Fe3O4 NPs on oil palm seedling growth, leaf gas exchange and biochemical responses. The oil palm seedlings were grown in soil and treated with different Fe3O4 NPs concentration (0,800, 1600 and 2400 mg/L). It was found that the oil palm seedlings growth was not affected by the application of iron oxide. As iron oxide concentration increased to 1200 mg/L, the reduction in chlorophyll, stomatal density leaf gas exchange and chlorophyll fluorescence was observed. As the application of iron oxide increased from 0 to 2100 mg/L, the production of soluble sugar, proline and lipid peroxidation was enhanced indicating that application of would trigger stress response to the plant. Furthermore, the production of secondary metabolites (total phenolics and total flavonoids) was upregulated as iron oxide concentration increased from 0 to 2100 mg/L indicate that plant defence system was enhanced to reduce system from any further damage. The increment of Fe3O4 NPs concentration decreased the fv/fo as well as fv/fm, indicate that the Fe3O4 NPs able to disorganize the photosynthetic apparatus and contributed to the disruption of the photosynthetic process. The result obtained from this study has laid an important platform to describe the interaction effect of iron oxide nanomaterials with oil palm seedlings.
The authors have expressed gratitude to the Ministry of Higher Education Malaysia for their financial support through FRGS Grant no. FRGS/1/2016/STG03/UPM/02/6/5524945.
The authors declare no conflict of interest.
| [1] |
Rastogi A, Zivcak M, Sytar O, et al. (2017) Impact of metal and metal oxide nanoparticles on plant: a critical review. Front Chem 5: 78. doi: 10.3389/fchem.2017.00078

|
| [2] |
Etheridge ML, Campbell SA, Erdman AG, et al. (2013) The big picture on nanomedicine: the state of investigational and approved nanomedicine products. Nanomed: Nanotechnol, Biol Med 9: 1-14. doi: 10.1016/j.nano.2012.05.013
|
| [3] |
Roco MC (2005) International perspective on government nanotechnology funding in 2005. J Nanopart Res 7: 707-712. doi: 10.1007/s11051-005-3141-5
|
| [4] |
Maynard AD, Aitken RJ, Butz T, et al. (2006) Safe handling of nanotechnology. Nature 444: 267-269. doi: 10.1038/444267a
|
| [5] |
Faraji M, Yamini Y, Rezaee M (2010) Magnetic nanoparticles: synthesis, stabilization, functionalization, characterization, and applications. J Iran Chem Soc 7: 1-37. doi: 10.1007/BF03245856
|
| [6] | Nidhin M, Indumathy R, Sreeram KJ, et al. (2008) Synthesis of iron oxide nanoparticles of narrow size distribution on polysaccharide templates. Bull Mater Sci 31: 93-96. |
| [7] |
Xu Y, Qin Y, Palchoudhury S, et al. (2011) Water-soluble iron oxide nanoparticles with high stability and selective surface functionality. Langmuir 27: 8990-8997. doi: 10.1021/la201652h
|
| [8] | Scott N, Chen H (2012) Nanoscale science and engineering for agriculture and food systems. Ind Biotechnol 8: 340-343. |
| [9] |
Rizwan M, Ali S, Ali B, et al. (2019) Zinc and iron oxide nanoparticles improved the plant growth and reduced the oxidative stress and cadmium concentration in wheat. Chemosphere 214: 269-277. doi: 10.1016/j.chemosphere.2018.09.120
|
| [10] | Zareii FD, Roozbahani A, Hosnamidi A (2014) Evaluation the effect of water stress and foliar application of Fe nanoparticles on yield, yield components and oil percentage of safflower (Carthamus tinctorious L.). Int J Adv Biol Biom Res 2: 1150-1159. |
| [11] |
Vasconcelos MW, Grusak MA (2014) Morpho-physiological parameters affecting iron deficiency chlorosis in soybean (Glycine max L.). Plant Soil 374: 161-172. doi: 10.1007/s11104-013-1842-6
|
| [12] | Rui M, Ma C, Hao Y, et al. (2016) Iron oxide nanoparticles as a potential iron fertilizer for peanut (Arachis hypogaea). Front Plant Sci 7: 815. |
| [13] | Kavian B. Negahdar, Ghaziani MVF (2014) The effect of iron nano-chelate and cycocel on some morphological and physiological characteristics, proliferation and enhancing the quality of Euphorbia pulcherrima Willd. Sci Pap Ser B Hortic 58: 337-342. |
| [14] |
Bombin S, LeFebvre M, Sherwood J, et al. (2015) Developmental and reproductive effects of iron oxide nanoparticles in Arabidopsis thaliana. Int J Mol Sci 16: 24174-24193. doi: 10.3390/ijms161024174
|
| [15] |
Antisari LV, Carbone S, Gatti A, et al. (2015) Uptake and translocation of metals and nutrients in tomato grown in soil polluted with metal oxide (CeO2, Fe3O4, SnO2, TiO2) or metallic (Ag, Co, Ni) engineered nanoparticles. Environ Sci Pollut Res 22: 1841-1853. doi: 10.1007/s11356-014-3509-0
|
| [16] |
El-Temsah YS, Joner EJ (2012) Impact of Fe and Ag nanoparticles on seed germination and differences in bioavailability during exposure in aqueous suspension and soil. Environ Toxicol 27: 42-49. doi: 10.1002/tox.20610
|
| [17] |
Ren HX, Liu L, Liu C, et al. (2011) Physiological investigation of magnetic iron oxide nanoparticles towards Chinese mung bean. J Biomed Nanotechnol 7: 677-684. doi: 10.1166/jbn.2011.1338
|
| [18] |
Kim JH, Lee Y, Kim EJ. et al. (2014). Exposure of iron nanoparticles to Arabidopsis thaliana enhances root elongation by triggering cell wall loosening. Environ Sci Technol 48: 3477-3485. doi: 10.1021/es4043462
|
| [19] |
García A, Espinosa R, Delgado L, et al. (2011) Acute toxicity of cerium oxide, titanium oxide and iron oxide nanoparticles using standardized tests. Desalination 269: 136-141. doi: 10.1016/j.desal.2010.10.052
|
| [20] | Trujillo-Reyes J, Majumdar S, Botez CE, et al. (2014) Exposure studies of core-shell Fe/Fe3O4 and Cu/CuO NPs to lettuce (Lactuca sativa) plants: are they a potential physiological and nutritional hazard? J Hazard Mater 267: 255-263. |
| [21] | Popova LV, Popkova EG, Dubova YI, et al. (2016) Financial mechanisms of nanotechnology development in developing countries. J Appl Econ Sci 11: 584-590. |
| [22] | Bottero JY, Auffan M, Borschnek D, et al. (2015) Nanotechnology, global development in the frame of environmental risk forecasting. A necessity of interdisciplinary researches. C R Geosci 347: 35-42. |
| [23] |
Ma X, Geisler-Lee J, Deng Y, et al. (2010) Interactions between engineered nanoparticles (ENPs) and plants: phytotoxicity, uptake and accumulation. Sci Total Environ 408: 3053-3061. doi: 10.1016/j.scitotenv.2010.03.031
|
| [24] |
Maxwell K, Johnson GN (2000) Chlorophyll fluorescence-a practical guide. J Exp Bot 51: 659-668. doi: 10.1093/jexbot/51.345.659
|
| [25] |
Hayat S, Hayat Q, Alyemeni MN, et al. (2012) Role of proline under changing environments: a review. Plant Signaling Behav 7: 1456-1466. doi: 10.4161/psb.21949
|
| [26] |
Zain N, Ismail M, Mahmood M, et al. (2014) Alleviation of water stress effects on MR220 rice by application of periodical water stress and potassium fertilization. Molecules 19: 1795-1819. doi: 10.3390/molecules19021795
|
| [27] |
Kong W, Liu F, Zhang C, et al. (2016) Non-destructive determination of Malondialdehyde (MDA) distribution in oilseed rape leaves by laboratory scale NIR hyperspectral imaging. Sci Rep 6: 35393. doi: 10.1038/srep35393
|
| [28] |
Ibrahim MH, Jaafar HZE (2012) Reduced photoinhibition under low irradiance enhanced Kacip fatimah (Labisia pumila Benth) secondary metabolites, phenyl alanine lyase and antioxidant activity. Int J Mol Sci 13: 5290-5306. doi: 10.3390/ijms13055290
|
| [29] | Ibrahim MH, Jaafar HZE, Rahmat A, et al. (2011) The relationship between phenolics and flavonoids production with total non-structural carbohydrate and photosynthetic rate in Labisia pumila Benth. Under high CO2 and nitrogen fertilization. Molecules 16: 162-174. |
| [30] | Baskar V, Venkatesh R, Ramalingam S (2018) Flavonoids (antioxidants systems) in higher plants and their response to stresses, In: Gupta DK, Palma JM, Corpas FJ, Antioxidants and antioxidant enzymes in higher plants, New York: Springer, 253-268. |
| [31] | Ibrahim MH, Jaafar HZE (2012) Primary, secondary metabolites, H2O2, malondialdehyde and photosynthetic responses of Orthosiphon stamineus Benth. To different irradiance levels. Molecules 17:1159-1176. |
| [32] |
Bienfait HF, van den Briel W. Mesland-Mul NT (1985) Free space iron pools in roots: generation and mobilization. Plant Physiol 78: 596-600. doi: 10.1104/pp.78.3.596
|
| [33] | Corley RHV, Tinker PBH (2003) Mineral nutrition of oil palms, In: The Oil Palm, 4 Eds., Blackwell Science, 327-354. |
| [34] | Iannone MF, Groppa MD, de Sousa ME, et al. (2016) Impact of magnetite iron oxide nanoparticles on wheat (Triticum aestivum L.) development: evaluation of oxidative damage. Environ Exp Bot 131: 77-88. |
| [35] | Ghafariyan MH, Malakouti MJ, Dadpour MR, et al. (2013) Effects of magnetite nanoparticles on soybean chlorophyll. Environ Sci Technol 47: 10645-10652. |
| [36] | Vasconcelos MW, Grusak MA (2014) Morpho-physiological parameters affecting iron deficiency chlorosis in soybean (Glycine max L.). Plant Soil 374 : 161-172. |
| [37] | Mukherjee A, Peralta-Videa JR. Bandyopadhyay S, et al. (2014) Physiological effects of nanoparticulate ZnO in green peas (Pisum sativum L.) cultivated in soil. Metallomics 6: 132-138. |
| [38] |
Ma J, Stiller J, Berkman PJ, et al. (2013) Sequence-based analysis of translocations and inversions in bread wheat (Triticum aestivum L.). PloS one 8: e79329. doi: 10.1371/journal.pone.0079329
|
| [39] |
Nair PMG, Chung IM (2014) Impact of copper oxide nanoparticles exposure on Arabidopsis thaliana growth, root system development, root lignificaion, and molecular level changes. Environ Sci Pollut Res 21: 12709-12722. doi: 10.1007/s11356-014-3210-3
|
| [40] |
Servin AD, Morales MI, Castillo-Michel H, et al. (2013) Synchrotron verification of TiO2 accumulation in cucumber fruit: a possible pathway of TiO2 nanoparticle transfer from soil into the food chain. Environ Sci Technol 47: 11592-11598. doi: 10.1021/es403368j
|
| [41] |
Jacob DL, Borchardt JD, Navaratnam L, et al. (2013) Uptake and translocation of Ti from nanoparticles in crops and wetland plants. Int J Phytorem 15: 142-153. doi: 10.1080/15226514.2012.683209
|
| [42] |
Ainsworth EA, Rogers A (2007) The response of photosynthesis and stomatal conductance to rising [CO2]: mechanisms and environmental interactions. Plant, Cell Environ 30: 258-270. doi: 10.1111/j.1365-3040.2007.01641.x
|
| [43] |
Schlüter U, Muschak M, Berger D, et al. (2003) Photosynthetic performance of an Arabidopsis mutant with elevated stomatal density (sdd1-1) under different light regimes. J Exp Bot 54: 867-874. doi: 10.1093/jxb/erg087
|
| [44] |
Xu Z, Zhou G (2008) Responses of leaf stomatal density to water status and its relationship with photosynthesis in a grass. J Exp Bot 59: 3317-3325. doi: 10.1093/jxb/ern185
|
| [45] |
Khan MIR, Iqbal N, Masood A, et al. (2013) Salicylic acid alleviates adverse effects of heat stress on photosynthesis through changes in proline production and ethylene formation. Plant Signaling Behav 8: e26374. doi: 10.4161/psb.26374
|
| [46] |
Urrego-Pereira YF, Martínez-Cob A, Fernández V, et al. (2013) Daytime sprinkler irrigation effects on net photosynthesis of maize and alfalfa. Agron J 105: 1515-1528. doi: 10.2134/agronj2013.0119
|
| [47] | Izad AI, Ibrahim MH, Abdullah CAC, et al. (2018) Growth, leaf gas exchange and secondary metabolites of Orthosiphon stamineus as affected by multiwall carbon nanotubes application. Annu Res Rev Biol 23: 1-13. |
| [48] |
Hanson DT, Stutz SS, Boyer JS (2016) Why small fluxes matter: the case and approaches for improving measurements of photosynthesis and (photo) respiration. J Exp Bot 67: 3027-3039. doi: 10.1093/jxb/erw139
|
| [49] |
Farquhar GD, von Caemmerer S, Berry JA (1980) A biochemical model of photosynthetic CO2 assimilation in leaves of C3 species. Planta 149: 78-90. doi: 10.1007/BF00386231
|
| [50] | Sikuku PA, Netondo GW, Onyango JC, et al. (2010) Chlorophyll fluorescence, protein and chlorophyll content of three rainfed rice varieties under varying irrigation regimes. J Agric Biol Sci 5: 19-25. |
| [51] |
Strasser RJ, Stirbet AD (1998) Heterogeneity of photosystem Ⅱ probed by the numerically simulated chlorophyll a fluorescence rise (O-J-I-P). Math Comput Simulat 48: 3-9. doi: 10.1016/S0378-4754(98)00150-5
|
| [52] |
Peterson RB, Havir EA (2003) Contrasting modes of regulation of PS Ⅱ light utilization with changing irradiance in normal and psbS mutant leaves of Arabidopsis thaliana. Photosynth Res 75: 57-70. doi: 10.1023/A:1022458719949
|
| [53] |
Tezera W, Mitchell V, Driscoll SP, et al. (2002) Effects of water deficit and its interaction with CO2 supply on the biochemistry and physiology of photosynthesis in sunflower. J Exp Bot 53: 1781-1791. doi: 10.1093/jxb/erf021
|
| [54] |
Kalaji HM, Oukarroum A, Alexandrov V, et al. (2014) Identification of nutrient deficiency in maize and tomato plants by in vivo chlorophyll a fluorescence measurements. Plant Physiol Biochem 81: 16-25. doi: 10.1016/j.plaphy.2014.03.029
|
| [55] |
Msilini N, Zaghdoudi M, Govindachary S, et al. (2011) Inhibition of photosynthetic oxygen evolution and electron transfer from the quinone acceptor QA to QB by iron deficiency. Photosynth Res 107: 247-256. doi: 10.1007/s11120-011-9628-2
|
| [56] |
Yadavalli V, Neelam S, Rao ASVC, et al. (2012) Differential degradation of photosystem I subunits under iron deficiency in rice. J Plant Physiol 169: 753-759. doi: 10.1016/j.jplph.2012.02.008
|
| [57] |
Barhoumi N, Labiadh L, Oturan MA, et al. (2015) Electrochemical mineralization of the antibiotic levofloxacin by electro-Fenton-pyrite process. Chemosphere 141: 250-257. doi: 10.1016/j.chemosphere.2015.08.003
|
| [58] | Kobayashi T, Nishizawa NK (2012) Iron uptake, translocation, and regulation in higher plants. Annu Rev Plant Biol 63: 131-152. |
| [59] | Briat JF, Ravet K, Arnaud N, et al. (2009) New insights into ferritin synthesis and function highlight a link between iron homeostasis and oxidative stress in plants. Ann Bot 105: 811-822. |
| [60] |
Soliman AS, El-feky SA, Darwish E (2015) Alleviation of salt stress on Moringa peregrina using foliar application of nanofertilizers. J Hort For 7: 36-47. doi: 10.5897/JHF2014.0379
|
| [61] |
Yoshida Y, Kioyoshue T, Katagiri T. et al. (1995) Correlation between the induction of a gene for Δ1-pyrroline-5-carboxylate synthase and the accumulation of proline in Arabidopsis thaliana under osmotic stress. Plant J 7: 751-760. doi: 10.1046/j.1365-313X.1995.07050751.x
|
| [62] |
Hayat S, Hayat Q, Alyemeni MN, et al. (2012) Role of proline under changing environments: a review. Plant Signaling Behav 7: 1456-1466. doi: 10.4161/psb.21949
|
| [63] |
Jaafar HZ, Ibrahim MH, Fakri M, et al. (2012) Impact of soil field water capacity on secondary metabolites, phenylalanine ammonia-lyase (PAL), maliondialdehyde (MDA) and photosynthetic responses of Malaysian Kacip Fatimah (Labisia pumila Benth). Molecules 17: 7305-7322. doi: 10.3390/molecules17067305
|
| [64] |
Jones CG, Hartley SE (1999) A protein competition model of phenolic allocation. Oikos 86: 27-44. doi: 10.2307/3546567
|
| [65] |
Bharti AK, Khurana JP (2003) Molecular characterization of transparent testa (tt) mutants of Arabidopsis thaliana (ecoype Estland) impaired in flavonoid biosynthesic pathway. Plant Sci 165: 1321-1332. doi: 10.1016/S0168-9452(03)00344-3
|
| [66] |
Palmqvis NGM, Seisenbaeva GA, Svedlindh P, et al. (2017) Maghemite nanoparticles acts as nanozymes, improving growth and abiotic stress tolerance in Brassica napus. Nanoscale Res Lett 12: 631. doi: 10.1186/s11671-017-2404-2
|
| [67] | Rui M, Ma C, Hao Y, et al. (2016) Iron oxide nanoparticles as a potential iron fertilizer for peanut (Arachis hypogaea). Front Plant Sci 7: 815. |
| [68] |
Ghasemzadeh A, Jaafar HZE, Rahmat A (2010) Antioxidant activities, total phenolics and flavonoids content in two varieties of malaysia young ginger (Zingiber officinale Roscoe). Molecules 15: 4324-4333. doi: 10.3390/molecules15064324
|
| [69] |
Guo R, Yuan G, Wang Q (2011) Effect of sucrose and mannitol on the accumulation of health-promoting compounds and the activity of metabolic enzymes in broccoli sprouts. Sci Hort 128: 159-165. doi: 10.1016/j.scienta.2011.01.014
|
| [70] |
Nguyen GN, Hailstones DL, Wilkes M, et al. (2010) Drought stress: role of carbohydrate metabolism in drought-induced male sterility in rice anthers. J Agron Crop Sci 196: 346-357. doi: 10.1111/j.1439-037X.2010.00423.x
|
| [71] |
Akula R, Ravishanka GA (2011) Influence of abiotic stress signals on secondary metabolites in plants. Plant Signaling Behav 6: 1720-1731. doi: 10.4161/psb.6.11.17613
|
| [72] | Kubalt K (2016) The role of phenolic compounds in plant resistance. Biotechnol Food Sci 80: 97-108. |
| [73] | Lattanzio V, Lattanzio VMT, Cardinali A (2006) Role of phenolics in the resistance mechanisms of plants against fungal pathogens and insects. Phytochem: Adv in Res 661: 23-67. |
| [74] |
Ghorbanpour M, Hadian J (2015) Multi-walled carbon nanotubes stimulate callus induction, secondary metabolites biosynthesis and antioxidant capacity in medicinal plant Satureja khuzestanica grown in vitro. Carbon 94: 749-759. doi: 10.1016/j.carbon.2015.07.056
|
| [75] |
Moore MN (2006) Do nanoparticles present ecotoxicological risks for the health of the aquatic environment? Environ Int 32: 967-976. doi: 10.1016/j.envint.2006.06.014
|
| [76] | Chinnamuthu CR, Boopathi PM (2009) Nanotechnology and agroecosystem. Madras Agric J 96: 17-31. |
| [77] |
Kanazawa K, Hashimoto T, Yoshida S, et al. (2012) Short photoirradiation induces flavonoid synthesis and increases its production in postharvest vegetables. J Agri Food Chem 60: 4359-4368. doi: 10.1021/jf300107s
|
| [78] | Xie Y, Xu D, Cui W, et al. (2012) Mutation of Arabidopsis HY1 causes UV-C hypersensitivity by impairing carotenoid and flavonoid biosynthesis and the down-regulation of antioxidant defence. J ExpBotany 63: 3869-3883. |
| [79] | Kefeli VI, Kalevitch MV, Borsari B (2003) Phenolic cycle in plants and environment. J Cell Mol Biol 2: 13-18. |
| [80] | Adamski JM, Peters JA, Danieloski R, et al. (2011) Excess iron-induced changes in the photosynthetic characteristics of sweet potato. J Plant Physiol 168: 2056-2062. |
| [81] |
Hänsch R, Mendel RR (2009) Physiological functions of mineral micronutrients (Cu, Zn, Mn, Fe, Ni, Mo, B, Cl). Curr Opin Plant Biol 12: 259-266. doi: 10.1016/j.pbi.2009.05.006
|
| [82] |
Briat JF, Curie C, Gaymard F (2007) Iron utilization and metabolism in plants. Curr Opin Plant Biol 10: 276-282. doi: 10.1016/j.pbi.2007.04.003
|
| [83] |
Kobayashi T, Nozoye T, Nishizawa NK (2019) Iron transport and its regulation in plants. Free Radical Biol Med 133: 11-20. doi: 10.1016/j.freeradbiomed.2018.10.439
|
| [84] |
Nenova VR (2009) Growth and photosynthesis of pea plants under different iron supply. Acta Physiol Plant 31: 385. doi: 10.1007/s11738-008-0247-2
|
| [85] | Chatterjee C, Gopal R, Dube BK (2006) Impact of iron stress on biomass, yield, metabolism and quality of potato (Solanum tuberosum L.). Sci Hortic 108: 1-6. |
| [86] | Xing W, Huang WM, Liu GH (2010) Effect of excess iron and copper on physiology of aquatic plant Spirodela polyrrhiza (L.) Schleid. Environ Toxicol 25: 103-112. |
| [87] | Prasad MNV, Strzalka K (1999) Impact of heavy metals on photosynthesis. In: Prasad MNV, Hagemeyer J, Heavy Metal stress in Plants: from Molecules to Ecosystems. Berlin-Heidelberg: Springer Verlag, 117-138. |
| [88] |
Robello E, Galatro A, Puntarulo S (2007) Iron role in oxidative metabolism of soybean axes upon growth: effect of iron overload. Plant Sci 172: 939-947. doi: 10.1016/j.plantsci.2007.01.003
|
| [89] |
Fang WC, Wang JW, Lin CC, et al. (2001) Iron induction of lipid peroxidation and effects on antioxidative enzyme activities in rice leaves. Plant Growth Regul 35: 75-80. doi: 10.1023/A:1013879019368
|
| [90] | Yin XL, Wang JX, Duan ZQ, et al. (2006) Study on the stomatal density and daily change rule of the wheat. Chin Agric Sci Bull 22: 237-242. |
| 1. | Paula Ballikaya, John Marshall, Paolo Cherubini, Can tree-ring chemistry be used to monitor atmospheric nanoparticle contamination over time?, 2022, 268, 13522310, 118781, 10.1016/j.atmosenv.2021.118781 | |
| 2. | Francisca Frenna Verezza Rodrigues de Amorim, William Natale, Carlos Alberto Kenji Taniguchi, Luiz Augusto Lopes Serrano, Márcio Cleber de Medeiros Corrêa, Adriana Guirado Artur, Iron doses on growth and gas exchange of dwarf cashew seedlings, 2022, 0190-4167, 1, 10.1080/01904167.2022.2155532 | |
| 3. | Amani Gabriel Kaningini, Thobo Motlhalamme, Karen Jacqueline Cloete, Garland Kgosi More, Keletso Cecilia Mohale, Malik Maaza, Fe2O3 nanoparticles from Athrixia phylicoides DC and their effect on Cicer arietinum L. growth performance, 2023, 54, 18788181, 102948, 10.1016/j.bcab.2023.102948 | |
| 4. | Kedi Li, Asad Rehman, Saeed ur Rahman, Farwa Basit, Xinxin Liu, Aloysius Wong, Khulood Fahad Alabbosh, Haoxiang Li, Nan Hui, Muhammad Khalid, Interplay between green-synthesized nanoparticles and plant performance is mediated by the microbial community in the rhizocompartments, 2024, 215, 09266690, 118623, 10.1016/j.indcrop.2024.118623 |
Figures(13) / Tables(4)

Ayu Azera Izad, Rosimah Nulit, Che Azurahanim Che Abdullah, A'fifah Abdul Razak, Teh Huey Fang, Mohd Hafiz Ibrahim. Growth, leaf gas exchange and biochemical changes of oil palm (Elaeis guineensis Jacq.) seedlings as affected by iron oxide nanoparticles[J]. AIMS Materials Science, 2019, 6(6): 960-984. doi: 10.3934/matersci.2019.6.960

| Microclimate parameters | Quantification |
| Relative humidity | 56.17–68.21% |
| Light intensity | 210–1780 µmol/m2/s |
| Day temperature | 30–34 ℃ |
| Night temperature | 17–24 ℃ |
| Ambient CO2 | 388.70 µmol/mol |
DownLoad:
CSV
| Iron oxide (mg/L) | Height (cm) | Diameter (mm) | Total biomass (g) | Leaf number | Total chlorophyll content (TCC) |
| 0 | 41.84 ± 1.10a | 17.67 ± 0.57a | 8.32 ± 0.38a | 6.44 ± 0.18a | 49.39 ± 0.93a |
| 800 | 41.47 ± 1.39a | 16.78 ± 0.41a | 8.22 ± 0.37a | 7.11 ± 0.20a | 52.73 ± 1.06b |
| 1600 | 40.30 ± 1.11a | 16.77 ± 0.56a | 8.29 ± 0.48a | 6.89 ± 0.26a | 44.59 ± 1.33c |
| 2400 | 40.41 ± 0.80a | 17.37 ± 0.27a | 8.41 ± 0.37a | 6.78 ± 0.22a | 41.33 ± 2.59d |
DownLoad:
CSV
| S. Variation | Iron oxide | Blocks | Interaction |
| PH | ns | ns | ns |
| D | ns | ns | ns |
| T.B | ns | ns | ns |
| LN | ns | ns | ns |
| TCC | *** | ns | * |
| Adaxial | * | ns | ns |
| Abaxial | ** | ns | ns |
| T.S | ** | ns | ns |
| A | *** | ns | ns |
| WUE | * | ns | ns |
| Ci | ** | * | ns |
| fv/fm | ** | ns | ns |
| fv/fo | ** | ns | ns |
| PI | *** | ns | ns |
| Proline | *** | ns | ns |
| MDA | *** | ns | ns |
| Sugar | *** | ** | ns |
| TPC | *** | ns | ns |
| TFC | *** | ns | ns |
| Iron | *** | ns | ns |
| *Note: PH= plant height; D = Diameter; T.B = total biomass; LN = number of leaf; TCC = total chlorophyll content; Adaxial = adaxial stomata densities; Abaxial = abaxial stomata densities; T.S = Total stomata densities; A = net photosynthesis; WUE = water use efficiency; Ci = intercellular CO2; fv/fm = maximum efficiency of photosystem Ⅱ; fv/fo = maximum quantum yield of photochemical and non-photochemical process in photosystem Ⅱ; PI = photosynthetic performance index; Proline = proline content; MDA = malondialdehyde; Sugar = soluble sugar; TPC = total phenolics content; TFC = total flavonoids content; Iron = iron content. *, **, ***, significant at p ≤ 0.05, 0.01, 0.001, respectively; ns = not significant. | |||
DownLoad:
CSV
| Parameters | Biomass | Leaf_no | Diameter | Height | Tcc | Adaxial | Abaxial | TS | A | WUE | Ci | fv/fm | fv/fo | PI | Proline | MDA | Sugar | TPC | TFC | Iron |
| Biomass | 1 | |||||||||||||||||||
| Leaf_no | 0.236 | 1 | ||||||||||||||||||
| Diameter | 0.590** | 0.122 | 1 | |||||||||||||||||
| Height | 0.605** | -0.044 | 0.394* | 1 | ||||||||||||||||
| TCC | 0.019 | 0.145 | -0.059 | 0.212 | 1 | |||||||||||||||
| Adaxial | 0.319 | 0.000 | 0.197 | 0.073 | 0.061 | 1 | ||||||||||||||
| Abaxial | 0.261 | 0.153 | 0.211 | -0.074 | 0.094 | 0.486* | 1 | |||||||||||||
| T.S | 0.333 | 0.097 | 0.237 | -0.009 | 0.091 | 0.832** | 0.889** | 1 | ||||||||||||
| A | -0.032 | -0.206 | 0.174 | 0.224 | 0.395 | 0.288 | 0.197 | 0.276 | 1 | |||||||||||
| WUE | -0.146 | -0.351 | -0.213 | 0.136 | 0.158 | 0.213 | 0.162 | 0.214 | 0.657** | 1 | ||||||||||
| Ci | 0.198 | -0.127 | 0.434* | 0.095 | 0.156 | 0.245 | 0.164 | 0.232 | 0.563** | -0.069 | 1 | |||||||||
| fv/fm | -0.005 | 0.008 | -0.162 | -0.007 | 0.671** | 0.198 | 0.313 | 0.302 | 0.628** | 0.361 | 0.410* | 1 | ||||||||
| fv/fo | -0.075 | -0.057 | -0.110 | -0.029 | 0.705** | 0.165 | 0.253 | 0.247 | 0.689** | 0.415* | 0.456* | 0.968** | 1 | |||||||
| PI | -0.002 | 0.064 | 0.139 | 0.057 | 0.658** | -0.077 | 0.121 | 0.037 | 0.558** | 0.176 | 0.501* | 0.677** | 0.797** | 1 | ||||||
| Proline | 0.088 | 0.328 | -0.172 | -0.156 | -0.389 | -0.309 | -0.228 | -0.306 | -0.909** | -0.555** | -0.701** | -0.658** | -0.736** | -0.592** | 1 | |||||
| MDA | -0.054 | 0.260 | -0.224 | -0.172 | -0.378 | -0.415* | -0.219 | -0.356 | -0.922** | -0.523** | -0.712** | -0.646** | -0.709** | -0.560** | 0.955** | 1 | ||||
| Sugar | 0.097 | 0.424* | -0.176 | -0.121 | -0.103 | -0.186 | 0.099 | -0.034 | -0.740** | -0.434* | -0.593** | -0.343 | -0.452* | -0.408* | 0.797** | 0.844** | 1 | |||
| TPC | -0.013 | 0.320 | -0.172 | -00.126 | -.200 | -0.265 | -0.192 | -0.261 | -0.846** | -0.416* | -0.809** | -0.507* | -0.572** | -0.501* | 0.907** | 0.879** | 0.746** | 1 | ||
| TFC | -0.110 | 0.348 | -0.052 | -0.020 | 0.017 | -0.576** | -0.255 | -0.463* | -0.518** | -0.403 | -0.643** | -0.387 | -0.404 | -0.160 | 0.641** | 0.639** | 0.548** | 0.704** | 1 | |
| Iron | -0.054 | 0.353 | -0.145 | -0.036 | -0.005 | -0.005 | -0.053 | -0.037 | -0.586** | -0.220 | -0.717** | -0.398 | -0.494* | -0.515* | 0.729** | 0.656** | 0.636** | 0.776** | 0.606** | 1 |
| *Note: Significant at p ≤ 0.01. Biomass = total biomass; Leaf_no = number of leaf; Diameter = bole diameter; Height = plant height; TCC = total chlorophyll content; Adaxial = adaxial stomata densities; Abaxial = abaxial stomata densities; T.S = Total stomata densities; A = net photosynthesis; WUE = water use efficiency; Ci = intercellular CO2; fv/fm = maximum efficiency of photosystem Ⅱ; fv/fo = maximum quantum yield of photochemical and non-photochemical process in photosystem Ⅱ; PI = photosynthetic performance index; Proline = proline content; MDA = malondialdehyde; Sugar = soluble sugar; TPC = total phenolics content; TFC = total flavonoids content; Iron = iron conten | ||||||||||||||||||||
DownLoad:
CSV
| Microclimate parameters | Quantification |
| Relative humidity | 56.17–68.21% |
| Light intensity | 210–1780 µmol/m2/s |
| Day temperature | 30–34 ℃ |
| Night temperature | 17–24 ℃ |
| Ambient CO2 | 388.70 µmol/mol |
| Iron oxide (mg/L) | Height (cm) | Diameter (mm) | Total biomass (g) | Leaf number | Total chlorophyll content (TCC) |
| 0 | 41.84 ± 1.10a | 17.67 ± 0.57a | 8.32 ± 0.38a | 6.44 ± 0.18a | 49.39 ± 0.93a |
| 800 | 41.47 ± 1.39a | 16.78 ± 0.41a | 8.22 ± 0.37a | 7.11 ± 0.20a | 52.73 ± 1.06b |
| 1600 | 40.30 ± 1.11a | 16.77 ± 0.56a | 8.29 ± 0.48a | 6.89 ± 0.26a | 44.59 ± 1.33c |
| 2400 | 40.41 ± 0.80a | 17.37 ± 0.27a | 8.41 ± 0.37a | 6.78 ± 0.22a | 41.33 ± 2.59d |
| S. Variation | Iron oxide | Blocks | Interaction |
| PH | ns | ns | ns |
| D | ns | ns | ns |
| T.B | ns | ns | ns |
| LN | ns | ns | ns |
| TCC | *** | ns | * |
| Adaxial | * | ns | ns |
| Abaxial | ** | ns | ns |
| T.S | ** | ns | ns |
| A | *** | ns | ns |
| WUE | * | ns | ns |
| Ci | ** | * | ns |
| fv/fm | ** | ns | ns |
| fv/fo | ** | ns | ns |
| PI | *** | ns | ns |
| Proline | *** | ns | ns |
| MDA | *** | ns | ns |
| Sugar | *** | ** | ns |
| TPC | *** | ns | ns |
| TFC | *** | ns | ns |
| Iron | *** | ns | ns |
| *Note: PH= plant height; D = Diameter; T.B = total biomass; LN = number of leaf; TCC = total chlorophyll content; Adaxial = adaxial stomata densities; Abaxial = abaxial stomata densities; T.S = Total stomata densities; A = net photosynthesis; WUE = water use efficiency; Ci = intercellular CO2; fv/fm = maximum efficiency of photosystem Ⅱ; fv/fo = maximum quantum yield of photochemical and non-photochemical process in photosystem Ⅱ; PI = photosynthetic performance index; Proline = proline content; MDA = malondialdehyde; Sugar = soluble sugar; TPC = total phenolics content; TFC = total flavonoids content; Iron = iron content. *, **, ***, significant at p ≤ 0.05, 0.01, 0.001, respectively; ns = not significant. | |||
| Parameters | Biomass | Leaf_no | Diameter | Height | Tcc | Adaxial | Abaxial | TS | A | WUE | Ci | fv/fm | fv/fo | PI | Proline | MDA | Sugar | TPC | TFC | Iron |
| Biomass | 1 | |||||||||||||||||||
| Leaf_no | 0.236 | 1 | ||||||||||||||||||
| Diameter | 0.590** | 0.122 | 1 | |||||||||||||||||
| Height | 0.605** | -0.044 | 0.394* | 1 | ||||||||||||||||
| TCC | 0.019 | 0.145 | -0.059 | 0.212 | 1 | |||||||||||||||
| Adaxial | 0.319 | 0.000 | 0.197 | 0.073 | 0.061 | 1 | ||||||||||||||
| Abaxial | 0.261 | 0.153 | 0.211 | -0.074 | 0.094 | 0.486* | 1 | |||||||||||||
| T.S | 0.333 | 0.097 | 0.237 | -0.009 | 0.091 | 0.832** | 0.889** | 1 | ||||||||||||
| A | -0.032 | -0.206 | 0.174 | 0.224 | 0.395 | 0.288 | 0.197 | 0.276 | 1 | |||||||||||
| WUE | -0.146 | -0.351 | -0.213 | 0.136 | 0.158 | 0.213 | 0.162 | 0.214 | 0.657** | 1 | ||||||||||
| Ci | 0.198 | -0.127 | 0.434* | 0.095 | 0.156 | 0.245 | 0.164 | 0.232 | 0.563** | -0.069 | 1 | |||||||||
| fv/fm | -0.005 | 0.008 | -0.162 | -0.007 | 0.671** | 0.198 | 0.313 | 0.302 | 0.628** | 0.361 | 0.410* | 1 | ||||||||
| fv/fo | -0.075 | -0.057 | -0.110 | -0.029 | 0.705** | 0.165 | 0.253 | 0.247 | 0.689** | 0.415* | 0.456* | 0.968** | 1 | |||||||
| PI | -0.002 | 0.064 | 0.139 | 0.057 | 0.658** | -0.077 | 0.121 | 0.037 | 0.558** | 0.176 | 0.501* | 0.677** | 0.797** | 1 | ||||||
| Proline | 0.088 | 0.328 | -0.172 | -0.156 | -0.389 | -0.309 | -0.228 | -0.306 | -0.909** | -0.555** | -0.701** | -0.658** | -0.736** | -0.592** | 1 | |||||
| MDA | -0.054 | 0.260 | -0.224 | -0.172 | -0.378 | -0.415* | -0.219 | -0.356 | -0.922** | -0.523** | -0.712** | -0.646** | -0.709** | -0.560** | 0.955** | 1 | ||||
| Sugar | 0.097 | 0.424* | -0.176 | -0.121 | -0.103 | -0.186 | 0.099 | -0.034 | -0.740** | -0.434* | -0.593** | -0.343 | -0.452* | -0.408* | 0.797** | 0.844** | 1 | |||
| TPC | -0.013 | 0.320 | -0.172 | -00.126 | -.200 | -0.265 | -0.192 | -0.261 | -0.846** | -0.416* | -0.809** | -0.507* | -0.572** | -0.501* | 0.907** | 0.879** | 0.746** | 1 | ||
| TFC | -0.110 | 0.348 | -0.052 | -0.020 | 0.017 | -0.576** | -0.255 | -0.463* | -0.518** | -0.403 | -0.643** | -0.387 | -0.404 | -0.160 | 0.641** | 0.639** | 0.548** | 0.704** | 1 | |
| Iron | -0.054 | 0.353 | -0.145 | -0.036 | -0.005 | -0.005 | -0.053 | -0.037 | -0.586** | -0.220 | -0.717** | -0.398 | -0.494* | -0.515* | 0.729** | 0.656** | 0.636** | 0.776** | 0.606** | 1 |
| *Note: Significant at p ≤ 0.01. Biomass = total biomass; Leaf_no = number of leaf; Diameter = bole diameter; Height = plant height; TCC = total chlorophyll content; Adaxial = adaxial stomata densities; Abaxial = abaxial stomata densities; T.S = Total stomata densities; A = net photosynthesis; WUE = water use efficiency; Ci = intercellular CO2; fv/fm = maximum efficiency of photosystem Ⅱ; fv/fo = maximum quantum yield of photochemical and non-photochemical process in photosystem Ⅱ; PI = photosynthetic performance index; Proline = proline content; MDA = malondialdehyde; Sugar = soluble sugar; TPC = total phenolics content; TFC = total flavonoids content; Iron = iron conten | ||||||||||||||||||||
