Citation: Juan Zhang, Huizhong Lu, Gamal Baroud. An accelerated and accurate process for the initial guess calculation in Digital Image Correlation algorithm[J]. AIMS Materials Science, 2018, 5(6): 1223-1241. doi: 10.3934/matersci.2018.6.1223
| [1] | Ahmed M. Abood, Haider Khazal, Abdulkareem F. Hassan . On the determination of first-mode stress intensity factors and T-stress in a continuous functionally graded beam using digital image correlation method. AIMS Materials Science, 2022, 9(1): 56-70. doi: 10.3934/matersci.2022004 |
| [2] | M.M. Reza Mousavi, Masoud D. Champiri, Mohammad S. Joshaghani, Shahin Sajjadi . A kinematic measurement for ductile and brittle failure of materials using digital image correlation. AIMS Materials Science, 2016, 3(4): 1759-1772. doi: 10.3934/matersci.2016.4.1759 |
| [3] | João E. Ribeiro, Hernani Lopes, Pedro Martins, Manuel Braz-César . Mechanical analysis of PDMS material using biaxial test. AIMS Materials Science, 2019, 6(1): 97-110. doi: 10.3934/matersci.2019.1.97 |
| [4] | Ivan Jandrlić, Stoja Rešković, Dušan Ćurčija, Ladislav Lazić, Tin Brlić . Modeling of stress distribution on the basis of the measured values of strain and temperature changes. AIMS Materials Science, 2019, 6(4): 601-609. doi: 10.3934/matersci.2019.4.601 |
| [5] | Kaveh Samadian, Stijn Hertelé, Wim De Waele . Elastic-plastic defect interaction in (a)symmetrical double edge notched tension specimens. AIMS Materials Science, 2017, 4(2): 277-291. doi: 10.3934/matersci.2017.2.277 |
| [6] | Alexander V. Perig, Nikolai N. Golodenko . 2D CFD description of the kinematic effects of movable inlet and outlet die wall transport motion and punch shape geometry on the dynamics of viscous flow during ECAE through Segal 2θ-dies for a range of channel angles. AIMS Materials Science, 2017, 4(6): 1240-1275. doi: 10.3934/matersci.2017.6.1240 |
| [7] | Alp Karakoc, Ertugrul Taciroglu . Optimal automated path planning for infinitesimal and real-sized particle assemblies. AIMS Materials Science, 2017, 4(4): 847-855. doi: 10.3934/matersci.2017.4.847 |
| [8] | R. Citarella, M. Lepore, M. Perrella, C. Calì . Multiple crack propagation by DBEM in a riveted lap-joint. AIMS Materials Science, 2016, 3(4): 1577-1586. doi: 10.3934/matersci.2016.4.1577 |
| [9] | Nicola Poccia . From X-rays microscopies imaging and control to the realization of nanoscale up to mesoscale complex materials with precisely tuned correlated disorder. AIMS Materials Science, 2016, 3(1): 160-179. doi: 10.3934/matersci.2016.1.160 |
| [10] | Sidney L. da Silva, Felipe M. Prado, Isis V. Brito, Diogo Soga, Lígia F. Gomes, Niklaus U. Wetter, Mikiya Muramatsu . Holographic method for stress distribution analysis in photoelastic materials. AIMS Materials Science, 2024, 11(4): 620-633. doi: 10.3934/matersci.2024032 |
DIC (Digital Image Correlation) [1,2,3] is increasingly being used in engineering fields and other fields such as medical image processing [4] for measuring displacements and deformations. The DIC measurements are basically provided by tracking the displacement of pixels by recording sequential images of an object before and after displacement using a pixel-wise search scheme. This process is computationally demanding and the probability of algorithmic mismatch or divergence is relatively high, especially for large deformations [5]. The accurate and efficient processing of the images therefore represents a challenge for the DIC algorithm.
More specifically, the DIC algorithm includes two computational steps:
Significant efforts were made in the past few decades to improve both computational processes in terms of the accuracy and computational efficiency. Earlier studies on subset size [8], interpolation scheme [9,10], shape functions [10], correlation criteria [11], speckle pattern [12] and convergence criteria [7] have considerably advanced the DIC. Experimental aspects such as the object surface [13], chemical etching of object surface [14], hand drawing [14], paint spraying [8,13,15], laser beam structuring [16] and even speckle projections [14] or specked uniqueness [17] were also systemically studied and led to important technological improvements. Other more recent studies successfully deployed advanced algorithms such seed-point initiation, feature detection or registration tracking techniques [5,17,18,19]. The latter studies used special function and transform (affine, Fourier-Mellin) for a more sophisticated tracking particularly for the objects undergoing large deformations and motions [20]. Zhang et al. (2015) ran a parallel DIC code on a graphics processing unit (GPU) for its parallel computing technology and successfully improved the algorithmic efficiency [21]. The DIC computational cost remains high and efficient solutions without compromising the accuracy are desired. In the present article, the focus is made on making the DIC algorithm more efficient. A new efficient algorithmic method is also effective in finding IG values that is closer to the true displacements.
The initial guess of the displacement is used to initiate the NR iteration and as such essential to the overall DIC convergence and efficiency. More precisely, the convergence radius
To obtain an enhanced convergence of NR iteration of DIC measurement with a more accurate IG approximation which is needed in our laboratory testing of porous acrylic cement specimens whose surface is porous and affect the mechanical testing [22], we used the Fuzzy Distance Transform (FDT) that was a method developed and routinely used in our laboratory in image treatment. FDT [23,24,25] was shown to be a particularly effective method to treat and study features in low-resolution micro-computed tomography images. As detailed below, FDT method is a different class of a transform that takes into account the grey value the neighboring pixels to more accurately approximate the distance between two pixels and as such to rebuild an object in the digital image. Therefore, it is hypothesized that FDT can help provide accurate IG values for the DIC calculation. In the present study, the efficiency and accuracy of a novel accelerated FDT method was accordingly introduced and verified using numerical experiments, with a wide range of motion conditions due to the noise-free advantage of numerically generated images.
In this study, the algorithm consists of three main steps: (1) accelerated integer-pixel level initial guess; (2) more accurate initial guess at sub-pixel level and (3) Newton-Raphson iteration for accurate deformation. Particularly, Step 1 is to calculate the integer-level displacement with an accelerated scheme and Step 2 is to increase the accuracy of initial guess to sub-pixel level in aim of reducing the computational cost in initial guess process and improving the accuracy of initial guess which potentially guarantees the convergence of NR iteration (Step 3) in complicated deformation conditions in experimental environment.
The efficiency of the new initial guess algorithm stems from reducing the computationally-demanding search to a smaller subset of the entire images. Specifically, the new efficient process proposed to accelerate the calculation of the initial guess for the displacements of all selected pixel of interest (POI) is broken into two steps: (1) an initial full-field search for the displacements of the first POI in the entire image after displacement and (2) a reduced search for the displacements of the remaining POIs using the displacements of the first POI, determined according to Step 1.
Figure 1 illustrated the scheme of the full-field search for the initial guess of
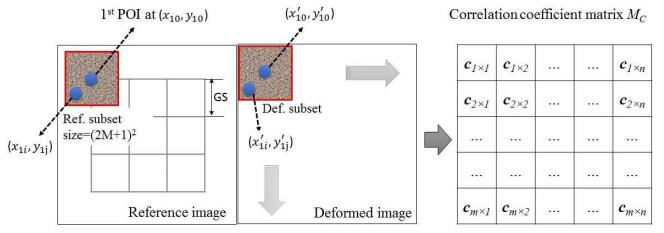 Figure 1. Illustration of full-field search scheme and resulted correlation coefficient matrix
 | CZNCC=M∑i,j=−M[f(xi,yj)−fm]×[g(x′i,y′j)−gm]Δf×Δg. | (1) |
where
| Δf=√M∑i,j=−M[f(xi,yj)−fm]2,Δg=√M∑i,j=−M[g(x′i,y′j)−gm]2 | (2) |
By systematically shifting the location of
| u1=x′10−x10,v1=y′10−y10. | (3) |
From the previous step, the initial values of
Take as per example the
| x′2c=x20+u1,y′2c=y20+v1. | (4) |
Then the reduced search zone was
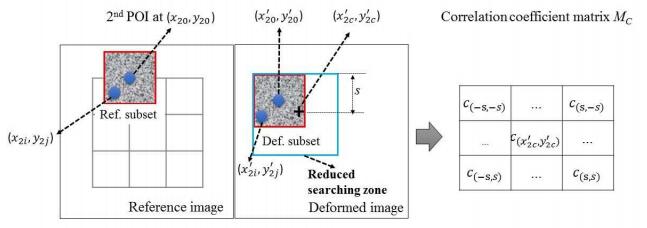 Figure 2. Illustration of the reduced search process and the resulting correlation coefficient matrix
 Using this second step of the new process, the initial guess for displacements of all selected POIs except
It should be however noted that the displacement IG values resulting from the aforementioned accelerated/reduced search scheme are integer without a fractional part because of the discrete nature of the digital images. The accuracy of the tracking is therefore incremental by one pixel. The new fuzzy-logic based process particularly provided IG values of fractional nature (real numbers) at sub-pixel level by calculating a fractional increment over the integer initial guess values. Since this fuzzy-logic based process applies to all POIs, the
To calculate the displacement increment, there were five steps to follow:
1. Identify the pixel of the optimum location
2. Identify the coordinate and correlation coefficient of 8 pixels closest to the optimum or index pixel
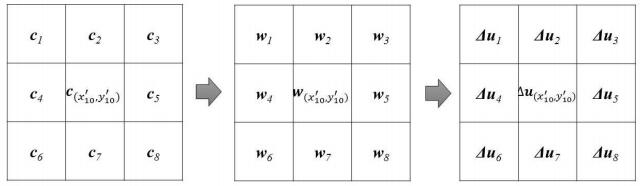 Figure 3. The structure of the fuzzy-logic based process to calculate the displacement increment at a determined location
 3. Calculate, utilizing the fractional correlation values of the adjacent pixel of
| wm=cm−cmin∑8m=1(cm−cmin), | (5) |
where
4. Calculate the fractional displacement increment using the weighting value
| Δum=wm×(x′m−x′10),Δvm=wm×(y′m−y′10). | (6) |
where the pixel with the biggest weighting value contributed most to the total displacement increment. Moreover,
5. Sum up the increments
| ufuzzy=u1+8∑m=1Δum,vfuzzy=v1+8∑m=1Δvm. | (7) |
Through the above five steps, sub-pixel/fractional level increments of the displacements were obtained and can be added to the initial integer guess for the purpose of more accurate initial input in the subsequent NR iteration process. The more accurate initial guess
Once an accurate initial guess of displacement of all selected POI was obtained, the accurate displacement and its gradients could be computed using the NR iteration. If we defined the displacement and gradient components in the deformation vector
| pn+1−pn=−∇C(pn)∇2C(pn), | (8) |
where
| C(p)=M∑i,j=−M[f(xi,yj)−fmΔf−g(x′i,y′j)−gmΔg]2. | (9) |
In Eq 9, the item
| g(x′i,y′j)=3∑l,k=0alk⋅(δx)l⋅(δy)k, | (10) |
where
In fact, the coordinate of pixels
| xi′=xi+u+∂u∂x(xi−x0)+∂u∂y(yi−y0),yj′=yj+v+∂v∂x(xi−x0)+∂v∂y(yi−y0), | (11) |
where only the six variables
| ∇C(p)=(∂C∂p1⋯∂C∂pt⋯∂C∂p6) | (12) |
| ∇2C(p)=(∂2C∂p1∂p1…∂2C∂p1∂p6⋮∂2C∂pt∂pr⋮∂2C∂p6∂p1…∂2C∂p6∂p6) | (13) |
The optimization [27] was used to simplify the Jacobian matrix with a good accuracy [28,29]. Namely, the item
| ∂2C∂pt∂pr≈2M∑i,j=−M∏k=t,r∂∂pk[g(x′i,y′j)−gmΔg]. | (14) |
By substituting Eq 2, Eq 10 and Eq 11 into Eq 14, the Jacobian and Hessian matrices were then calculated. Eq 8 then iterated until the convergence criteria was met, and the optimum unknown vector
| ‖Δp‖=‖pn+1−pn‖=√6∑t=1(Δpt)2<10−3,|ΔC|‖Δp‖<10−8. | (15) |
Comparing to the conventional algorithm which consists of two steps (integer initial guess and Newton-Raphson iteration), a novel algorithm was formed with two extra steps in initial guess calculation and thereafter referred as accelerated F-NR algorithm. Both of the acceleration and fuzzy processes as well as F-NR algorithm were verified as described in the following section.
Since Digital Image Correlation is an image-based and light-intensive method to measure the deformation occurs in experimental environment, there is diversity of external error sources reported (e.g. lightening errors, lens distortion errors, camera self-heating errors, etc.) [11,27,28,29,30]. This study is mainly focused on verifying the new algorithm itself in terms of accuracy and computational efficiency regardless of external errors at this moment. Therefore, the numerical images with known deformation and free of various errors is chosen to verify the algorithm.
An algorithm for numerical image generation was developed according to Zhou [31] and then used to generate a series of image pairs with a prior known displacement and deformations. Based on the preliminary examination of image histogram-related pattern tests, the image size, speckle size and speckle number were chosen to be
Figure 4 showed an example of a pair of images generated with a rotation angle of
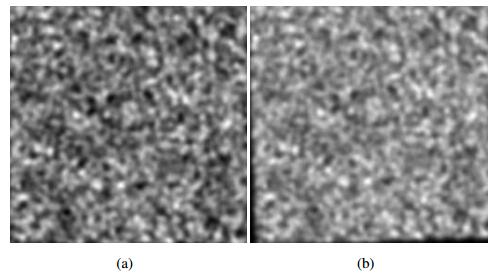 Figure 4. Numerically generated (a) reference image and (b) deformed image with a rotation of 2
Specifically, Version 1 is the conventional algorithm which consists of integer initial guess (IG) search scheme which applies to all POIs as described in Section 2.1.1 and the NR process as described in Section 2.3. Version 2 consists of fast initial guess calculation (as described in Section 2.1) and the NR process described in Section 2.3. At last, Version 3 consists of fast initial guess calculation (as described in Section 2.1), improved initial at sub-pixel level (described in Section 2.2) and the NR process described in Section 2.3. The results of Version 1 algorithm were used as the control or reference for the comparison with Versions 2 and 3.
The image pair shown in Figure 4, with 441 POIs and a grid step of 5 pixels was used for comparing the computational cost of the three aforementioned versions of the DIC algorithm. The subset size used was of
Figure 5 showed the displacement fields obtained from the DIC computation using the novel NR iteration procedure (Version 3). The transversal displacement increased to a range of
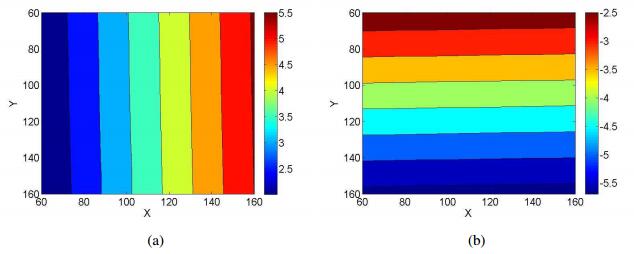 Figure 5. The resulting displacement fields in (a) transversal and (b) axial directions of the image pair in Figure 4 calculated using F-NR algorithm (Version 3).
Figure 6 showed the computation time related to running the Versions 1 to 3 on a Lenovo laptop (i5 processor, 4G RAM). Two group bars were shown the light blue bar denoted the running time used for IG calculation either from the standard full-field, or from reduced-field, or the reduced field and weighted/fuzzy IG procedure (the NR part are all same); the dark bar denoted the time consumed in the NR process (initial guess was obtained from three different ways as mentioned in previous sentence). The average time consumed for the initial guess calculation by Version 1 was
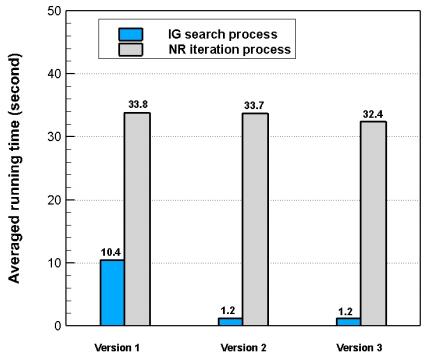 Figure 6. The computation/running time for both the initial guess calculation and for NR iteration process using Versions 1 to 3.
The average time consumed in the NR iteration process in Versions 1 and 2 were
With respect to the accuracy issue of the novel procedure, Figure 7 showed the absolute average displacement error, standard deviation (SD), maximum and minimum errors in of the displacement measurements from: (1) the integer full-field IG search scheme (with no NR); (2) the novel fractional accelerated/fuzzy scheme in accordance with Section 2.2 (with no NR) and, (3) the final F-NR algorithm which combined (2) and the NR process. It is clear that novel scheme (2) largely enhanced the accuracy of the mean IG displacement value from 0.18 (full-field search scheme) to 0.11 pixel (novel scheme). Specifically, the average error in the displacement measurement from the standard scheme (1) was 0.18 pixel with an SD of 0.24 pixel. The maximum and minimum errors were 0.39 pixel and 0.07 pixel, respectively. It was noteworthy that the absolute error was as big as 18% of the smallest unit/increment, which was one pixel. In the novel accelerated fractional (fuzzy-weighted) scheme, (2) the average error was considerably reduced to 0.11 pixel which is equal to an error reduction by 39% in the IG values. This reduction has significant implications for the likelihood and the speed the convergence. The fuzzier the images or the speckle used, the more effective the novel procedure. Specifically, he maximum and minimum error using the fuzzy approximation process were 0.38 pixel and 0.04 pixel which indicated an error reduction by 2.6% and 43% compared to standard scheme (1) as well. In the NR process, the four types of error estimates were obviously reduced to 0.03, 0.002, 0.04 and 0.03 pixel, respectively. This showed the accurate and precise final measurement results of F-NR algorithm. The error can be even lower when a larger subset size is used and the speckle of the images are not clear. In our laboratory experience, the fuzzy-logics approximation provides a useful tool in dealing with low-resolution image features [23,24].
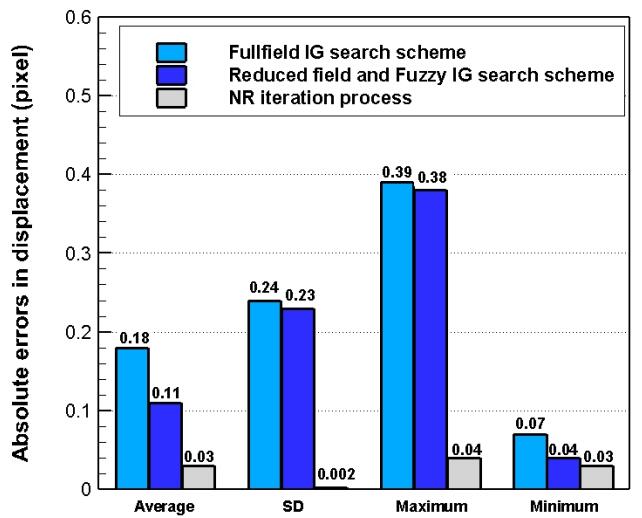 Figure 7. The average, standard deviation (SD), maximum and minimum errors in the displacement measurement of the three steps of F-NR algorithm (Version 3).
According to the structure of three versions of algorithm, the NR iteration part is the same for all three versions in aspect of algorithm structure. Version 1 used integer IG search scheme and NR iteration process. Version 2 used reduced field search schemed and NR iteration process. Version 3 used reduced field search scheme, fuzzy IG search scheme and NR iteration process. In another word, results in Version 1 is used as control group. Version 2 has an extra step of reducing the IG searching zone comparing to Version 1. Version 3 has an extra step of fuzzy IG searching scheme which gives out more accurate IG comparing to Version 3. And these two steps are exactly the new process that this study has proposed comparing to the conventional algorithm shown in Version 1 in terms of computational cost reduction. Therefore, Figure 6 has shown the results of targets that are of the interest in this study.
In addition, the full-field searching in DIC measurement is mainly calculating the deformation information pixel-wise. The reduce searching scheme proposed in this study reduces the searching zone of each pixel of interest. Although it is not shown in this study, the improvement in computational cost by this scheme is predictable in larger image size in case that a larger number of pixels of interest are to be calculated.
To further investigate the limits of the F-NR algorithm (Version 3), a series of image pairs simulating different classes of motions were generated in Table 1. Specifically, ten pairs of images simulating the rigid body translation, rotation and uniaxial tensile conditions were produced and used in this follow-up investigation. For the rigid body translation (RBT) images, translations of 0.1-1 pixel with an increment of 0.1 pixel were studied. Please be aware of the 1-pixel periodicity of errors [9,26]. For the images of simulating the rigid body rotation (RBR), images with clockwise rotation were studied due to a symmetric error curve found for images with counter-clockwise rotations in previous studies. For the image pairs of the uniaxial tensile (UAT) condition, both of the axial and transversal strains
| Simulated type | Target variables | Range | Increment |
| RBT (pixel) | | 0.1-1 | 0.1 |
| RBR ( | | 0.5-5 | 0.5 |
| UAT ( | | 5000-50000 | 5000 |
 DownLoad: CSV
These image pairs were treated using the F-NR algorithm with the configuration, as described in Section 3.1. The axial strain applied ranged between
By applying the F-NR algorithm, the displacement components and gradients were calculated. For the RBR image pairs, the rotation angle was determined from the calculated displacement gradients according to Eq [1].
| θ=12(∂v∂x−∂u∂y), | (16) |
The displacement, rotation angle and strain results calculated using F-NR algorithm were further compared with the actual/real input data, which were a priori known. Figures 8a, b and c showed the displacement vector for one RBT image pairs (
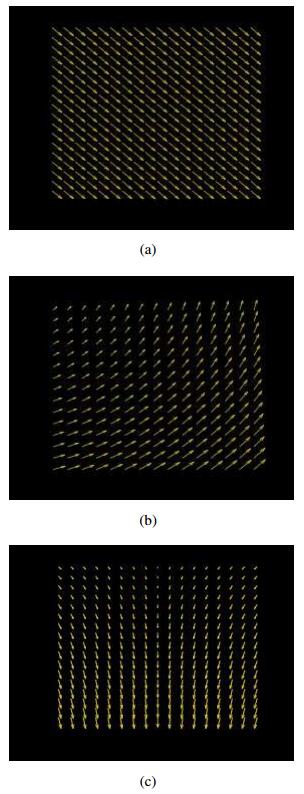 Figure 8. The displacement vector field for (a) rigid body translation,
 Furthermore, Figures 9a, b and c showed the comparison of calculated rigid body displacement, rigid rotation angle and strain values to their respective exact values. The green diamond marks denoted the F-NR results at each level applied load and the blue line denoted the exact values. The red error bar was also plotted to show the standard deviation of the F-NR results. Figure 9 clearly demonstrated a high agreement between algorithmic results and exact values. The negative strains denoted the transversal strains while positive strains denoted axial strains in Figure 9c. It is clear that the strain calculated by the F-NR algorithm, even for large deformations of up to
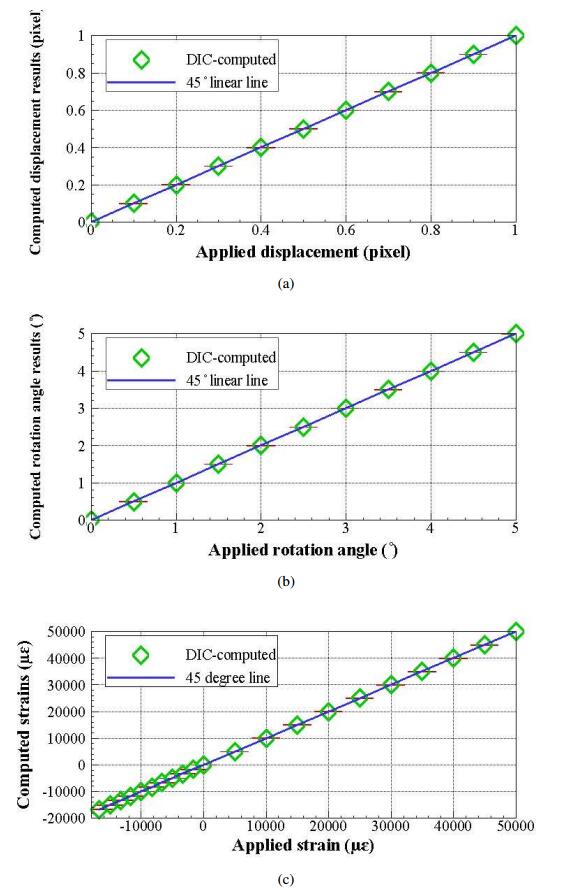 Figure 9. Comparison of the F-NR results and applied conditions listed in Table 1 (a) rigid body translation, (b) rigid body rotation and (c) uniaxial tensile conditions.
To have a more precise view of algorithmic errors with increased motion, Figures 10a, b and c demonstrated the average absolute error for the three conditions listed in Table 1. Figure 10a shows that the absolute error of the transversal and axial displacement components approximately followed a sinusoidal curve as a systematic error due to the intensity interpolation [9,26]. And errors were close to zero at 0, 0.5, and 1 pixel positions which was reported by earlier study of Schreier, et al. (2000) [26]. The standard deviations at the 10 displacement increments were almost identical in value. The algorithmic overall absolute error fell between
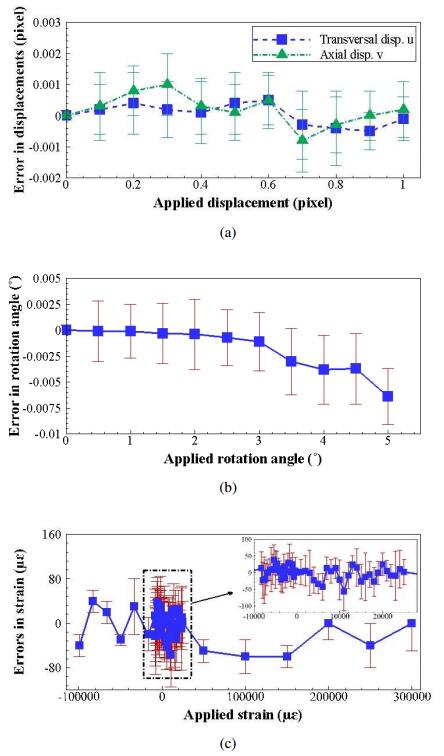 Figure 10. The detailed mean error and SD for all the simulated (a) rigid body translation, (b) rigid body rotation and (c) uniaxial tensile image pairs.
Figure 10b shows a negatively increasing average error in algorithmically calculated rotation angle versus applied rotation angle. Specifically, the error ranged from 0 to approximately
Figure 10c show that the absolute average error of the calculated axial strain fluctuated between -60
We were able to confirm the hypothesis of the study in that using the novel search scheme, the IG values became more accurate and the overall computational costs of running the DIC algorithm were reduced by 31.5%, which is substantial. Specifically, compared to the full-field search scheme, the accelerated scheme reduced the computational cost for the IG values by 88.5% (Figure 6). Furthermore, Figure 7 clearly showed that the average IG value was considerably closer to the average true displacement value if compared to the full-field search scheme. The F-NR algorithm was verified by a wide range of image pairs simulating rigid body translations and rotations as well as the uniaxial tensile strains of up to 30%. The overall error of three motion types remained smaller than 1.2% which indicated an algorithmic accuracy of 98.8%. The relative standard deviation was smaller than 1% which implied a precision rate of 99%. Our study showed that the novel F-NR algorithm is accurate, precise, and efficient. This algorithm was also robust for all types of displacement and deformation tested.
It is believed that the new scheme using reduced searching zone and fuzzy-logic based scheme for initial guess would perform better in images with larger image size and deformation due to the pixel-wise initial guess calculation. The results obtained in this study concluded that the novel algorithm is an efficient technique for accurately measuring full-field displacements and a wide range of deformations. The two extra steps and this complete algorithm is potentially useful in DIC measurement during the mechanical testing of bone cement specimens with sophisticated surface conditions during deformation.
The funding from Chinese Scholarship Council, Natural Sciences and Engineering Research Council of Canada (NSERC) are acknowledged. Dr Liang Wang and Dr. Ahmed Sweedy are acknowledged for the valuable discussions during the algorithm development and manuscript revision in this study, respectively.
The authors declare no conflict of interest.
| [1] |
Bruck HA, McNeil SR, Sutton MA, et al. (1989) Digital image correlation using Newton-Raphson method of partial differential correction. Exp Mech 29: 261–267. doi: 10.1007/BF02321405

|
| [2] | Pan B, Qian K, Xie H, et al. (2009) Two-dimensional digital image correlation for in-plane displacement and strain measurement: A review. Meas Sci Technol 20: 1–17. |
| [3] | Hild F, Roux S (2009) Digital Image Correlation: From Displacement Measurement to Identification of Elastic Properties-a Review. Strain 42: 69–80. |
| [4] |
Iizaka S, Sugama J, Nakagami G, et al. (2011) Concurrent validation and reliability of digital image analysis of granulation tissue color for clinical pressure ulcers. Wound Repair Regen 19: 455–463. doi: 10.1111/j.1524-475X.2011.00686.x
|
| [5] |
Zhang ZF, Kang YL, Wang HW, et al. (2006) A novel coarse-fine search scheme for digital image correlation method. Measurement 39: 710–718. doi: 10.1016/j.measurement.2006.03.008
|
| [6] |
Pan B, Li L, Tong W (2013) Fast, Robust and Accurate Digital Image Correlation Calculation Without Redundant Computations. Exp Mech 53: 1277–1289. doi: 10.1007/s11340-013-9717-6
|
| [7] | Pan B (2013) An Evaluation of Convergence Criteria for Digital Image Correlation Using Inverse Compositional Gauss-Newton Algorithm. Strain 50: 48–56. |
| [8] |
Pan B, Xie HM, Wang ZY, et al. (2008) Study on subset size selection in digital image correlation for speckle patterns. Opt Express 16: 7037–7048. doi: 10.1364/OE.16.007037
|
| [9] |
Wang YQ, Sutton MA, Bruck HA, et al. (2009) Quantitative Error Assessment in Pattern Matching: Effects of Intensity Pattern Noise, Interpolation, Strain and Image Contrast on Motion Measurements. Strain 45: 160–178. doi: 10.1111/j.1475-1305.2008.00592.x
|
| [10] |
Schreier HW, Sutton MA (2002) Systematic errors in digital image correlation due to undermatched subset shape functions. Exp Mech 42: 303–310. doi: 10.1007/BF02410987
|
| [11] |
Tong W (2005) An Evaluation of Digital Image Correlation Criteria for Strain Mapping Applications. Strain 41: 167–175. doi: 10.1111/j.1475-1305.2005.00227.x
|
| [12] |
Zhang Y, Yan L, Liou F (2018) Improved initial guess with semi-subpixel level accuracy in digital image correlation by feature-based method. Opt Las Eng 104: 149–158. doi: 10.1016/j.optlaseng.2017.05.014
|
| [13] |
Pan B, Lu Z, Xie H (2010) Mean intensity gradient: An effective global prameter for quality assessment of the speckle patterns used in digital image correlation. Opt Las Eng 48: 469–477. doi: 10.1016/j.optlaseng.2009.08.010
|
| [14] | Niu Y, Shao S, Park SB, et al. (2017) A novel speckle-free digital image correlation method for in-situ sarpage characterization. IEEE Trans Compon Packag Manuf Technol 7: 276–284. |
| [15] |
Pan B, Asundi A, Xie HM, et al. (2009) Digital image correlation using iterative least squares and pointwise least squares for displacement field and strain field measurement. Opt Las Eng 47: 865–874. doi: 10.1016/j.optlaseng.2008.10.014
|
| [16] | Liu X, Li R, Zhao H, et al. (2015) Quality assessment of speckle patterns for digital image correlation-Shannon entropy. Optik 126: 4205–4211. |
| [17] |
Zhang J, Sweedy A, Gitzhofer F, et al. (2018) A novel method for repeatedly generating speckle patterns used in digital image correlation. Opt Las Eng 100: 259–266. doi: 10.1016/j.optlaseng.2017.09.012
|
| [18] | Zhong F, Quan C (2018) Efficient digital image correlation using gradient orientation. Opt Las Eng 106: 417–426. |
| [19] | Pan B, Wang Y, Tian L (2017) Automated initial guess in digital image correlation aided by Fourier-Mellin transform. Opt Eng 56: 1–7. |
| [20] | He H, Zhou R, Zou Y, et al. (2018) A comprehensive method for accurate strain distribution measurement of cell substrate subjected to large deformation. J Healthc Eng 2018: 1–10. |
| [21] |
Zhang L, Wang T, Jiang Z, et al. (2015) High accuracy digital image correlation powered by GPU-based parallel computing. Opt Las Eng 69: 7–12. doi: 10.1016/j.optlaseng.2015.01.012
|
| [22] |
Vila M, Ginebra M, Gil F, et al. (1999) Effect of porosity and environment on the mechanical behavior of acrylic bone cement modified with acrylonitrile-butadiene-styrene particles: I. Fracture toughness. J Biomed Mater Res 48: 121–127. doi: 10.1002/(SICI)1097-4636(1999)48:2<121::AID-JBM5>3.0.CO;2-P
|
| [23] | Bashoor-Zadeh M, Baroud G, Bohner M (2009) Geometric analysis of porous bone substitutes using micro-computed tomography and fuzzy distance transform. Acta Biomater 6: 864–875. |
| [24] |
Darabi A, Chandelier F, Baroud B (2009) Thickness analysis and reconstruction of trabecular bone and bone substitute microstructure based on fuzzy distance map using both ridge and thinning skeletonization. Can J Elect Comput E 34: 57–62. doi: 10.1109/CJECE.2009.5291208
|
| [25] |
Saha PK, Wehrli FW, Gomberg BR (2002) PK Saha and FW Wehrli and BR Gomberg. Comput Vis Image Underst 86: 171–190. doi: 10.1006/cviu.2002.0974
|
| [26] |
Schreier HW, Braasch JR, Sutton MA (2000) Systematic errors in digital image correlation caused by intensity interpolation. Opt Eng 39: 2915–2921. doi: 10.1117/1.1314593
|
| [27] | Vendroux G, KnaussWG(1998) Submicron Deformation Field Measurements 2: Improved Digital Image Correlation. Exp Mech 38: 86–91. |
| [28] |
Pan B, Li K (2011) A fast digital image correlation method for deformation measurement. Opt Las Eng 49: 841–847. doi: 10.1016/j.optlaseng.2011.02.023
|
| [29] |
Pan B, Yu L,Wu D (2013) High-accuracy 2D digital image correlation measurements with bilateral telecentric lenses: Error analysis and experimental verification. Exp Mech 53: 1719–1733. doi: 10.1007/s11340-013-9774-x
|
| [30] |
Lu H, Cary PD (2000) Deformation measurements by digital image correlation: Implementation of a second-order displacement gradient. Exp Mech 40: 393–400. doi: 10.1007/BF02326485
|
| [31] |
Zhou P, Goodson KE (2001) Subpixel displacement and deformation gradient measurement using digital image/speckle correlation (DISC). Opt Eng 40: 1613–1620. doi: 10.1117/1.1387992
|
| [32] |
Pan B (2009) Reliability-guided digital image correlation for image deformation measurement. Appl Opt 48: 1535–1542. doi: 10.1364/AO.48.001535
|
| 1. | EMC Jones, Path-Integrated Stereo X-Ray Digital Image Correlation: Resolving the Violation of Conservation of Intensity, 2024, 0014-4851, 10.1007/s11340-023-01029-7 |

Juan Zhang, Huizhong Lu, Gamal Baroud. An accelerated and accurate process for the initial guess calculation in Digital Image Correlation algorithm[J]. AIMS Materials Science, 2018, 5(6): 1223-1241. doi: 10.3934/matersci.2018.6.1223

| Simulated type | Target variables | Range | Increment |
| RBT (pixel) | | 0.1-1 | 0.1 |
| RBR ( | | 0.5-5 | 0.5 |
| UAT ( | | 5000-50000 | 5000 |
DownLoad: CSV


