Research article Topical Sections

Oxygen permeation through perovskitic membranes: The influence of steam in the sweep on the permeation performance

  • Received: 31 May 2016 Accepted: 02 August 2016 Published: 08 August 2016
  • Experimental approaches are employed for the understanding of oxygen permeation through membranes. For the experiments, different oxygen partial pressures are applied to both sides of a BSCF5582 membrane, using synthetic air as feed and vacuum or steam/argon as sweep gas. Beside the partial pressure gradient, the permeation rate depends on the temperature and the membrane thickness. Sufficient permeation rates can be achieved by sweeping the membrane with water vapor (steam) instead of a noble gas, which is optimized by ascending water content in the sweep gas. The influence of the steam content on the permeation performance as well as microstructural changes are demonstrated.

    Citation: Florian Thaler , Michael Müller, Robert Spatschek. Oxygen permeation through perovskitic membranes: The influence of steam in the sweep on the permeation performance[J]. AIMS Materials Science, 2016, 3(3): 1126-1137. doi: 10.3934/matersci.2016.3.1126

    Related Papers:

    [1] Ying Liu, Yanping Chen, Yunqing Huang, Yang Wang . Two-grid method for semiconductor device problem by mixed finite element method and characteristics finite element method. Electronic Research Archive, 2021, 29(1): 1859-1880. doi: 10.3934/era.2020095
    [2] Changling Xu, Tianliang Hou . Superclose analysis of a two-grid finite element scheme for semilinear parabolic integro-differential equations. Electronic Research Archive, 2020, 28(2): 897-910. doi: 10.3934/era.2020047
    [3] Hongze Zhu, Chenguang Zhou, Nana Sun . A weak Galerkin method for nonlinear stochastic parabolic partial differential equations with additive noise. Electronic Research Archive, 2022, 30(6): 2321-2334. doi: 10.3934/era.2022118
    [4] Leilei Wei, Xiaojing Wei, Bo Tang . Numerical analysis of variable-order fractional KdV-Burgers-Kuramoto equation. Electronic Research Archive, 2022, 30(4): 1263-1281. doi: 10.3934/era.2022066
    [5] Jingyun Lv, Xiaoyan Lu . Convergence of finite element solution of stochastic Burgers equation. Electronic Research Archive, 2024, 32(3): 1663-1691. doi: 10.3934/era.2024076
    [6] Changling Xu, Huilai Li . Two-grid methods of finite element approximation for parabolic integro-differential optimal control problems. Electronic Research Archive, 2023, 31(8): 4818-4842. doi: 10.3934/era.2023247
    [7] Akeel A. AL-saedi, Jalil Rashidinia . Application of the B-spline Galerkin approach for approximating the time-fractional Burger's equation. Electronic Research Archive, 2023, 31(7): 4248-4265. doi: 10.3934/era.2023216
    [8] Victor Ginting . An adjoint-based a posteriori analysis of numerical approximation of Richards equation. Electronic Research Archive, 2021, 29(5): 3405-3427. doi: 10.3934/era.2021045
    [9] Chang Hou, Hu Chen . Stability and pointwise-in-time convergence analysis of a finite difference scheme for a 2D nonlinear multi-term subdiffusion equation. Electronic Research Archive, 2025, 33(3): 1476-1489. doi: 10.3934/era.2025069
    [10] Chunmei Wang . Simplified weak Galerkin finite element methods for biharmonic equations on non-convex polytopal meshes. Electronic Research Archive, 2025, 33(3): 1523-1540. doi: 10.3934/era.2025072
  • Experimental approaches are employed for the understanding of oxygen permeation through membranes. For the experiments, different oxygen partial pressures are applied to both sides of a BSCF5582 membrane, using synthetic air as feed and vacuum or steam/argon as sweep gas. Beside the partial pressure gradient, the permeation rate depends on the temperature and the membrane thickness. Sufficient permeation rates can be achieved by sweeping the membrane with water vapor (steam) instead of a noble gas, which is optimized by ascending water content in the sweep gas. The influence of the steam content on the permeation performance as well as microstructural changes are demonstrated.


    Neuronal communication is based on synapses, including both chemical and electrical synapses [1,2]. Electrical synapses are widespread in mammalian brain neural circuits and regulate the firing pattern of interconnected neurons [2,3]. Electrical synapses can increase neuronal excitability and accelerate the synchronization of neuronal firing [4,5,6]. Neuronal synchronization makes a valuable contribution toward maintaining some physiological functions of the brain [7]. The synchronization of neuronal networks has been widely studied, mainly focusing on complete, phase, and lag synchronization [8,9,10,11]. As for the issues of synchronization transitions between in-phase and anti-phase spikes, some studies have focused on the firing of normal bursters in a neural system [12]. However, the firing of mixed bursters is global in a neural network, and their synchronization seems to be consequential.

    There has been considerable research on normal bursters in coupled neurons. Sherman et al. studied a simplified model for a pair of pancreatic beta cells coupled by electrical synapses, and they analyzed the fast subsystem to illuminate how electrical coupling affects bifurcation behavior. When the coupling is weak, the spikes within bursters are not in-phase, but rather anti-phase, asymmetric, and quasi-periodic [13]. De Vries et al. used a general weakly coupled nonlinear oscillator model to understand the burster mechanism of pancreatic beta cells, and obtained similar results using a more simplified model [14]. Yang et al. analyzed a relatively simple model consisting of two identical coupled layers. The coupling induced new bifurcations, leading to multi-stability. A pair of distinct, unstable, asymmetric steady states were observed [15]. Toporikova et al. showed the effect of synaptic and electrical coupling on burst dynamics and spike synchronization within bursters via the coupled neuronal model pre-Bözinger complex (pre-BötC). Electrical coupling promotes spikes of in-phase synchronization within a burster, and synaptic coupling promotes the transition of anti-phase spikes within bursters [12]. Duan et al. studied the relationship between the in-phase and anti-phase spikes within a mixed burster and the following initial values: the in-phase spike synchronization within a mixed burster corresponded to the same initial values, and the anti-phase spike synchronization corresponded to different initial values [16,17,18]. The local and global stability of the coupled networks were analyzed and there are also many studies on the stable regions and bifurcation curves of the coupled networks in parameter planes [19]. The codimension-2 bifurcation analysis of neuronal system for mixed-mode oscillations shown more details of bifurcation [20,21]. However, the transition of the in-phase and anti-phase spike synchronization within the mixed burster was not revealed.

    This paper is organized as follows. A modified neuronal model, the coupled pre-BötC model, is introduced in Section 2. In Section 3, we explore how the mixed burster pattern of the system depends on the parameters of both electrical (ggap) and synaptic (gsyne) coupling. We study how the parameters ggap and gsyne affect the anti-phase and in-phase spike synchronization of mixed bursters. By fast/slow decomposition and bifurcation analysis, we investigate the dynamic mechanisms of synchronization. We find that the synchronization of spikes within dendritic bursters occurs earlier than within somatic bursters. The transition state between in-phase and anti-phase spike synchronization is called the asymmetric periodic somatic burster. Finally, a discussion is provided in the last section.

    The single-compartment pre-BötC inspiratory neurons [22] are coupled and modified as follows:

    ˙Vi=(INaPiICANiINaiIKiILiIsyneiIgapi)/C, (2.1)

    where i,j=1,2 and ij, V is the membrane potential; INaP, ICAN, INa, IK, IL, Isyne, and Igap represent the persistent sodium current, calcium-activated nonspecific cationic current, Na+ current, delayed-rectifier K+ current, leakage current, synaptic coupling current, and electric coupling current, respectively; and C is the overall cell capacitance. These currents are calculated as follows:

    INaPi=gNapmphi(ViENa),ICANi=gCANf([Ca]i)(ViENa),INai=gNam3(Vi)(1hi)(ViENa),IKi=gKn3i(ViEK),ILi=gL(ViEL),Isynei=gsynesi(ViEsyne),Igapi=ggap(ViVj).

    The activation and inactivation variables n and h are described by the following equations:

    ˙ni=(n(Vi)ni)/τn(Vi), (2.2)
    ˙hi=(h(Vi)hi)/τh(Vi). (2.3)

    The voltage-dependent activation and inactivation steady states and the time constants are described as follows:

    α(Vi)=11+eViθασα,α=mp,m,h,n,sτβ(Vi)=τβcoshViθβ2σβ.β=n,h

    The synaptic activation variable s can be described as follows:

    ˙si=αs(1si)s(Vj)si/τs. (2.4)

    The Ca2+ kinetics are described by two equations representing the intracellular Ca2+ balance ([Ca]) and IP3 channel gating variable (l):

    ˙[Ca]i=fc(JERINJEROUT), (2.5)
    ˙li=AKd(1li)A[Ca]ili. (2.6)

    The flux into the cytosol from the ER (JERIN) and the flux from the cytosol back to the ER (JEROUT) are described as follows:

    JERIN=[LIP3+PIP3([IP3][Ca]ili([IP3]+KI)([Ca]i+Ka))3]([Ca]Tot[Ca]iσ[Ca]ili),JEROUT=VSERCA[Ca]2iK2SERCA+[Ca]2i.

    The function f([Ca]i) describes the activation of ICAN by Ca2+:

    f([Ca]i)=11+[KCAN][Ca]inCAN,

    The parameter values used in the model are listed in Table 1.

    Table 1.  Values of parameters in the model.
    Parameter Value Parameter Value Parameter Value
    θmp 40 mV τh 10000 ms EL 58 mV
    θm 34 mV τn 100 ms Esyne 0 mV
    θh 48 mV τs 5 ms nCAN 0.97
    θn 29 mV gNaP 3 nS KCAN 0.74 μM
    θs 10 mV gNa 15 nS [Ca]Tot 1.25 μM
    σmp 6 mV gK 9 nS σ 0.185
    σm 5 mV gL 2.3 nS VSRECA 400
    σh 5 mV gCAN 0.7 nS kSRECA 0.2 μM
    σn 4 mV ENa 50 mV LIP3 0.27 pLs1
    σs 5 mV EK 85 mV PIP3 31000 pLs1
    KI 1.0 μM Ka 0.4 μM [IP3] 0.95 μM
    C 21 μF αs 0.2 fc 0.000025 pL1
    A 0.001 μM1s1 Kd 0.4 μM

     | Show Table
    DownLoad: CSV

    The function of the coupled neuron spike phase is as follows:

    ϕi=2kπ+2πttkitk+1itki,(tki<t<tk+1i,k=1,2,...N1),(i,j=1,2),

    where t represents time, tki is the time when the k-th spike fires in the i-th neuron, and N is the number of spikes. The phase difference of a spike is defined as follows:

    Δϕ(t)=|ϕ1(t)ϕ2(t)|.

    According to the values of max(Δϕ(t)), we define the synchronization of spikes within mixed bursters as follows:

    (a) max(Δϕ(t))=0: In-phase synchronization of a spike;

    (b) max(Δϕ(t))=π: Anti-phase synchronization of a spike;

    (c) 0<max(Δϕ(t))<π: Out of phase synchronization of a spike.

    (d) max(Δϕ(t))>π: Asynchronization of a spike.

    Our mathematical model of coupled pre-BötC involves two independent burster mechanisms. Bursters in the somatic compartment are modeled via the inactivation of a persistent sodium current(INaP) in the Eq (2.1), whereas bursters in the dendritic compartment rely on Ca2+ oscillations, which are determined by the neuromodulatory tone and modeled via calcium-activated nonspecific cationic current (ICAN) in the Eq (2.1). The former are usually called somatic bursters, and the latter are called dendritic bursters (Figure 1(e)).

    Figure 1.  Interspike interval (ISI) diagrams for the parameter gsyne with different values of ggap: (a) ggap=0 (nS), (b) ggap=1 (nS), (c) ggap=2 (nS), and (d) ggap=3 (nS). Time sequences with ggap fixed at 1 nS: (e) gsyne=1 (nS) and (f) gsyne=4 (nS). The olive and red curves represent V1 and [Ca], respectively. Type 1 (d1): Interval between the dendritic burster and the next somatic burster. Type 2 (d2): Interval between the adjacent somatic bursters. Type 3 (d3): Interval between the dendritic burster and the previous somatic burster. Type 4: Interspike interval within bursters.

    To investigate the effects of the electrical and synaptic coupling strength on mixed bursters, we use the interspike interval (ISI) of the membrane potential V1 to describe the variations of the mixed burster pattern. The ISIs when varying gsyne with different fixed values of ggap are shown Figure 1(a)(d). The ISI sequences can be divided into four types, as shown in Figure 1(a) (refer to Figure 1(f) for details). These types are described as follows:

    Type 1 (refer to marker d1 in Figure 1(f)): the top wavy sequences. The interspike interval is from the start of the last spike of the dendritic burster in the previous period to the first spike of the first somatic burster in the next period.

    Type 2 (refer to marker d2 in Figure 1(f)): the second lasting increasing linear sequence. The interval is between two adjacent somatic bursters.

    Type 3 (refer to marker d3 in Figure 1(f)): the parabolic sequences. The interval is between the last somatic burster and dendritic burster in one period.

    Type 4: the bottom sequences. The interspike intervals are within bursters.

    For ggap=0 (nS), with the increase in gsyne, d1 is slowly increases in general. d2 increases approximately linearly, which indicates that the intervals between two adjacent somatic bursters increase accordingly. The trend of d3 is parabolic and periodic. Every parabolic sequence starts at the sequences of d2 and ends at the sequences of d4, which means that the last somatic burster approaches a dendritic burster, and then they merge with each other. The number of parabolic sequences is the number of somatic bursters in one period. In summary, with the increase in gsyne, the number of somatic bursters gradually decreases to 0. The somatic bursters then finally transition to spike firing. The ISI diagrams with ggap=1, 2, and 3 (nS) are shown in Figure 1(b), (c), and (d), respectively. The structure of the ISI diagrams with different ggap is similar to that shown in Figure 1(a). As the parameter ggap increases, the value of gsyne, which transitions to spike firing, increases correspondingly.

    With a fixed gsyne, the ISI diagrams with gsyne= 0, 2, 4, and 6 (nS) are shown in Figure 2. When gsyne is 0 nS (Figure 2(a)), with the increase in ggap, the ISIs begin to increase initially, similar to the behavior shown in Figure 1(a)(d). In particular, the number of somatic busters decreasing. When ggap reaches a critical value, the ISIs remain unchanged, regardless of how ggap increases. This critical value signifies that the mixed bursters reach a steady state in which the time sequences maintain the same pattern. When gsyne increases to 2 nS, the critical value increases correspondingly (Figure 2(b)). With gsyne increasing to 4 nS, the former part of the ISI is also increasing as ggap increases, and the critical value also increases. There seems to be a transition state before the ISIs reach the steady state (Figure 2(c)). When gsyne increases to 6 nS, the region of the transition state and critical value also increase correspondingly (Figure 2(d)).

    Figure 2.  ISI diagrams for a fixed value of parameter ggap with different values of gsyne: (a) gsyne=0 (nS), (b) gsyne=2 (nS), (c) gsyne=4 (nS), and (d) gsyne=6 (nS).

    We select the first somatic burster of periodic mixed bursters to investigate its synchronization. In Section 3.1, we found that there is a steady state of ISIs with a change in gsyne or ggap. With the increase in the value of ggap, the somatic burster of the coupled system transitions to complete spike synchronization from anti-phase spikes, as shown in Figure 3. For ggap=0.2 (nS), the spikes within a somatic burster are almost anti-phase, as shown in Figure 3(a). With ggap increasing to 0.6 nS, the duration of the somatic burster increases, and the first several spikes begin to be in-phase, while others are still anti-phase within one somatic burster, as shown in Figure 3(b). When ggap increases to 1.3 nS, all the spikes within the somatic burster remain in-phase (Figure 3(c)). When ggap further increases to 2 nS, the spikes within the somatic burster still stay in the in-phase state and maintain the same firing pattern, for example, as shown in Figure 3(d). Compared with the cases considered in Section 3.1, increasing ggap leads to in-phase spike synchronization for the somatic bursters. Furthermore, ggap will not affect the state of the coupled system when ggap is greater than a critical value. However, increasing gsyne will delay the synchronization, because increasing gsyne leads to an increase in the critical value (shown in Figure 2).

    Figure 3.  Time sequence of somatic bursters with the increase in ggap: (a) ggap=0.2 (nS), (b) ggap=0.6 (nS), (c) ggap=1.3 (nS), and (d) ggap=2 (nS). gsyne is fixed at 2 nS. The olive and orange curves represent the membrane potentials V1 and V2, respectively.

    As we mentioned earlier, the increase in ggap leads to a critical value at which the coupled system transitions to in-phase spikes from anti-phase spikes, and the increase in gsyne postpones the critical value. To better understand the influence of the two kinds of coupling strengths on the critical value, we record the average values of the phase difference of the spikes in somatic bursters with the parameters ggap and gsyne. The pseudo-color diagram in the (ggap, gsyne)-plane is shown in Figure 4. The color represents the average values of the phase difference of the spikes, and the number represented by the color is shown in the colormap on the right. There is a distinct boundary between the in-phase and anti-phase spike synchronization regions. With the increase in gsyne, the boundary moves to the direction in which ggap is also increasing. The boundary curve is the critical value of the in-phase and anti-phase synchronization in the coupled system. Increasing ggap can indeed lead to the in-phase synchronization of the coupled system, but increasing gsyne can delay the synchronization through the trend of the boundary curve. For a smaller value of ggap, the system is in anti-phase spike synchronization. Increasing gsyne will destroy the state in which the somatic burster is in-phase spike synchronization. For a larger value of ggap, the system is in in-phase spike synchronization. As long as ggap is large enough (larger than the synchronization threshold), the system will achieve complete synchronization. When ggap and gsyne are both small, the synchronization state of the coupled system is affected by both of them. As long as ggap is large enough, ggap will dominate the synchronization state of the coupled system.

    Figure 4.  Pseudo-color diagram for in-phase and anti-phase spike synchronization with parameters ggap and gsyne. The color represents the average value of the phase difference of the spikes. The blue region represents in-phase spike synchronization (the average value of the phase difference is 0) and the yellow region represents anti-phase spike synchronization (the average value of the phase difference is π).

    Bursters occur within the region of bistability, where both periodic and equilibrium solutions coexist. The region of bistability is necessary for the existence of square-wave bursters [23], as shown in Figure 5. Using h as the bifurcation parameter of the fast subsystem, we explain the dynamic bifurcation mechanisms of the in-phase and anti-phase spike synchronization within somatic bursters for the coupled system. The bifurcation diagrams of the fast subsystem for four different cases (Figure 3) are plotted in Figure 5. The red curve represents an anti-phase periodic solution, which is called the AP branch. The blue curve represents an in-phase periodic solution, which is called the IP branch. The IP branch starts from the IP Hopf bifurcation point and ends at a homoclinic point (HC). The AP branch starts from the AP Hopf bifurcation point. The AP branch is initially unstable but becomes stable through a branch point of cycles (BPCAP), after which it loses its stability through a fold limit bifurcation of cycles (LPCAP). The IP branch is initially unstable, but becomes stable through a fold limit bifurcation of cycles (LPCIP), and then it loses its stability through a branch point of cycles (BPCIP).

    Figure 5.  Bifurcation diagrams of fast subsystem with respect to the slow variable parameter h. The dashed and solid lines represent unsteady and steady states, respectively. The red line represents the anti-phase periodic solution, and the blue line represents the in-phase periodic solution, with gsyne=2 (nS): (a) ggap=0.2 (nS), (b) ggap=0.6 (nS), (c) ggap=1.3 (nS), and (d) ggap=2 (nS). AP: Anti-phase periodic solution; IP: In-phase periodic solution; SN: Limit point bifurcation; HC: Homoclinic point bifurcation; LPC: Limit point bifurcation of cycles; BPC: Branch point of cycles.

    The AP branch is stable, but the IP branch is unstable in the bistable region. Thus, the somatic burster contains anti-phase spikes rather than in-phase spikes (Figure 5(a)). When ggap increases to 0.6 nS, as shown in Figure 5(b), although the bistable region still includes a stable AP branch, the spikes within the somatic burster are also anti-phase spikes. Compared with the case in Figure 5(a), BPCAP and BPCIP are shifted to the left along the corresponding branches, which gives rise to a decrease in the size of the stable region of the limit cycle on the AP branch but an increase on the IP branch. With the increase in ggap, the AP branch gradually loses stability and the IP branch gradually obtains a more stable branch through BPCAP and BPCIP, respectively, as shown in Figure 5(a)(d). When the AP branch loses stability in the whole bistable region, the IP branch will become stable in the bistable region, as shown in Figure 5(c). The coupled system will enter an in-phase spike state. At the same time, BPCIP will disappear. If ggap continues to increase, the AP branch completely loses stability and BPCAP disappears, as shown in Figure 5(d). However, the IP branch remains stable. The somatic bursters remain in in-phase spike synchronization. At the same time, the increase in ggap causes the AP Hopf bifurcation point to move to the left, along with the AP branch.

    The somatic burster in which spikes are anti-phase begins at SN and ends at the LPCAP bifurcation on the AP branch (shown in Figure 5(a) and (b)). The somatic burster in which spikes are in-phase also begins at SN but ends at the HC bifurcation on the IP branch (shown in Figure 5(c) and (d)). BPCAP and BPCIP are heavily related to the anti-phase and in-phase spike synchronizations. Thus, we divide the (h,V) plane into regions Ⅰ and Ⅱ by BPCAP and BPCIP, as shown in Figure 6(a). In region Ⅰ, the IP branch is stable, so it must be related to the in-phase solution. In region Ⅱ, the AP branch is stable, so it must be related to the anti-phase solution (Figure 6(a)).

    Figure 6.  (a): Bifurcation diagram of fast subsystem with gsyne set to 2 nS. (b): Two-parameter bifurcation diagram of fast subsystem with gsyne set to 0.2 nS. Region Ⅰ: In-phase solution; region Ⅱ: Anti-phase solution.

    The two-parameter bifurcation diagram with parameters h and ggap is shown in Figure 6(b). The somatic burster in which spikes are in-phase begins at SN and ends at HC, and the in-phase solution is stable on the right side of BPCIP. Thus, the curves of SN, HC, and BPCIP form region Ⅰ, where we select the right side of the curve of BPCIP. In region Ⅰ, the coupled system exhibits in-phase spikes within somatic bursters. The somatic burster in which spikes are anti-phase also begins at SN but ends at LPCAP. The anti-phase solution is stable on the left side of BPCAP, so the curves of SN, LPCAP, and BPCAP form region Ⅱ, where we select the left side of the curve of BPCAP. In region Ⅱ, the coupled system exhibits anti-phase spikes within somatic bursters.

    With the increase in ggap, the curves of the AP Hopf bifurcation point, BPCIP, BPCAP, and LPCAP, shift to the left. However, the curves of SN, HC, and the IP Hopf bifurcation point remain unchanged. More specifically, when ggap is roughly equivalent to 1.3 nS, the curve of BPCIP finally merges with the curve of HC, which implies that BPCIP finally falls into the point of HC. As ggap continues to increase, the curve of BPCAP finally merges with the curve of LPCAP, which means that BPCAP finally falls into the point of LPCAP. If ggap is less than 1.3 nS, the trajectory of the coupled system must be located in region Ⅱ, and the somatic bursters must be anti-phase spikes, such as the cases in Figure 5(a) and (b). When ggap is up to 1.3 nS, the trajectory of coupled system is located in region Ⅰ, and BPCIP has disappeared but BPCAP has not. The somatic bursters are in-phase spikes, as shown in Figure 5(c). If ggap continues to increase, the trajectory of the coupled system is still located in region Ⅰ, and the somatic bursters are still in-phase spikes. However, BPCAP gradually merges with LPCAP and disappears, as shown in Figure 5(d).

    In Section 3.2, we discussed the synchronization of spikes in the somatic bursters. The synchronization of dendritic bursters in mixed bursters should be also considered. We next select a period to investigate the synchronization of somatic and dendritic bursters. The phase difference sequences for one period are shown in Figure 7. When ggap is 0.2 nS, the first four columns of Δϕ(t) show the phase differences for four somatic bursters, and the last column shows the phase difference for a dendritic burster, as shown in Figure 7(a). Δϕ(t) of the somatic bursters is π. However, not all the values of Δϕ(t) for the dendritic burster are π. Some were less than π and greater than 0. This implies that the somatic bursters are in the anti-phase spike state, and that the former part of the dendritic burster has started to transition from anti-phase spikes to in-phase spikes. As ggap increases to 0.7 nS, the somatic bursters still remain in the anti-phase spike state. However, the dendritic burster almost reaches in-phase spike synchronization, because Δϕ(t) is close to zero except a little part of it, as shown in Figure 7(b). As ggap continues to increase, the somatic bursters have started to transition from anti-phase spikes to in-phase spikes, and the dendritic burster has almost reached in-phase spike synchronization (Figure 7(c)). When ggap is 1.3 nS, Δϕ(t) remains at zero during one period (Figure 7(d)), and all the bursters reach in-phase synchronization. Based on the phase difference sequences for one period, we conclude that the time at which spike synchronization occurs within the dendritic bursters is earlier than that within the somatic bursters.

    Figure 7.  Phase difference sequences for one complete period with gsyne fixed at 2 nS: (a) ggap=0.2 (nS), (b) ggap=0.7 (nS), (c) ggap=1 (nS), and (d) ggap=1.3 (nS).

    With [Ca]tot=gCANf([Ca]) [22] set as the slow parameter, we perform the bifurcation analysis to explain why in-phase spike synchronization within dendritic bursters occurs earlier than within somatic bursters. The abrupt increase in [Ca]tot leads to the beginning of the dendritic burster, and the gating variable h that originally increases also decreases, as shown in Figure 8(a). When h decreases to the lowest point, it begins to increase, and the dendritic burster ends. The parameters are the same as those in Figure 7(b), so the dendritic burster is in-phase but the somatic bursters are not. With the increase in [Ca]tot, the bifurcation points of SN, HC, BPCIP, LPCAP, and BPCAP move in the direction of h decreasing, as shown in Figure 8(b). As described above, the anti-phase solution begins at SN and ends at LPCAP, and the anti-phase solution is stable on the left side of BPCAP. Thus, there must be an anti-phase solution in region Ⅱ. The in-phase solution is stable on the right side of BPCIP, so there must be an in-phase solution in region Ⅰ. The trajectory of the somatic bursters lies between the curves LPCAP and SN in region Ⅱ. This means that the somatic bursters are anti-phase spikes. When [Ca]tot increases to about 0.4 nS, the dendritic burster appears, and the trajectory is only in region Ⅰ, which indicates that the dendritic burster is in an in-phase spike state. The beginning of h increasing corresponds to the end of the dendritic burster. However, before the end of the dendritic burster, a small part of the trajectory falls in region Ⅱ, which explains why a small part of the dendritic burster is in an anti-phase spike state (Figure 8(b)). The rapid jump of [Ca]tot caused the trajectory to transition from region Ⅱ to region Ⅰ, which is the reason that the synchronization of in-phase spikes within the dendritic bursters occurs earlier than within the somatic bursters.

    Figure 8.  (a) Time sequence diagram of V, h, and [Ca]tot. The olive curve represents V, the blue curve represents h, and the red curve represents [Ca]tot. (b) Two-parameter bifurcation diagram of the curves of SN, HC, BPCIP, LPCAP, and BPCAP, where gsyne is 2 nS and ggap is 0.7 nS, region Ⅰ: In-phase solution; region Ⅱ: Anti-phase solution.

    The somatic bursters transition from anti-phase spikes to in-phase spikes, then they change into asymmetric periodic somatic bursters. The amplitude of the somatic burster for V1 is not the same as that for V2, as shown in Figures 9(a) and (b). The amplitude of the first somatic burster (V1) in Figure 9(a) is smaller than that of the first somatic burster (V2) in Figure 9(b). However, the result is opposite for the second somatic burster. At the same time, it should be noted that the type of the first somatic burster for V1 is the same as that of the second somatic burster for V2, and that the type of second somatic burster for V1 is the same as that of the first somatic burster for V2.

    Figure 9.  Time sequence diagrams for asymmetric periodic somatic bursters, where gsyne is 2 nS and ggap is 1.15 nS. The olive curve represents V, and the red curve represents [Ca].

    Using fast/slow decomposition and bifurcation analysis, we analyze the asymmetric periodic somatic bursters in Figures 9(a) and (b). By extending BPCIP, we obtain two new pairs of stable branches that start at BPCIP and end at BPCAP, as shown in Figure 10(a) and (b). The violet and cyan curves represent maximum and minimum values of the stable limit cycles. The branch with a smaller amplitude (violet curve) is denoted as the s-ASP branch, and the branch with a larger amplitude (cyan curve) is denoted as the g-ASP branch.

    Figure 10.  Bifurcation diagrams of the fast subsystem for the first asymmetric periodic somatic burster in Figures 9 (a) and (b).

    We select the first somatic bursters of V1 and V2 in Figure 9(a) and (b) to analyze the dynamic bifurcation mechanisms of the asymmetric periodic somatic bursters. For the first somatic burster of V1, the asymmetric burster starts at SN and moves to the left along the stable s-ASP branch. It continues to move to the left along the stable AP branch when it passes through BPCAP. The asymmetric burster terminates at LPCAP, which is same behavior as that of the bursters in which spikes are anti-phase, as shown in Figure 10(a). The asymmetric burster for the first somatic burster of V2 also starts at SN and then moves to the left along the stable g-ASP branch. It continues to move to the left along the stable AP branch when it passes through BPCAP. The asymmetric burster terminates at LPCAP, as does the burster in which spikes are anti-phase, as shown in Figure 10(b). This results in asymmetric periodic somatic bursters. Based on the above analysis, we infer that the mechanisms for the second somatic burster of V1 are same as that for the first somatic burster of V2, and the mechanisms for the second somatic burster of V2 are same as those for the first somatic burster of V1.

    We have shown the effects of the electrical and synaptic coupling strength on the in-phase and anti-phase spikes within mixed bursters in the coupled neuronal system of the pre-BötC model. The results show that increasing the electrical coupling accelerates the synchronization of in-phase spikes and changes the number of somatic bursters for mixed bursters in one period. Increasing the synaptic coupling delays the synchronization of in-phase spikes and changes the number of somatic bursters for mixed bursters in one period at the same time. Using fast/slow and bifurcation analysis methods, we analyze the dynamic mechanisms of the in-phase and anti-phase solutions for the coupled system. The in-phase spike synchronization within mixed bursters is largely mediated by the stability of the AP branch. Increasing the electrical coupling leads to movement of BPCIP, causing the IP branch to lose stability. The result is similar to that of anti-phase spikes within mixed bursters. This leads to the bistable region, which consists of a stable AP branch and stable equilibrium points, changing into one that consists of a stable IP branch and stable equilibrium points. Correspondingly, the mixed bursters of the anti-phase spikes turn into the ones of in-phase spikes. Based on this result, we investigate the influence of the second bifurcation parameter ggap on some key bifurcation points. According to the bifurcation mechanisms of the IP and AP branches, the two-parameter bifurcation plane is divided into in-phase and anti-phase solution regions. With the increase in parameter ggap, the trajectory of the coupled system transitions from an anti-phase solution region to an in-phase solution region. The in-phase spike synchronization of the dendritic bursters occurs earlier than that of the somatic bursters.

    The oscillation of intracellular Ca2+ concentration in the dendrite gives rise to dendritic bursters. At the same time, the oscillation of intracellular Ca2+ causes the trajectory of the system to enter the region in which the solution is in-phase in advance, after which it transitions into the region in which the solution is anti-phase with the decrease in the oscillation of the intracellular Ca2+ concentration. The calcium-activated nonspecific cationic current keeps a lower value when the firing pattern of neurons is a somatic burster pattern. For dendritic bursters, the calcium-activated nonspecific cationic current abruptly increases. Therefore, we conclude that the calcium-activated nonspecific cationic current could facilitate the in-phase spike synchronization for mixed bursters.

    Our simulations also show that increasing the strength of the electrical coupling from a lower value (corresponding to in-phase spikes) to a higher value (corresponding to anti-phases spikes) causes a transition solution (asymmetric periodic somatic bursters). The IP branch is initially stable, but loses its stability through BPCIP. The bifurcation point of BPCIP gives rise to two new pairs of stable periodic branches. This leads to different dynamic mechanisms for the in-phase and bursters in which spikes are anti-phase. The AP branch is initially unstable, but becomes stable by BPCAP. By coincidence, these two pairs of branches end up at BPCAP. This explains why the asymmetric periodic solution is produced in the transition process between in-phase and anti-phase spikes.

    This work is supported by the National Natural Science Foundation of China (Grant No. 11872003) and North China University of Technology Research Fund Program for Key Discipline (No. 110052972027/014). The authors are grateful to all the reviewers for their constructive comments.

    There is no conflicts of interest in this paper.

    [1] Czyperek M, Zapp P, Bouwmeester H, et al. (2010) Gas separation membranes for zero-emission fossil power plants: MEM-BRAIN. J Membr Sci 359: 149–159. doi: 10.1016/j.memsci.2010.04.012
    [2] Smart S, Liu S, Serra J, et al. (2014) Perovskite membrane reactors: fundamentals and applications for oxygen production, syngas production and hydrogen processing. In: Gugliuzza A, Basile A, Membranes for Clean and Renewable Power Applications, 1 Eds., Cambridge, UK:Woodhead Publishing, 182–217.
    [3] Benson SJ, Waller D, Kilner JA (1999) Degradation of La0:6Sr0:4Fe0:8O3-δ in carbon dioxide and water atmospheres. J Electrochem Soc 146: 1305–1309. doi: 10.1149/1.1391762
    [4] Yi J, Feng S, Zuo Y, et al. (2005) Oxygen Permeability and Stability of Sr0:95Co0:8Fe0:2O3-δ in a CO2- and H2O-Containing Atmosphere. Chem Mater 17: 5856–5861. doi: 10.1021/cm051636y
    [5] Yan A, Cheng M, Dong Y, et al. (2006) Investigation of a Ba0.5Sr0.5Co0.8Fe0.2O3 based cathode IT-SOFC: I. The effect of CO2 on the cell performance. Appl Catal B 66: 64–71.
    [6] Arnold M, Wang H, Feldhoff A (2007) Influence of CO2 on the oxygen permeation performance and the microstructure of perovskite-type (Ba0:5Sr0:5)(Co0:8Fe0:2)O3-δ membranes. J Membr Sci 293: 44–52. doi: 10.1016/j.memsci.2007.01.032
    [7] Waindich A, M?bius A, Müller M (2009) Corrosion of Ba1xSrxCo1yFeyO3-δ and La0:3Ba0:7Co0:2Fe0:2O3-δ materials for oxygen separating membranes under Oxycoal conditions. J Membr Sci 337: 182–187. doi: 10.1016/j.memsci.2009.03.041
    [8] Engels S, Markus T, Modigell M, et al. (2011) Oxygen permeation and stability investigations on MIEC membrane materials under operating conditions for power plant processes. J Membr Sci 370: 58–69. doi: 10.1016/j.memsci.2010.12.021
    [9] Song CL, Yi JX (2015) Influence of CO2 on Oxygen Surface Exchange Kinetics of Mixed-Conducting Ba0:5Sr0:5Co0:8Fe0:2O3-δ Oxide. Chinese J Chem Phys 28: 203–205. doi: 10.1063/1674-0068/28/cjcp1412203
    [10] Wang H, K?lsch P, Schiestel T, et al. (2006) Production of high-purity oxygen by perovskite hollow fiber membranes swept with steam. J Membr Sci 284: 5–8. doi: 10.1016/j.memsci.2006.07.043
    [11] Leo A, Liu S, Diniz da Costa JC (2011) Production of pure oxygen from BSCF hollow fiber membranes using steam sweep. Sep Purif Technol 78: 220–227. doi: 10.1016/j.seppur.2011.02.006
    [12] Wang R, Meng B, Meng X, et al. (2015) Highly stable La0:6Sr0:4Co0:2Fe0:2O3-δ hollow fibre membrane for air separation swept by steam or steam mixture. J Membr Sci 479: 232–239. doi: 10.1016/j.memsci.2015.01.006
    [13] Wang Z, Kathiraser Y, Ang ML, et al. (2015) High Purity Oxygen Production via BBCN Perovskite Hollow Fiber Membrane Swept by Steam. Ind Eng Chem Res 54: 6371–6377. doi: 10.1021/acs.iecr.5b01183
    [14] Teraoka Y, Zhang H, Furukawa S, et al. (1985) Oxygen permeation through perovskite-type oxides. Chem Lett 14: 1743–1746. doi: 10.1246/cl.1985.1743
    [15] Baumann S, Serra J, Lobera M, et al. (2011) Ultrahigh oxygen permeation flux through supported Ba0:5Sr0:5Co0:8Fe0:2O3-δ membranes. J Membr Sci 377: 198–205. doi: 10.1016/j.memsci.2011.04.050
    [16] Mogensen M, Sammes N, Tompsett G (2000) Physical, chemical and electrochemical properties of pure and doped ceria. Solid State Ionics 129: 63–94. doi: 10.1016/S0167-2738(99)00318-5
    [17] Ten Elshof J, Bouwmeester H, Verweij H (1995) Oxygen transport through La1xSrxFeO3 membranes. I. Permeation in air/He gradients. Solid State Ionics 81: 97–109. doi: 10.1016/0167-2738(95)00177-8
    [18] Sunarso J, Baumann S, Serra J, et al. (2008) Mixed ionicelectronic conducting (MIEC) ceramicbased membranes for oxygen separation. J Membr Sci 320: 13–41. doi: 10.1016/j.memsci.2008.03.074
    [19] Shao Z, Yang W, Cong Y, et al. (2000) Investigation of the permeation behavior and stability of a Ba0:5Sr0:5Co0:8Fe0:2O3-δ oxygen membrane. J Membr Sci 172: 177–188. doi: 10.1016/S0376-7388(00)00337-9
    [20] Serra J, Garcia-Fayos J, Baumann S, et al. (2013) Oxygen permeation through tape-cast asymmetric all-La0:6Sr0:4Co0:2Fe0:2O3-δ membranes. J Membr Sci 447: 297–305. doi: 10.1016/j.memsci.2013.07.030
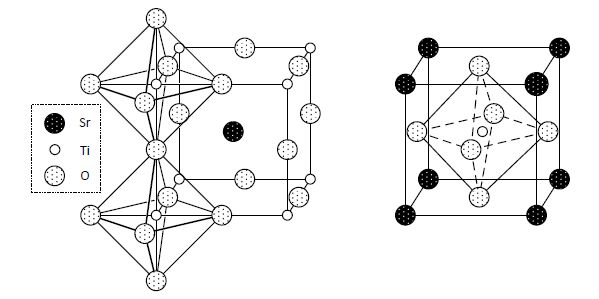
    [21] Goldschmidt, V (1926) Die Gesetze der Krystallochemie. Die Naturwissenschaften 21: 477–485.
    [22] Bhalla, A, Ruyan G, and Rustum R (2000) The perovskite structure - a review of its role in ceramic science and technology. Mater Res Innovations 4: 3–26. doi: 10.1007/s100190000062
    [23] Bouwmeester H, Burggraaf A (1996) Chapter 10 – Dense ceramic membranes for oxygen separation. In: Burggraaf, A. J. and Cot, L. , Membrane Science and Technology Series, 4, Amsterdam, NL: Elsevier, 435–528.
    [24] Huggett L, Piper L (1966) Materials technology in steam reforming processes : proceedings (ed. C. Edeleanu). Materials Technology Symposium Proceedings(1964 : Billingham Eng.) Oxford ; New York : Symposium Publications Division, Pergamon Press, 337.
  • This article has been cited by:

    1. Feibiao Zhan, Jian Song, Shenquan Liu, The influence of synaptic strength and noise on the robustness of central pattern generator, 2024, 32, 2688-1594, 686, 10.3934/era.2024033
    2. Lixia Duan, Xueli Chen, Luyuan Xia, Zhihui Wang, Dynamics and control of mixed bursting in nonlinear pre-Bötzinger complex systems, 2024, 112, 0924-090X, 8539, 10.1007/s11071-024-09473-3
    3. Xue-Li Chen, Lu-Yuan Xia, Zhi-Hui Wang, Li-Xia Duan, Analysis of mixed rhythm and its dynamics in closed-loop respiratory control system driven by electromagnetic induction, 2024, 73, 1000-3290, 180502, 10.7498/aps.73.20240847
  • Reader Comments
  • © 2016 the Author(s), licensee AIMS Press. This is an open access article distributed under the terms of the Creative Commons Attribution License (http://creativecommons.org/licenses/by/4.0)
通讯作者: 陈斌, bchen63@163.com
  • 1. 

    沈阳化工大学材料科学与工程学院 沈阳 110142

  1. 本站搜索
  2. 百度学术搜索
  3. 万方数据库搜索
  4. CNKI搜索

Metrics

Article views(6249) PDF downloads(1057) Cited by(3)

Figures and Tables

Figures(7)

/

DownLoad:  Full-Size Img  PowerPoint
Return
Return

Catalog