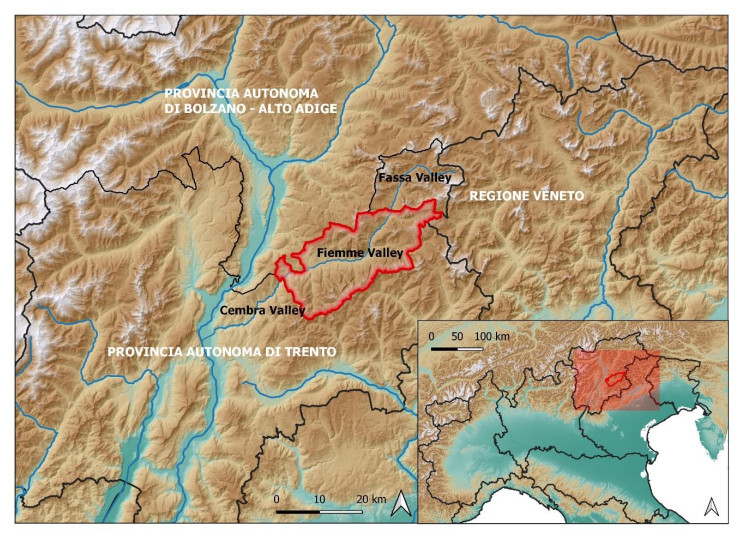
The importance of past human activities in determining the extent and composition of current woodland cover has long been recognized. Understanding the environmental dynamics that have characterized vegetation over time, as well as the productive rural practices associated with them, can have significant repercussion on the current and future management of environmental resources. Scholars have identified a significant shift in woodland exploitation regimes in Europe, occurring between the late 18th and early 19th centuries. During this period, several states introduce modern forestry which gradually replaced local agro-silvo-pastoral structures. Geohistorical sources can help reconstruct these previous management systems and provide information on past environments. This paper has two main objectives: to increase knowledge of environmental and landscape dynamics in the Alpine context through a specific case study, and demonstrate the potential of geographic information systems (GIS) software in handling geohistorical sources. The case study of Val di Fiemme (Italy) has been chosen for two reasons: it is an area that has high forest presence and peculiar vegetation cover and the local archive contains a great deal of documentation. Specifically, the documents drafted by an Austrian Commission for forest management in the 18th century have been interpreted as an attempt by the Habsburg Crown to restructure the valley towards a timber economy. Documentation was collected, digitized, and mapped to build a historical GIS, showing woodland ownership status, tree species, and practices in the 18th century. As a result, a socio-ecological system was identified that significantly differs from the current one, revealing a greater diversity of species. The establishment of Habsburg norms represents a watershed in forest management with direct environmental effects that can be seen over the subsequent century. In conclusion, the study demonstrates the potential of using GIS-based approaches to analyze textual geohistorical sources and extend the analyzed diachrony to periods prior to the geometrical cartographic ones.
Citation: Nicola Gabellieri, Ettore Sarzotti. Forest planning, rural practices, and woodland cover in an 18th-century Alpine Valley (Val di Fiemme, Italy): A geohistorical and GIS-based approach to the history of environmental resources[J]. AIMS Geosciences, 2024, 10(4): 767-791. doi: 10.3934/geosci.2024038
The importance of past human activities in determining the extent and composition of current woodland cover has long been recognized. Understanding the environmental dynamics that have characterized vegetation over time, as well as the productive rural practices associated with them, can have significant repercussion on the current and future management of environmental resources. Scholars have identified a significant shift in woodland exploitation regimes in Europe, occurring between the late 18th and early 19th centuries. During this period, several states introduce modern forestry which gradually replaced local agro-silvo-pastoral structures. Geohistorical sources can help reconstruct these previous management systems and provide information on past environments. This paper has two main objectives: to increase knowledge of environmental and landscape dynamics in the Alpine context through a specific case study, and demonstrate the potential of geographic information systems (GIS) software in handling geohistorical sources. The case study of Val di Fiemme (Italy) has been chosen for two reasons: it is an area that has high forest presence and peculiar vegetation cover and the local archive contains a great deal of documentation. Specifically, the documents drafted by an Austrian Commission for forest management in the 18th century have been interpreted as an attempt by the Habsburg Crown to restructure the valley towards a timber economy. Documentation was collected, digitized, and mapped to build a historical GIS, showing woodland ownership status, tree species, and practices in the 18th century. As a result, a socio-ecological system was identified that significantly differs from the current one, revealing a greater diversity of species. The establishment of Habsburg norms represents a watershed in forest management with direct environmental effects that can be seen over the subsequent century. In conclusion, the study demonstrates the potential of using GIS-based approaches to analyze textual geohistorical sources and extend the analyzed diachrony to periods prior to the geometrical cartographic ones.

| [1] | Kirby KJ, Watkins C (1998) Ecological History of European Forests, Oxon UK, New York, CAB International. |
| [2] |
Szabó P (2015) Historical ecology: past, present and future. Biol Rev 90: 997–1014. https://doi.org/10.1111/brv.12141 doi: 10.1111/brv.12141

|
| [3] |
Szabó P, Müllerová J, Suchánková S, et al. (2015) Intensive woodland management in the Middle Ages: spatial modelling based on archival data. J Hist Geogr 48: 1–10. https://doi.org/10.1016/j.jhg.2015.01.005 doi: 10.1016/j.jhg.2015.01.005
|
| [4] |
Bürgi M, Ö stlund L, Mladenoff DJ (2017) Legacy Effects of Human Land Use: Ecosystems as Time-Lagged Systems. Ecosystems 20: 94–103. https://doi.org/10.1007/s10021-016-0051-6 doi: 10.1007/s10021-016-0051-6
|
| [5] | Allende Álvarez F, Gomez-Mediavilla G, López-Estébanez N (2019) Silvicultures—Management and Conservation, IntechOpen. |
| [6] | Agnoletti M (2018) Storia del bosco: il paesaggio forestale italiano, Bari, Laterza. Italian. |
| [7] |
Paniagua A (2021) Countryside, landscape and heritage in (new) historical Geography: Some considerations in the current geographical tendencies. AIMS Geosci 7: 291–299. https://doi.org/10.3934/geosci.2021017 doi: 10.3934/geosci.2021017
|
| [8] | Rackham O (1980) Ancient woodland: its history, vegetation and uses in England, London, Arnold. |
| [9] |
Rackham O (2000) Prospects for Landscape History and Historical Ecology. Landscapes 1: 3–17. https://doi.org/10.1179/lan.2000.1.2.3 doi: 10.1179/lan.2000.1.2.3
|
| [10] | Grove AT, Rackham O (2001) The Nature of Mediterranean Europe: an ecological history, New Haven, Yale University Press. |
| [11] | Rotherham ID, Moody JA (2024) Countryside History. The Life and Legacy of Oliver Rackham, London, Pelagic Publishing. |
| [12] |
Agnoletti M, Rotherham ID (2015) Landscape and biocultural diversity. Biodivers Conserv 24: 3155–3165. https://doi.org/10.1007/s10531-015-1003-8 doi: 10.1007/s10531-015-1003-8
|
| [13] |
Szabó P, Hédl R (2011) Advancing the Integration of History and Ecology for Conservation: History, Ecology, and Conservation. Conserv Biol 25: 680–687. https://doi.org/10.1111/j.1523-1739.2011.01710.x doi: 10.1111/j.1523-1739.2011.01710.x
|
| [14] |
Eriksson O (2018) What is biological cultural heritage and why should we care about it? An example from Swedish rural landscapes and forests. Nat Conserv 28: 1–32. https://doi.org/10.3897/natureconservation.28.25067 doi: 10.3897/natureconservation.28.25067
|
| [15] |
Fischer AP (2018) Forest landscapes as social-ecological systems and implications for management. Landscape Urban Plann 177: 138–147. https://doi.org/10.1016/j.landurbplan.2018.05.001 doi: 10.1016/j.landurbplan.2018.05.001
|
| [16] | Moreno D, Cevasco R, Pescini V, et al. (2019) The Archeology of Woodland Ecology: Reconstructing Past Woodmanship Practices of Wooded Pasture Systems in Italy, In: Allende Álvarez F, Gomez-Mediavilla G, López-Estébanez N, Editors, Silvicultures—Management and Conservation, IntechOpen. |
| [17] |
Cevasco R, Moreno D, Hearn R (2015) Biodiversification as an historical process: an appeal for the application of historical ecology to bio-cultural diversity research. Biodivers Conserv 24: 3167–3183. https://doi.org/10.1007/s10531-015-0943-3 doi: 10.1007/s10531-015-0943-3
|
| [18] |
Bürgi M, Gimmi U, Stuber M (2013) Assessing traditional knowledge on forest uses to understand forest ecosystem dynamics. For Ecol Manage 289: 115–122. https://doi.org/10.1016/j.foreco.2012.10.012 doi: 10.1016/j.foreco.2012.10.012
|
| [19] |
Bürgi M, Gimmi U (2007) Three objectives of historical ecology: the case of litter collecting in Central European forests. Landscape Ecol 22: 77–87. https://doi.org/10.1007/s10980-007-9128-0 doi: 10.1007/s10980-007-9128-0
|
| [20] | Moreno D, Montanari C (2008) Más allá de la percepción: Hacia una ecología histórica del paisaje rural en Italia. Cuadernos Geográficos 43: 29–49. |
| [21] | Cevasco R (2010) The environmental heritage of a past cultural landscape: the alderwoods (Alnus incana Moench) in the upper Aveto Valley (NW Apennines), In: Armiero M, Hall M, Editors, Nature and History in Modern Italy, Athens, OH, Ohio University Press, 126–140. |
| [22] | Gabellieri N (2021) Il patrimonio bio-culturale alpino: un approccio geografico-storico al pascolo alberato di larici in Trentino (XVⅢ-XXI sec.). Rivista Geografica Italiana 128: 82–104. Italian. https://doi.org/10.3280/rgioa3-2021oa12533 |
| [23] | Persic A, Martin G (2008) Links between biological and cultural diversity: report of the International Workshop. International Workshop on Links between Biological and Cultural Diversity: Concepts, Methods and Experiences, Paris, 2007 organized by UNESCO. |
| [24] | UNESCO-SCBD (2014) Florence Declaration on the Links Between Biological and Cultural Diversity. Available from: https://www.cbd.int/portals/culturaldiversity/docs/21040410-declaration-florence-en.pdf. |
| [25] | Bhati HV, Epstein Y (2023) Protection of Biocultural Heritage in the Anthropocene: Towards Reconciling Natural, Cultural, Tangible and Intangible Heritage. J Environ Law 35: 353–375 |
| [26] |
Virtanen PK (2019) Ancestors' times and protection of Amazonian Indigenous biocultural heritage. AlterN Int J Indigenous Peoples 15: 330–339. https://doi.org/10.1177/1177180119893132 doi: 10.1177/1177180119893132
|
| [27] |
Rotherham ID (2015) Bio-cultural heritage and biodiversity: emerging paradigms in conservation and planning. Biodivers Conserv 24: 3405–3429. https://doi.org/10.1007/s10531-015-1006-5 doi: 10.1007/s10531-015-1006-5
|
| [28] |
Zacharová J, Riezner J, Elznicová J, et al. (2022) Historical Agricultural Landforms—Central European Bio-Cultural Heritage Worthy of Attention. Land 11: 963. https://doi.org/10.3390/land11070963 doi: 10.3390/land11070963
|
| [29] | Pathak A (2002) Law, Strategies, Ideologies: Legislating Forests in Colonial India. Oxford University Press. |
| [30] |
Kotilainen J, Rytteri T (2011) Transformation of forest policy regimes in Finland since the 19th century. J Hist Geogr 37: 429–439. https://doi.org/10.1016/j.jhg.2011.04.003 doi: 10.1016/j.jhg.2011.04.003
|
| [31] |
Barrera De La Torre G, De La Torre Villalpando G (2022) Guarding the colonial woodlands: A genealogy of forest conservation discourses in late Bourbon's period in new Spain (Mexico). J Hist Geogr 78: 105–114. https://doi.org/10.1016/j.jhg.2022.06.002 doi: 10.1016/j.jhg.2022.06.002
|
| [32] | Scott JC (1998) Seeing Like a State: How Certain Schemes to Improve the Human Condition Have Failed. New Haven, Yale University Press. |
| [33] | Moreno D (1990) Dal documento al terreno: storia e archeologia dei sistemi agro-silvo-pastorali. Bologna, Il Mulino. Italian. |
| [34] | Sansa R (2000) Il mercato e la legge: la legislazione forestale italiana nei secoli XVⅢ e XIX, In: Bevilacqua P, Corona G, Editors, Ambiente e risorse nel Mezzogiorno contemporaneo, Corigliano Calabro, Meridiana libri, 2–26. Italian. |
| [35] |
Agnoletti M (2006) Man, forestry, and forest landscapes. Trends and perspectives in the evolution of forestry and woodland history research. Schweiz Z Forstwes 157: 384–392. https://doi.org/10.3188/szf.2006.0384 doi: 10.3188/szf.2006.0384
|
| [36] |
Hölzl R (2010) Historicizing Sustainability: German Scientific Forestry in the Eighteenth and Nineteenth Centuries. Sci Cult-UK 19: 431–460. https://doi.org/10.1080/09505431.2010.519866 doi: 10.1080/09505431.2010.519866
|
| [37] |
Watkins C (1984) The use of Forestry Commission censuses for the study of woodland change. J Hist Geogr 10: 396–406. https://doi.org/10.1016/0305-7488(84)90071-9 doi: 10.1016/0305-7488(84)90071-9
|
| [38] |
Beglane F (2018) Forests and chases in medieval Ireland, 1169-c.1399. J Hist Geogr 59: 90–99. https://doi.org/10.1016/j.jhg.2017.11.002 doi: 10.1016/j.jhg.2017.11.002
|
| [39] |
Bergès L, Dupouey J (2021) Historical ecology and ancient forests: Progress, conservation issues and scientific prospects, with some examples from the French case. J Veg Sci 32: 1–17. https://doi.org/10.1111/jvs.12846 doi: 10.1111/jvs.12846
|
| [40] |
Cillis G, Statuto D, Picuno P (2021) Historical GIS as a Tool for Monitoring, Preserving and Planning Forest Landscape: A Case Study in a Mediterranean Region. Land 10: 851. https://doi.org/10.3390/land10080851 doi: 10.3390/land10080851
|
| [41] |
Dai Prà E, Gabellieri N (2021) Geostoria applicata del bosco e fonti cartografiche geodetiche e pre-geodetiche: casi studio di foreste trentine colpite dalla tempesta Vaia. Bollettino dell'Associazione Italiana di Cartografia 173: 16–30. https://doi.org/10.13137/2282-572X/33625 doi: 10.13137/2282-572X/33625
|
| [42] |
Bonan G (2016) The communities and the comuni: The implementation of administrative reforms in the Fiemme Valley (Trentino, Italy) during the first half of the 19th century. Int J Commons 10: 589. https://doi.org/10.18352/ijc.741 doi: 10.18352/ijc.741
|
| [43] | Ministero dell'Ambiente e della Sicurezza Energetica (IT) Geoportale Nazionale, Digital Terrain Model. Available from: https://gn.mase.gov.it/portale/wcs. |
| [44] | Pettenella DM (1998) L'ecocertificazione della Magnifica Comunità di Fiemme. Sherwood Foreste ed alberi oggi 4: 43–48. Italian. |
| [45] | Gabellieri N (2019) Il paesaggio scomparso della gelsicoltura in Vallagarina: un approccio geografico-storico a fonti integrate. Geostorie 27: 57–78. Italian. |
| [46] | Mariani MA (1673) Trento con il Sacro Concilio et altri notabili. Aggiunte varie cose miscellanee universali. Descrittion' historica libri tre, di D. Michel' Angelo Mariani. Con un ristretto del Trentin Vescovato, l'indice delle cose notabili e le figure in rame, Augusta, L'Ariete. |
| [47] | Franceschini I (2016) Le paludi dell'Adige. Diritti di sfruttamento e tentativi di bonifica tra XⅢ e XV secolo, In: Rovigo V, Editor, Il fiume, le terre, l'immaginario. L'Adige come fenomeno storiografico complesso, Rovereto, Accademia Roveretana degli Agiati, Edizioini Osiride, 251–272. Italian. |
| [48] | Nequirito M (2010) La montagna condivisa: l'utilizzo collettivo dei boschi e dei pascoli in Trentino dalle riforme settecentesche al primo Novecento. Milano, Giuffrè. Italian. |
| [49] | Martellozzo N (2021) Condividere il bosco. Un confronto tra regimi del patrimonio in Val di Fiemme. EtnoAntropologia 8: 33–50. Italian. |
| [50] | Nequirito M (2015) Le 'Regole' nel Trentino dall'Antico Regime alla realtà contemporanea, Predazzo, Regola Feudale di Predazzo. Italian. |
| [51] | Azzari M, Berti C, Dolfi L (2023) Usi del suolo e superfici boscate: dinamiche in Val di Fiemme, In: Banini T, Editor, MAESTRI (Museo virtuaAlE dei Saperi e delle Tecniche popolaRI). Il progetto-pilota sui boschi della Magnifica Comunità di Fiemme, Roma, Società geografica italiana, 121–160. Italian. |
| [52] | Piussi P (1965) Alcune osservazioni ed esperienze sulla rinnovazione naturale della Picea nella foresta di Paneveggio (Trento). Annali Accademia Italiana di Scienze Forestali 14: 345–400. Italian. |
| [53] | Piussi P (1977) Problemi di Ecologia Nei Boschi di Picea Delle Alpi: Il Punto di Vista di un Forestale. Bolletino di zoologia 44: 87–96. Italian. https://doi.org/10.1080/11250007709430156 |
| [54] | Berretti R, Lingua E, Motta R, et al. (2004) Classificazione strutturale dei popolamenti forestali nella Riserva forestale integrale della Valbona a Paneveggio (TN). Ital For Mont 59: 99–118. Italian. |
| [55] | Dellagiacoma F, Motta R, Piussi P (1996) Ricerche sull'ecologia della pecceta subalpina nella foresta di Paneveggio (TN). Dendronatura 17: 77–86. Italian. |
| [56] |
Motta R, Nola P, Piussi P (2002) Long‐term investigations in a strict forest reserve in the eastern Italian Alps: spatio‐temporal origin and development in two multi‐layered subalpine stands. J Ecol 90: 495–507. https://doi.org/10.1046/j.1365-2745.2002.00685.x doi: 10.1046/j.1365-2745.2002.00685.x
|
| [57] |
Tattoni C, Ciolli M, Ferretti F, et al. (2010) Monitoring spatial and temporal pattern of Paneveggio forest (northern Italy) from 1859 to 2006. IFOREST 3: 72–80. https://doi.org/10.3832/ifor0530-003 doi: 10.3832/ifor0530-003
|
| [58] | Agnoletti M (1998) Segherie e foreste nel Trentino: dal Medioevo ai nostri giorni, Museo di San Michele All'Adige. Italian. |
| [59] | Regole della Val di Fiemme (Regole of Val di Fiemme) (1788 1787) Located at: ASPT, Trento, IT; Amministrazioni delle foreste di Fiemme, Fassa e Primiero, Carteggio ed atti, sc. 11–13, f. 15.1.12. Italian. |
| [60] | Atti della Commissione (Commission Proceedings) (1789 1787) Located at: ASPT, Trento, IT; Amministrazioni delle foreste di Fiemme, Fassa e Primiero, Carteggio ed atti, sc. 34–38, f. 1.3.34. Italian. |
| [61] | Atti dell'indagine della commissione sullo stato dei boschi)Proceedings of the investigation of the commitee on the state of the forest) (1789 1787) Located at: AMCF, Cavalese, IT; Cavalese, Miscellanea, sc. 68, f. 369. Italian. |
| [62] | Regole e diritti della Val di Fiemme (Regole and rights of Val di Fiemme) (1799 1788) Located at: ASPT, Trento, IT; Amministrazioni delle foreste di Fiemme, Fassa e Primiero, Carteggio ed atti, sc. 11–13, f. 15.1.13. Italian. |
| [63] | Bellabarba M (2010) I giudici trentino-tirolesi della Restaurazione: prime ricerche, In: Bellabarba M, Forster E, Heiss H, et al., editors, Eliten in Tirol zwischen Ancien Régime und Vormärz: le élites in Tirolo tra Antico Regime e Vormärz, Innsbruck, Wien, Bolzano, Studien Verlag, 351–366. |
| [64] | Piano e Regolamento (Plan and regulamentation) Located at: ASPT, Trento, IT; f. 1.3.34. Italian. |
| [65] | Cavalesi Coram Commissione Austriaco-Tridentina (Cavalesi Coram Austrian-Tridentine Commission) (15 August 1787) Located at: ASPT, Trento, IT; sc. 11–13, f. 15.1.12. Italian. |
| [66] | QGIS. Available from: http://test.qgis.org/html/en/site/index.html. |
| [67] | Provincia di Trento, Portale Geocartografico Trentino (Trentino Geocartographic Portal), Carta Tecnica Provinciale (Provincial Technical Map), 2020. Available from: http://www.territorio.provincia.tn.it/portal/server.pt/community/carta_tecnica_provinciale/920/carta_tecnica_provinciale/40052. |
| [68] | Mappa dei territori delle Regole, (Map of the territories of the Regole) Located at: AMCF, Cavalese, IT; Fondo cartografico, Miscellanea, b. 11. Italian. |
| [69] | Mappa della Magnifica Comunità, (Map of the Magnifica Comunità) Located at: AMCF, Cavalese, IT; Fondo cartografico, Miscellanea, b. 3. Italian. |
| [70] |
Gregory IN, Kemp KK, Mostern R (2001) Geographical Information and historical research: Current progress and future directions. Hist Comput 13: 7–23. https://doi.org/10.3366/hac.2001.13.1.7 doi: 10.3366/hac.2001.13.1.7
|
| [71] | Taylor JE, Donaldson C, Gregory IN, et al. (2018) Mapping Digitally, Mapping Deep: Exploring Digital Literary Geographies. Lit Geographies 4: 10–19. |
| [72] | Provincia di Trento—Servizio Foreste (IT), Geocatalogo della Provincia Autonoma di Trento (Geocatalogue of the Autonomous Province of Trento), Carta dei tipi forestali reali (Map of real forest types), 2017. Available from: https://siat.provincia.tn.it/geonetwork/srv/ita/catalog.search#/home. |
| [73] | Istituto Nazionale di Statistica (ISTAT), Confini delle unità amministrative, 2024. Available from: https://www.istat.it/notizia/confini-delle-unita-amministrative-a-fini-statistici-al-1-gennaio-2018-2/. |
| [74] | Visita[Survey] (26 August 1787) Located at: ASPT, Trento, IT; sc. 11–13, f. 15.1.12. Italian. |
| [75] | Visita[Survey] (9 June 1788) Located at: ASPT, Trento, IT; sc. 11–13, f. 15.1.12. Italian. |
| [76] | Visita[Survey] (13 May 1788) Located at: ASPT, Trento, IT; sc. 11–13, f. 15.1.12. Italian. |
| [77] | Visita[Survey] (16 September 1787) Located at: ASPT, Trento, IT; sc. 11–13, f. 15.1.12. Italian. |
| [78] | Panecki T, Związek T (2016) The so-called Dutch Colonization in 18 th c. Greater Poland: Research Project on AtlasFontium.pl WebGIS Platform, Riga 2016 Conference Proceedings, Thessaloniki, CartoGeoLab. |
| [79] |
Garbarino M, Weisberg PJ, Motta R (2009) Interacting effects of physical environment and anthropogenic disturbances on the structure of European larch (Larix decidua Mill.) forests. For Ecol Manage 257: 1794–1802. https://doi.org/10.1016/j.foreco.2008.12.031 doi: 10.1016/j.foreco.2008.12.031
|
| [80] |
Garbarino M, Lingua E, Martinez Subirà M, et al. (2011) The larch wood pasture: structure and dynamics of a cultural landscape. Eur J Forest Res 130: 491–502. https://doi.org/10.1007/s10342-010-0437-5 doi: 10.1007/s10342-010-0437-5
|


Figures(7)

Nicola Gabellieri, Ettore Sarzotti. Forest planning, rural practices, and woodland cover in an 18th-century Alpine Valley (Val di Fiemme, Italy): A geohistorical and GIS-based approach to the history of environmental resources[J]. AIMS Geosciences, 2024, 10(4): 767-791. doi: 10.3934/geosci.2024038


 DownLoad: