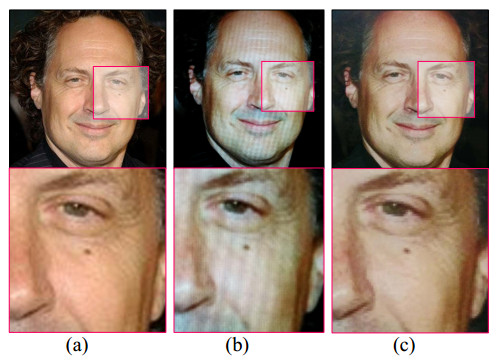
Face anti-spoofing (FAS) is significant for the security of face recognition systems. neural networks (NNs), including convolutional neural network (CNN) and vision transformer (ViT), have been dominating the field of the FAS. However, NN-based methods are vulnerable to adversarial attacks. Attackers could insert adversarial noise into spoofing examples to circumvent an NN-based face-liveness detector. Our experiments show that the CNN or ViT models could have at least an 8% equal error rate (EER) increment when encountering adversarial examples. Thus, developing methods other than NNs is worth exploring to improve security at the system level. In this paper, we have proposed a novel solution for FAS against adversarial attacks, leveraging a deep forest model. Our approach introduces a multi-scale texture representation based on local binary patterns (LBP) as the model input, replacing the grained-scanning mechanism (GSM) used in the traditional deep forest model. Unlike GSM, which scans raw pixels and lacks discriminative power, our LBP-based scheme is specifically designed to capture texture features relevant to spoofing detection. Additionally, transforming the input from the RGB space to the LBP space enhances robustness against adversarial noise. Our method achieved competitive results. When testing with adversarial examples, the increment of EER was less than 3%, more robust than CNN and ViT. On the benchmark database IDIAP REPLAY-ATTACK, a 0% EER was achieved. This work provides a competitive option in a fusing scheme for improving system-level security and offers important ideas to those who want to explore methods besides CNNs. To the best of our knowledge, this is the first attempt at exploiting the deep forest model in the problem of FAS, with the consideration of adversarial attacks.
Citation: Rizhao Cai, Liepiao Zhang, Changsheng Chen, Yongjian Hu, Alex Kot. Learning deep forest for face anti-spoofing: An alternative to the neural network against adversarial attacks[J]. Electronic Research Archive, 2024, 32(10): 5592-5614. doi: 10.3934/era.2024259
Face anti-spoofing (FAS) is significant for the security of face recognition systems. neural networks (NNs), including convolutional neural network (CNN) and vision transformer (ViT), have been dominating the field of the FAS. However, NN-based methods are vulnerable to adversarial attacks. Attackers could insert adversarial noise into spoofing examples to circumvent an NN-based face-liveness detector. Our experiments show that the CNN or ViT models could have at least an 8% equal error rate (EER) increment when encountering adversarial examples. Thus, developing methods other than NNs is worth exploring to improve security at the system level. In this paper, we have proposed a novel solution for FAS against adversarial attacks, leveraging a deep forest model. Our approach introduces a multi-scale texture representation based on local binary patterns (LBP) as the model input, replacing the grained-scanning mechanism (GSM) used in the traditional deep forest model. Unlike GSM, which scans raw pixels and lacks discriminative power, our LBP-based scheme is specifically designed to capture texture features relevant to spoofing detection. Additionally, transforming the input from the RGB space to the LBP space enhances robustness against adversarial noise. Our method achieved competitive results. When testing with adversarial examples, the increment of EER was less than 3%, more robust than CNN and ViT. On the benchmark database IDIAP REPLAY-ATTACK, a 0% EER was achieved. This work provides a competitive option in a fusing scheme for improving system-level security and offers important ideas to those who want to explore methods besides CNNs. To the best of our knowledge, this is the first attempt at exploiting the deep forest model in the problem of FAS, with the consideration of adversarial attacks.

| [1] |
K. Patel, H. Han, A. K. Jain, Secure face unlock: Spoof detection on smartphones, IEEE Trans. Inf. Forensics Secur., 11 (2016), 2268–2283. https://doi.org/10.1109/TIFS.2016.2578288 doi: 10.1109/TIFS.2016.2578288

|
| [2] |
A. Krizhevsky, I. Sutskever, G. E. Hinton, ImageNet classification with deep convolutional neural networks, Commun. ACM, 60 (2017), 84–90. https://doi.org/10.1145/3065386 doi: 10.1145/3065386
|
| [3] | Y. Sun, Y. Chen, X. Wang, X. Tang, Deep learning face representation by joint identification-verification, in Proceedings of the 27th International Conference on Neural Information Processing Systems, 2 (2014), 1988–1996. |
| [4] | A. Dosovitskiy, L. Beyer, A. Kolesnikov, D. Weissenborn, X. Zhai, T. Unterthiner, et al., An image is worth 16$\times$16 words: Transformers for image recognition at scale, preprint, arXiv: 2010.11929. |
| [5] | Z. Liu, Y. Lin, Y. Cao, H. Hu, Y. Wei, Z. Zhang, et al., Swin transformer: Hierarchical vision transformer using shifted windows, in 2021 IEEE/CVF International Conference on Computer Vision (ICCV), (2021), 9992–10002. https://doi.org/10.1109/ICCV48922.2021.00986 |
| [6] | J. Yang, Z. Lei, S. Z. Li, Learn convolutional neural network for face anti-spoofing, preprint, arXiv: 1408.5601. |
| [7] | Z. Xu, S. Li, W. Deng, Learning temporal features using LSTM-CNN architecture for face anti-spoofing, in 2015 3rd IAPR Asian Conference on Pattern Recognition (ACPR), (2016), 141–145. https://doi.org/10.1109/ACPR.2015.7486482 |
| [8] | Z. Yu, C. Zhao, Z. Wang, Y. Qin, Z. Su, X. Li, et al., Searching central difference convolutional networks for face anti-spoofing, in 2020 IEEE/CVF Conference on Computer Vision and Pattern Recognition (CVPR), (2020), 5294–5304. https://doi.org/10.1109/CVPR42600.2020.00534 |
| [9] |
R. Cai, Z. Li, R. Wan, H. Li, Y. Hu, A. C. Kot, Learning meta pattern for face anti-spoofing, IEEE Trans. Inf. Forensics Secur., 17 (2022), 1201–1213. https://doi.org/10.1109/TIFS.2022.3158551 doi: 10.1109/TIFS.2022.3158551
|
| [10] |
R. Cai, Z. Yu, C. Kong, H. Li, C. Chen, Y. Hu, et al., S-adapter: Generalizing vision transformer for face anti-spoofing with statistical tokens, IEEE Trans. Inf. Forensics Secur., 19 (2024), 8385–8397. https://doi.org/10.1109/TIFS.2024.3420699 doi: 10.1109/TIFS.2024.3420699
|
| [11] | R. Cai, Y. Cui, Z. Li, Z. Yu, H. Li, Y. Hu, et al., Rehearsal-free domain continual face anti-spoofing: Generalize more and forget less, in 2023 IEEE/CVF International Conference on Computer Vision (ICCV), (2023), 8003–8014. https://doi.org/10.1109/ICCV51070.2023.00738 |
| [12] |
A. Liu, Z. Tan, Z. Yu, C. Zhao, J. Wan, Y. Liang, et al., FM-ViT: Flexible modal vision transformers for face anti-spoofing, IEEE Trans. Inf. Forensics Secur., 18 (2023), 4775–4786. https://doi.org/10.1109/TIFS.2023.3296330 doi: 10.1109/TIFS.2023.3296330
|
| [13] | C. Szegedy, W. Zaremba, I. Sutskever, J. Bruna, D. Erhan, I. J. Goodfellow, et al., Intriguing properties of neural networks, preprint, arXiv: 1312.6199. |
| [14] | A. Aldahdooh, W. Hamidouche, O. Deforges, Reveal of vision transformers robustness against adversarial attacks, preprint, arXiv: 2106.03734. |
| [15] | A. Kurakin, I. J. Goodfellow, S. Bengio, Adversarial examples in the physical world, preprint, arXiv: 1607.02533. |
| [16] | K. Eykholt, I. Evtimov, E. Fernandes, B. Li, A. Rahmati, C. Xiao, et al., Robust physical-world attacks on deep learning visual classification, in 2018 IEEE/CVF Conference on Computer Vision and Pattern Recognition, (2018), 1625–1634. https://doi.org/10.1109/CVPR.2018.00175 |
| [17] | M. Sharif, S. Bhagavatula, L. Bauer, M. K. Reiter, Accessorize to a crime: Real and stealthy attacks on state-of-the-art face recognition, in Proceedings of the 2016 ACM SIGSAC Conference on Computer and Communications Security, (2016), 1528–1540. https://doi.org/10.1145/2976749.2978392 |
| [18] | Y. Liu, X. Chen, C. Liu, D. Song, Delving into transferable adversarial examples and black-box attacks, preprint, arXiv: 1611.02770. |
| [19] | W. Ma, Y. Li, X. Jia, W. Xu, Transferable adversarial attack for both vision transformers and convolutional networks via momentum integrated gradients, in 2023 IEEE/CVF International Conference on Computer Vision (ICCV), (2023), 4607–4616. https://doi.org/10.1109/ICCV51070.2023.00427 |
| [20] | P. Russu, A. Demontis, B. Biggio, G. Fumera, F. Roli, Secure kernel machines against evasion attacks, in Proceedings of the 2016 ACM workshop on artificial intelligence and security, (2016), 59–69. https://doi.org/10.1145/2996758.2996771 |
| [21] | F. Tramèr, N. Papernot, I. Goodfellow, D. Boneh, P. McDaniel, The space of transferable adversarial examples, preprint, arXiv: 1704.03453. |
| [22] | F. Yang, Z. Chen, Using randomness to improve robustness of machine-learning models against evasion attacks, preprint, arXiv: 1808.03601. |
| [23] | Z. Zhou, J. Feng, Deep forest: Towards an alternative to deep neural networks, in Proceedings of the Twenty-Sixth International Joint Conference on Artificial Intelligence, (2017), 3553–3559. https://doi.org/10.24963/ijcai.2017/497 |
| [24] | J. Maatta, A. Hadid, M. Pietikäinen, Face spoofing detection from single images using micro-texture analysis, in 2011 International Joint Conference on Biometrics (IJCB), (2011), 1–7. https://doi.org/10.1109/IJCB.2011.6117510 |
| [25] | J. Yang, Z. Lei, S. Liao, S. Z. Li, Face liveness detection with component dependent descriptor, in 2013 International Conference on Biometrics (ICB), (2013), 1–6. https://doi.org/10.1109/ICB.2013.6612955 |
| [26] | R. Nosaka, Y. Ohkawa, K. Fukui, Feature extraction based on co-occurrence of adjacent local binary patterns, in Advances in Image and Video Technology, 7088 (2011), 82–91. https://doi.org/10.1007/978-3-642-25346-1_8 |
| [27] | I. Chingovska, A. Anjos, S. Marcel, On the effectiveness of local binary patterns in face anti-spoofing, in 2012 BIOSIG-Proceedings of the International Conference of Biometrics Special Interest Group (BIOSIG), (2012), 1–7. |
| [28] | Y. Atoum, Y. Liu, A. Jourabloo, X. Liu, Face anti-spoofing using patch and depth-based CNNs, in 2017 IEEE International Joint Conference on Biometrics (IJCB), (2017), 319–328. https://doi.org/10.1109/BTAS.2017.8272713 |
| [29] | X. Tan, Y. Li, J. Liu, L. Jiang, Face liveness detection from a single image with sparse low rank bilinear discriminative model, in Computer Vision-ECCV 2010, 6316 (2010), 504–517. https://doi.org/10.1007/978-3-642-15567-3_37 |
| [30] |
D. Gragnaniello, G. Poggi, C. Sansone, L. Verdoliva, An investigation of local descriptors for biometric spoofing detection, IEEE Trans. Inf. Forensics Secur., 10 (2015), 849–863. https://doi.org/10.1109/TIFS.2015.2404294 doi: 10.1109/TIFS.2015.2404294
|
| [31] |
Z. Boulkenafet, J. Komulainen, A. Hadid, Face antispoofing using speeded-up robust features and fisher vector encoding, IEEE Signal Process. Lett., 24 (2017), 141–145. https://doi.org/10.1109/LSP.2016.2630740 doi: 10.1109/LSP.2016.2630740
|
| [32] | T. D. F. Pereira, A. Anjos, J. M. D. Martino, S. Marcel, LBP-TOP based countermeasure against face spoofing attacks, in Computer Vision-ACCV 2012 Workshops, 7728 (2012), 121–132. https://doi.org/10.1007/978-3-642-37410-4_11 |
| [33] |
S. R. Arashloo, J. Kittler, W. Christmas, Face spoofing detection based on multiple descriptor fusion using multiscale dynamic binarized statistical image features, IEEE Trans. Inf. Forensics Secur., 10 (2015), 2396–2407. https://doi.org/10.1109/TIFS.2015.2458700 doi: 10.1109/TIFS.2015.2458700
|
| [34] |
Z. Boulkenafet, J. Komulainen, A. Hadid, Face spoofing detection using colour texture analysis, IEEE Trans. Inf. Forensics Secur., 11 (2016), 1818–1830. https://doi.org/10.1109/TIFS.2016.2555286 doi: 10.1109/TIFS.2016.2555286
|
| [35] |
D. Menotti, G. Chiachia, A. Pinto, W. R. Schwartz, H. Pedrini, A. X. Falcão, et al., Deep representations for iris, face, and fingerprint spoofing detection, IEEE Trans. Inf. Forensics Secur., 10 (2015), 864–879. https://doi.org/10.1109/TIFS.2015.2398817 doi: 10.1109/TIFS.2015.2398817
|
| [36] |
H. Li, P. He, S. Wang, A. Rocha, X. Jiang, A. C. Kot, Learning generalized deep feature representation for face anti-spoofing, IEEE Trans. Inf. Forensics Secur., 13 (2018), 2639–2652. https://doi.org/10.1109/TIFS.2018.2825949 doi: 10.1109/TIFS.2018.2825949
|
| [37] |
R. Cai, H. Li, S. Wang, C. Chen, A. C. Kot, DRL-FAS: A novel framework based on deep reinforcement learning for face anti-spoofing, IEEE Trans. Inf. Forensics Secur., 16 (2020), 937–951. https://doi.org/10.1109/TIFS.2020.3026553 doi: 10.1109/TIFS.2020.3026553
|
| [38] |
W. Sun, Y. Song, C. Chen, J. Huang, A. C. Kot, Face spoofing detection based on local ternary label supervision in fully convolutional networks, IEEE Trans. Inf. Forensics Secur., 15 (2020), 3181–3196. https://doi.org/10.1109/TIFS.2020.2985530 doi: 10.1109/TIFS.2020.2985530
|
| [39] | A. George, S. Marcel, Deep pixel-wise binary supervision for face presentation attack detection, preprint, arXiv: 1907.04047. |
| [40] |
Z. Yu, X. Li, J. Shi, Z. Xia, G. Zhao, Revisiting pixel-wise supervision for face anti-spoofing, IEEE Trans. Biom. Behav. Identity Sci., 3 (2021), 285–295. https://doi.org/10.1109/TBIOM.2021.3065526 doi: 10.1109/TBIOM.2021.3065526
|
| [41] | R. Shao, X. Lan, J. Li, P. C. Yuen, Multi-adversarial discriminative deep domain generalization for face presentation attack detection, in 2019 IEEE/CVF Conference on Computer Vision and Pattern Recognition (CVPR), (2019), 10015–10023. https://doi.org/10.1109/CVPR.2019.01026 |
| [42] |
Y. Qin, Z. Yu, L. Yan, Z. Wang, C. Zhao, Z. Lei, Meta-teacher for face anti-spoofing, IEEE Trans. Pattern Anal. Mach. Intell., 44 (2022), 6311–6326. https://doi.org/10.1109/TPAMI.2021.3091167 doi: 10.1109/TPAMI.2021.3091167
|
| [43] |
Z. Yu, J. Wan, Y. Qin, X. Li, S. Z. Li, G. Zhao, NAS-FAS: Static-dynamic central difference network search for face anti-spoofing, IEEE Trans. Pattern Anal. Mach. Intell., 43 (2021), 3005–3023. https://doi.org/10.1109/tpami.2020.3036338 doi: 10.1109/tpami.2020.3036338
|
| [44] | Y. Liu, J. Stehouwer, X. Liu, On disentangling spoof trace for generic face anti-spoofing, in Computer Vision-ECCV 2020, 12363 (2020), 406–422. https://doi.org/10.1007/978-3-030-58523-5_24 |
| [45] | K. Zhang, T. Yao, J. Zhang, Y. Tai, S. Ding, J. Li, et al., Face anti-spoofing via disentangled representation learning, in Computer Vision-ECCV 2020, 12364 (2020), 641–657. https://doi.org/10.1007/978-3-030-58529-7_38 |
| [46] |
H. Wu, D. Zeng, Y. Hu, H. Shi, T. Mei, Dual spoof disentanglement generation for face anti-spoofing with depth uncertainty learning, IEEE Trans. Circuits Syst. Video Technol., 32 (2022), 4626–4638. https://doi.org/10.1109/TCSVT.2021.3133620 doi: 10.1109/TCSVT.2021.3133620
|
| [47] |
W. Yan, Y. Zeng, H. Hu, Domain adversarial disentanglement network with cross-domain synthesis for generalized face anti-spoofing, IEEE Trans. Circuits Syst. Video Technol., 32 (2022), 7033–7046. https://doi.org/10.1109/TCSVT.2022.3178723 doi: 10.1109/TCSVT.2022.3178723
|
| [48] | Y. Jia, J. Zhang, S. Shan, X. Chen, Single-side domain generalization for face anti-spoofing, in 2020 IEEE/CVF Conference on Computer Vision and Pattern Recognition (CVPR), (2020), 8481–8490. https://doi.org/10.1109/CVPR42600.2020.00851 |
| [49] | Z. Wang, Z. Wang, Z. Yu, W. Deng, J. Li, T. Gao, et al., Domain Generalization via Shuffled Style Assembly for Face Anti-Spoofing, in 2022 IEEE/CVF Conference on Computer Vision and Pattern Recognition (CVPR), (2022), 4113–4123. https://doi.org/10.1109/CVPR52688.2022.00409 |
| [50] |
A. Liu, C. Zhao, Z. Yu, J. Wan, A. Su, X. Liu, et al., Contrastive context-aware learning for 3D high-fidelity mask face presentation attack detection, IEEE Trans. Inf. Forensics Secur., 17 (2022), 2497–2507. https://doi.org/10.1109/TIFS.2022.3188149 doi: 10.1109/TIFS.2022.3188149
|
| [51] |
A. George, S. Marcel, Learning one class representations for face presentation attack detection using multi-channel convolutional neural networks, IEEE Trans. Inf. Forensics Secur., 16 (2020), 361–375. https://doi.org/10.1109/TIFS.2020.3013214 doi: 10.1109/TIFS.2020.3013214
|
| [52] |
H. Li, W. Li, H. Cao, S. Wang, F. Huang, A. C. Kot, Unsupervised Domain Adaptation for Face Anti-Spoofing, IEEE Trans. Inf. Forensics Secur., 13 (2018), 1794–1809. https://doi.org/10.1109/TIFS.2018.2801312 doi: 10.1109/TIFS.2018.2801312
|
| [53] | Y. Liu, Y. Chen, W. Dai, M. Gou, C. Huang, H. Xiong, Source-free domain adaptation with contrastive domain alignment and self-supervised exploration for face anti-spoofing, in Computer Vision-ECCV 2022, 13672 (2022), 511–528. https://doi.org/10.1007/978-3-031-19775-8_30 |
| [54] | Y. Qin, C. Zhao, X. Zhu, Z. Wang, Z. Yu, T. Fu, et al., Learning meta model for zero-and few-shot face anti-spoofing, in Proceedings of the AAAI Conference on Artificial Intelligence, 34 (2020), 11916–11923. https://doi.org/10.1609/aaai.v34i07.6866 |
| [55] | H. Huang, D. Sun, Y. Liu, W. Chu, T. Xiao, J. Yuan, et al., Adaptive transformers for robust few-shot cross-domain face anti-spoofing, in Computer Vision-ECCV 2022, 13673 (2022), 37–54. https://doi.org/10.1007/978-3-031-19778-9_3 |
| [56] |
L. Li, X. Feng, Z. Xia, X. Jiang, A. Hadid, Face spoofing detection with local binary pattern network, J. Visual Commun. Image Representation, 54 (2018), 182–192. https://doi.org/10.1016/j.jvcir.2018.05.009 doi: 10.1016/j.jvcir.2018.05.009
|
| [57] | A. Roohi, S. Angizi, Efficient targeted bit-flip attack against the local binary pattern network, in 2022 IEEE International Symposium on Hardware Oriented Security and Trust (HOST), (2022), 89–92. https://doi.org/10.1109/HOST54066.2022.9839959 |
| [58] |
N. Bousnina, L. Zheng, M. Mikram, S. Ghouzali, K. Minaoui, Unraveling robustness of deep face anti-spoofing models against pixel attacks, Multimedia Tools Appl., 80 (2021), 7229–7246. https://doi.org/10.1007/s11042-020-10041-1 doi: 10.1007/s11042-020-10041-1
|
| [59] | D. Deb, X. Liu, A. K. Jain, Unified detection of digital and physical face attacks, in 2023 IEEE 17th International Conference on Automatic Face and Gesture Recognition (FG), (2023) 1–8. https://doi.org/10.1109/FG57933.2023.10042500 |
| [60] |
T. K. Ho, The random subspace method for constructing decision forests, IEEE Trans. Pattern Anal. Mach. Intell., 20 (1998), 832–844. https://doi.org/10.1109/34.709601 doi: 10.1109/34.709601
|
| [61] | L. Breiman, Random forest, Mach. Learn., 45 (2001), 5–32. https://doi.org/10.1023/A: 1010933404324 |
| [62] | F. T. Liu, M. T. Kai, Y. Yu, Z. Zhou, Spectrum of variable-random trees, J. Artif. Intell. Res., 32 (2008), 355–384. |
| [63] | T. Chen, C. Guestrin, XGBoost: A scalable tree boosting system, preprint, arXiv: 1603.02754. |
| [64] |
T. Ojala, M. Pietikainen, T. Maenpaa, Multiresolution gray-scale and rotation invariant texture classification with local binary patterns, IEEE Trans. Pattern Anal. Mach. Intell., 24 (2002), 971–987. https://doi.org/10.1109/TPAMI.2002.1017623 doi: 10.1109/TPAMI.2002.1017623
|
| [65] | Z. Zhang, J. Yan, S. Liu, Z. Lei, D. Yi, S. Z. Li, A face antispoofing database with diverse attacks, in 2012 5th IAPR International Conference on Biometrics (ICB), (2012), 26–31. https://doi.org/10.1109/ICB.2012.6199754 |
| [66] | P. Viola, M. Jones, Rapid object detection using a casacde of simple features, in Proceedings of the 2001 IEEE Computer Society Conference on Computer Vision and Pattern Recognition, (2001). https://doi.org/10.1109/CVPR.2001.990517 |
| [67] | K. Simonyan, A. Zisserman, Very deep convolutional networks for large-scale image recognition, preprint, arXiv: 1409.1556. |
| [68] | K. He, X. Zhang, S. Ren, J. Sun, Deep residual learning for image recognition, in 2016 IEEE Conference on Computer Vision and Pattern Recognition (CVPR), (2016), 770–778, . https://doi.org/10.1109/CVPR.2016.90 |
| [69] | I. J. Goodfellow, J. Shlens, C. Szegedy, Explaining and harnessing adversarial examples, preprint, arXiv: 1412.6572. |
| [70] | Z. Sun, L. Sun, Q. Li, Investigation in spatial-temporal domain for face spoof detection, in 2018 IEEE International Conference on Acoustics, Speech and Signal Processing (ICASSP), (2018), 1538–1542. https://doi.org/10.1109/ICASSP.2018.8461942 |
| [71] | T. M. Oshiro, P. S. Perez, J. A. Baranauskas, How many trees in a random forest? in Machine Learning and Data Mining in Pattern Recognition, 7376 (2012), 154–168. https://doi.org/10.1007/978-3-642-31537-4_13 |
| [72] |
J. Lu, V. E. Liong, J. Zhou, Cost-sensitive local binary feature learning for facial age estimation, IEEE Trans. Image Process., 24 (2015), 5356–5368. https://doi.org/10.1109/TIP.2015.2481327 doi: 10.1109/TIP.2015.2481327
|
| [73] |
J. Lu, V. E. Liong, J. Zhou, Deep hashing for scalable image search, IEEE Trans. Image Process., 26 (2017), 2352–2367. https://doi.org/10.1109/TIP.2017.2678163 doi: 10.1109/TIP.2017.2678163
|
| [74] |
J. Lu, V. E. Liong, J. Zhou, Simultaneous local binary feature learning and encoding for homogeneous and heterogeneous face recognition, IEEE Trans. Pattern Anal. Mach. Intell., 40 (2018), 1979–1993. https://doi.org/10.1109/TPAMI.2017.2737538 doi: 10.1109/TPAMI.2017.2737538
|
| [75] |
Y. Duan, J. Lu, J. Feng, J. Zhou, Context-aware local binary feature learning for face recognition, IEEE Trans. Pattern Anal. Mach. Intell., 40 (2018), 1139–1153. https://doi.org/10.1109/TPAMI.2017.2710183 doi: 10.1109/TPAMI.2017.2710183
|


Figures(6) / Tables(6)
Rizhao Cai, Liepiao Zhang, Changsheng Chen, Yongjian Hu, Alex Kot. Learning deep forest for face anti-spoofing: An alternative to the neural network against adversarial attacks[J]. Electronic Research Archive, 2024, 32(10): 5592-5614. doi: 10.3934/era.2024259


 DownLoad: