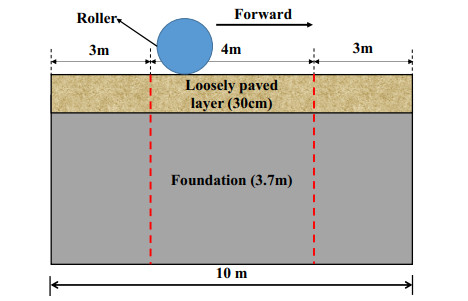
In the process of intelligent compaction of roadbeds, the water content of the roadbed is one of the important influencing factors of compaction quality. In order to analyze the effect of water content on the compaction quality of roadbeds, this paper is developed by secondary development of Abaqus finite element numerical simulation software. At the same time, the artificial viscous boundary was set to eliminate the influence of boundary conditions on the results in the finite element modeling process, so that the numerical simulation can be refined to model. On this basis, the dynamic response analysis of the roadbed compaction process is performed on the finite element numerical simulation results. This paper established the correlation between compaction degree and intelligent compaction index CMV (Compaction Meter Value) and then analyzed the effect of water content on the compaction quality for the roadbed. The results of this paper show that the amplitude of the vertical acceleration is almost independent of the moisture content, and the vertical displacement mainly occurs in the static compaction stage. The vertical displacement changes sharply in the first 0.5 s when the vibrating wheel is in contact with the roadbed. The main stage of roadbed compaction quality increase is before the end of the first compaction. At the end of the first compaction, the roadbed compaction degree increased rapidly from 80% to 91.68%, 95.34% and 97.41%, respectively. With the increase in water content, the CMV gradually increased. At the end of the second compaction, CMV increased slightly compared with that at the end of the first compaction and stabilized at the end of the second compaction. The water content of the roadbed should be considered to be set slightly higher than the optimal water content of the roadbed by about 1% during the construction of the roadbed within the assumptions of this paper.
Citation: Yuan Ma, Yingcheng Luan, Shuangquan Jiang, Jianming Zhang, Chuanle Wang. Numerical simulation analysis for the effect of water content on the intelligent compaction quality of roadbed[J]. Electronic Research Archive, 2023, 31(8): 4968-4984. doi: 10.3934/era.2023254
In the process of intelligent compaction of roadbeds, the water content of the roadbed is one of the important influencing factors of compaction quality. In order to analyze the effect of water content on the compaction quality of roadbeds, this paper is developed by secondary development of Abaqus finite element numerical simulation software. At the same time, the artificial viscous boundary was set to eliminate the influence of boundary conditions on the results in the finite element modeling process, so that the numerical simulation can be refined to model. On this basis, the dynamic response analysis of the roadbed compaction process is performed on the finite element numerical simulation results. This paper established the correlation between compaction degree and intelligent compaction index CMV (Compaction Meter Value) and then analyzed the effect of water content on the compaction quality for the roadbed. The results of this paper show that the amplitude of the vertical acceleration is almost independent of the moisture content, and the vertical displacement mainly occurs in the static compaction stage. The vertical displacement changes sharply in the first 0.5 s when the vibrating wheel is in contact with the roadbed. The main stage of roadbed compaction quality increase is before the end of the first compaction. At the end of the first compaction, the roadbed compaction degree increased rapidly from 80% to 91.68%, 95.34% and 97.41%, respectively. With the increase in water content, the CMV gradually increased. At the end of the second compaction, CMV increased slightly compared with that at the end of the first compaction and stabilized at the end of the second compaction. The water content of the roadbed should be considered to be set slightly higher than the optimal water content of the roadbed by about 1% during the construction of the roadbed within the assumptions of this paper.

| [1] |
Y. Ma, F. Chen, T. Ma, X. M. Huang, Y. Zhang, Intelligent compaction: An improved quality monitoring and control of asphalt pavement construction technology, IEEE Trans. Intell. Transp. Syst., 23 (2022), 14875–14882. https://doi.org/10.1109/TITS.2021.3134699 doi: 10.1109/TITS.2021.3134699

|
| [2] |
Y. Ma, Y. Zhang, W. Zhao, X. M. Ding, Z. W. Wang, T. Ma, Assessment of intelligent compaction quality evaluation index and uniformity, J. Transp. Eng. Part B. Pavements, 148 (2022). https://doi.org/10.1061/JPEODX.00003 doi: 10.1061/JPEODX.00003
|
| [3] | J. S. Qian, H. L. Wang, P. Wang, Test and control methods for on-site compaction of fine sand subgrade on coastal regions, in New Frontiers in Engineering Geology and the Environment, Springer, (2013), 75–78. https://doi.org/10.1007/978-3-642-31671-5_11 |
| [4] |
F. Wang, H. Li, A nonparametric approach for characterizing soil spatial variability based on cone penetration test data, Bull. Eng. Geol. Environ., 80 (2021), 1073–1089. https://doi.org/10.1007/s10064-020-01976-8 doi: 10.1007/s10064-020-01976-8
|
| [5] | Editorial Department of China Journal of Highway and Transport, Review on China's pavement engineering research·2020, China J. Highway Transp., 33 (2020), 1–66. |
| [6] |
R. Anderegg, K. Kaufmann, Intelligent compaction with vibratory rollers: Feedback control systems in automatic compaction and compaction control, Transp. Res. Rec. J. Transp. Research Board, 1868 (2004), 124–134. https://doi.org/10.3141/1868-13 doi: 10.3141/1868-13
|
| [7] |
X. Y. Jia, W. Hu, P. Polaczyk, H. R. Gong, B. S. Huang, Comparative evaluation of compacting process for base materials using lab compaction methods, Transp. Res. Rec., 2673 (2019), 558–567. https://doi.org/10.1177/03611981198379 doi: 10.1177/03611981198379
|
| [8] | T. Jia, T. J. He, Z. D. Qian, Y. Li, Research of continuous compaction detection method based on embedded system, in COTA International Conference of Transportation Professionals, 2019. https://doi.org/10.1061/9780784482292.065 |
| [9] |
Q. Zhang, Z. An, Z. Huangfu, Q. Li, A review on roller compaction quality control and assurance methods for earthwork in five application scenarios, Materials, 15 (2022), 2610. https://doi.org/10.3390/ma15072610 doi: 10.3390/ma15072610
|
| [10] |
W. Hu, X. Shu, X. Y. Jia, B. S. Huang, Recommendations on intelligent compaction parameters for asphalt resurfacing quality evaluation, J. Constr. Eng. Manage., 143 (2017). https://doi.org/10.1061/(ASCE)CO.1943-7862.0001361 doi: 10.1061/(ASCE)CO.1943-7862.0001361
|
| [11] |
Q. W. Xu, G. K. Chang, Evaluation of intelligent compaction for asphalt materials, Autom. Constr., 30 (2013), 104–112. https://doi.org/10.1016/j.autcon.2012.11.015 doi: 10.1016/j.autcon.2012.11.015
|
| [12] |
Y. Ma, Y. C. Luan, W. G. Zhang, Y. Q. Zhang, Numerical simulation of intelligent compaction for subgrade construction, J. Cent. South Univ., 27 (2020), 2173–2184. https://doi.org/10.1007/s11771-020-4439-2 doi: 10.1007/s11771-020-4439-2
|
| [13] |
Y. Ma, F. Zhou, H. Tao, Dynamic simulation and evolution of key control parameters for intelligent compaction of subgrade, J. Cent. South Univ. (Sci. Technol.), 52 (2021), 2246–2257. https://doi.org/10.11817/j.issn.1672-7207.2021.07.012 doi: 10.11817/j.issn.1672-7207.2021.07.012
|
| [14] |
A. Haider, E. X. Song, P. Li, Numerical simulation and absorbing boundary conditions for wave propagation in a semi-infinite media with a linear isotropic hardening plastic model, Soil Dyn. Earthquake Eng., 125 (2019), 105627. https://doi.org/10.1016/j.soildyn.2019.04.001 doi: 10.1016/j.soildyn.2019.04.001
|
| [15] |
A. J. Deeks, M. F. Randolph, Axisymmetrical time-domain transmitting boundaries, J. Eng. Mech.-ASCE, 120 (1994), 25–42. https://doi.org/10.1061/(ASCE)0733-9399(1994)120:1(25) doi: 10.1061/(ASCE)0733-9399(1994)120:1(25)
|
| [16] | X. Zhao, Study on Intelligent Compaction Control Technology of Subgrade, PhD thesis, Chang'an University, 2016. |
| [17] | X. Teng, Numerical Analysis and Quality Control of Dynamic Consolidation of Silty Soil Subgrade in Yellow River Alluvial Plain, M.S. thesis, Shandong University, 2017. |
| [18] | K. Chen, Study on Strength and Deformation of Compacted Loess and Its Microstructure for Highway Engineering, PhD thesis, Chang'an University, 2016. |
| [19] | Y. Chen, D. Xu, FLAC/FLAC3D Fundamental and Engineering Examples, China Water Conservancy and Hydropower Publishing House, 2009. |
| [20] |
Z. An, T. Liu, Q. Zhang, Z. Zhang, Z. Huangfu, Q. Li, Vibration compaction process model for rockfill materials considering viscoelastic-plastic deformation, Autom. Constr., 131 (2021), 103889. https://doi.org/10.1016/j.autcon.2021.103889 doi: 10.1016/j.autcon.2021.103889
|
| [21] |
Y. Ma, H. Liang, Y. X. You, W. G. Zhang, L. M. Guo, J. W. Fan, et al., Elastic-viscoplastic constitutive model of soil under cyclic loading, Adv. Civ. Eng., 2021 (2021). https://doi.org/10.1155/2021/1602431 doi: 10.1155/2021/1602431
|
| [22] |
L. Mi, The influence of base modulus on compaction energy in subgrade, J. China Railway Soc., 6 (2008), 69–74. https://doi.org/10.3321/j.issn:1001-8360.2008.06.013 doi: 10.3321/j.issn:1001-8360.2008.06.013
|
| [23] |
W. Hu, X. Y. Jia, X. Y. Zhu, A. W. Su, Y. Du, B. S. Huang, Influence of moisture content on intelligent soil compaction, Autom. Constr., 113 (2020), 103141. https://doi.org/10.1016/j.autcon.2020.103141 doi: 10.1016/j.autcon.2020.103141
|
| [24] | Z. An, T. Liu, Z. Huangfu, Q. Zhang, C. Li, Q. Li, Neural network model for evaluating compaction quality of rockfill materials by compaction meter value, J. Hydroelectr. Eng., 39 (2020), 110–120. |
| [25] |
H. C. Dan, D. Yang, X. Liu, A. P. Peng, Z. Zhang, Experimental investigation on dynamic response of asphalt pavement using SmartRock sensor under vibrating compaction loading, Constr. Build. Mater., 247 (2020), 118592. https://doi.org/10.1016/j.conbuildmat.2020.118592 doi: 10.1016/j.conbuildmat.2020.118592
|
| [26] | Y. Long, Structural Mechanics, Higher Education Press, 2001. |


Figures(12) / Tables(4)
Yuan Ma, Yingcheng Luan, Shuangquan Jiang, Jianming Zhang, Chuanle Wang. Numerical simulation analysis for the effect of water content on the intelligent compaction quality of roadbed[J]. Electronic Research Archive, 2023, 31(8): 4968-4984. doi: 10.3934/era.2023254


 DownLoad: