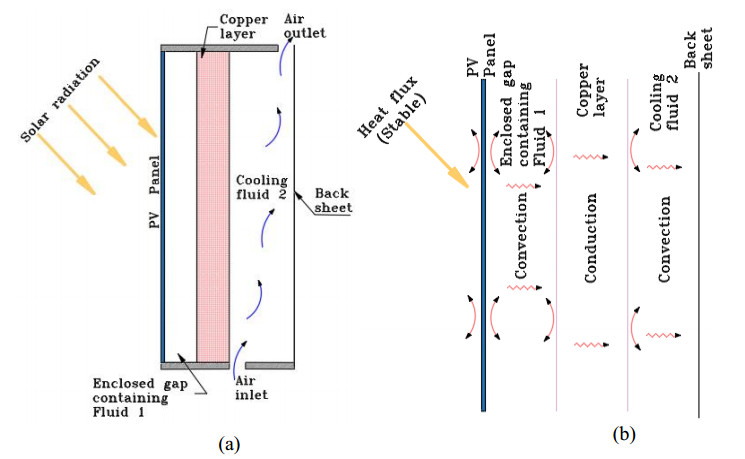
The low cooling efficiency of photovoltaic panels integrated into building façades restricts their electrical performance. The innovative approach of a dual-fluid photovoltaic-thermal system (BFPVT), incorporating bi-fluid cooling exchangers, appears to be a promising solution for jointly optimizing the electrical and thermal performance of PVT systems. However, despite the introduction of air heat shields to improve this performance, their limited efficiency makes them less competitive. We present a photovoltaic-thermal (PVT) system with a two-channel heat exchanger. The upper channel contains a stagnant fluid, which acts as a heat shield, while the lower, open channel ensures the continuous circulation or evacuation of heat transfer air. A copper metal plate separates the two channels. We examined the impact of various fluids employed as heat shields, including neon, argon, and xenon, in comparison to air, on the thermal and electrical performance of the collector. We employed numerical modeling of convective and conductive transfers to assess the average thermal efficiency of the BFPVT and the rise in PV temperature in the analyzed configuration. The equations were discretized using the implicit finite difference method and solved using the Thomas and Gauss-Seidel algorithms. The results demonstrated an 18% enhancement in thermal efficiency with the utilization of neon. In contrast, the employment of argon and xenon markedly reduced the mean temperature of photovoltaic cells by 4.82 ℃ and 4.87 ℃, respectively. This led to an increase in their electrical efficiency by 0.33% in comparison to air. Thus, argon is regarded as the optimal choice for optimizing electrical efficiency, taking into account both economic and environmental considerations.
Citation: Kokou Aménuvéla Toka, Yawovi Nougbléga, Komi Apélété Amou. Optimization of hybrid photovoltaic-thermal systems integrated into buildings: Impact of bi-fluid exchangers and filling gases on the thermal and electrical performances of solar cells[J]. AIMS Energy, 2024, 12(5): 1075-1095. doi: 10.3934/energy.2024051
The low cooling efficiency of photovoltaic panels integrated into building façades restricts their electrical performance. The innovative approach of a dual-fluid photovoltaic-thermal system (BFPVT), incorporating bi-fluid cooling exchangers, appears to be a promising solution for jointly optimizing the electrical and thermal performance of PVT systems. However, despite the introduction of air heat shields to improve this performance, their limited efficiency makes them less competitive. We present a photovoltaic-thermal (PVT) system with a two-channel heat exchanger. The upper channel contains a stagnant fluid, which acts as a heat shield, while the lower, open channel ensures the continuous circulation or evacuation of heat transfer air. A copper metal plate separates the two channels. We examined the impact of various fluids employed as heat shields, including neon, argon, and xenon, in comparison to air, on the thermal and electrical performance of the collector. We employed numerical modeling of convective and conductive transfers to assess the average thermal efficiency of the BFPVT and the rise in PV temperature in the analyzed configuration. The equations were discretized using the implicit finite difference method and solved using the Thomas and Gauss-Seidel algorithms. The results demonstrated an 18% enhancement in thermal efficiency with the utilization of neon. In contrast, the employment of argon and xenon markedly reduced the mean temperature of photovoltaic cells by 4.82 ℃ and 4.87 ℃, respectively. This led to an increase in their electrical efficiency by 0.33% in comparison to air. Thus, argon is regarded as the optimal choice for optimizing electrical efficiency, taking into account both economic and environmental considerations.

| [1] |
Roques P, Roux D (2018) Consommation d'énergie et théorie des pratiques: vers des pistes d'action pour la transition énergétique. Décisions Mark 90: 35–54. https://doi.org/10.7193/dm.090.35.54 doi: 10.7193/dm.090.35.54

|
| [2] |
Parida B, Iniyan S, Goic R (2011) A review of solar photovoltaic technologies. Renewable Sustainable Energy Rev 15: 1625–1636. https://doi.org/10.1016/j.rser.2010.11.032 doi: 10.1016/j.rser.2010.11.032
|
| [3] |
Maghrabie H, Elsaid K, Sayed E, et al. (2021) Building-integrated photovoltaic/thermal (BIPVT) systems: Applications and challenges. Sustainable Energy Technol Assess 45. https://doi.org/10.1016/j.seta.2021.101151 doi: 10.1016/j.seta.2021.101151
|
| [4] |
Marei Y, Emam M, Ahmed M, et al. (2024) Thermal and optical investigations of various transparent wall configurations and building integrated photovoltaic for energy savings in buildings. Energy Convers Manage, 299. https://doi.org/10.1016/j.enconman.2023.117817 doi: 10.1016/j.enconman.2023.117817
|
| [5] |
Mohamed E, Moustafa M, Chazy M (2023) Design of solar air conditioning system integrated with photovoltaic panels and thermoelectric coolers: Experimental analysis and machine learning modeling by random vector functional link coupled with white whale optimization. Therm Sci Eng Prog 43: 102051. https://doi.org/10.1016/j.tsep.2023.102051 doi: 10.1016/j.tsep.2023.102051
|
| [6] |
Şirin C, Goggins J, Hajdukiewicz M (2023) A review on building-integrated photovoltaic/thermal systems for green buildings. Appl Therm Eng, 229. https://doi.org/10.1016/j.applthermaleng.2023.120607 doi: 10.1016/j.applthermaleng.2023.120607
|
| [7] |
Krauter S, Araújo RG, Schroer S, et al. (1999) Combined photovoltaic and solar thermal systems for facade integration and building insulation. Sol Energy 67: 239–248. https://doi.org/10.1016/S0038-092X(00)00071-2 doi: 10.1016/S0038-092X(00)00071-2
|
| [8] |
Antonanzas J, Del Amo A, Martinez-Gracia A, et al. (2015) Towards the optimization of convective losses in photovoltaic-thermal panels. Sol Energy 116: 323–336. https://doi.org/10.1016/j.solener.2015.04.013 doi: 10.1016/j.solener.2015.04.013
|
| [9] |
Ben C, Marir-Benabbas M (2023) Etude des performances électriques et thermiques d'un capteur hybride PVT. J Renewable Energy 16: 257–268. https://doi.org/10.54966/jreen.v16i2.378 doi: 10.54966/jreen.v16i2.378
|
| [10] |
Kant K, Shukla A, Sharma A, et al. (2016) Thermal response of poly-crystalline silicon photovoltaic panels: Numerical simulation and experimental study. Sol Energy 134: 147–155. https://doi.org/10.1016/j.solener.2016.05.002 doi: 10.1016/j.solener.2016.05.002
|
| [11] |
Wolf M (1976) Performance analyses of combined heating and photovoltaic power systems for residences. Energy Convers 16: 79–90. https://doi.org/10.1016/0013-7480(76)90018-8 doi: 10.1016/0013-7480(76)90018-8
|
| [12] |
Jian T, Hao N, Run-Ling P, et al. (2023) A review on energy conversion using hybrid photovoltaic and thermoelectric systems. J Power Sources, 562. https://doi.org/10.1016/j.jpowsour.2023.232785 doi: 10.1016/j.jpowsour.2023.232785
|
| [13] |
Yu J, Kim J, Kim J (2020) Effect of triangular baffle arrangement on heat transfer enhancement of air-type PVT collector. Sustainability (Switzerland), 12. https://doi.org/10.3390/SU12187469 doi: 10.3390/SU12187469
|
| [14] |
Chow T, Hand J, Strachan P (2003) Building-integrated photovoltaic and thermal applications in a subtropical hotel building. Appl Therm Eng 23: 2035–2049. https://doi.org/10.1016/S1359-4311(03)00183-2 doi: 10.1016/S1359-4311(03)00183-2
|
| [15] |
Wei D, Qirong Y, Jincui Z (2011) A study of the ventilation performance of a series of connected solar chimneys integrated with building. Renewable Energy 36: 265–271. https://doi.org/10.1016/j.renene.2010.06.030 doi: 10.1016/j.renene.2010.06.030
|
| [16] |
Brinkworth B, Cross B, Marshall R, et al. (1997) Thermal regulation of photovoltaic cladding. Sol Energy 61: 169–178. https://doi.org/10.1016/S0038-092X(97)00044-3 doi: 10.1016/S0038-092X(97)00044-3
|
| [17] |
Yang H, Marshall R, Brinkworth B (1996) Validated simulation for thermal regulation of photovoltaic wall structures. Conference Record of the IEEE Photovoltaic Specialists Conference 3: 1453–1456. https://doi.org/10.1109/pvsc.1996.564409 doi: 10.1109/pvsc.1996.564409
|
| [18] | Nougbléga Y, Kpode K, Atchonouglo K, et al. (2018) Effect of enclosed air gap and empty gap for thermal screens in PV cells isolation inside the hybrid photovoltaic-thermal channel on a rooftop designed for natural ventilation in bioclimatic buildings. Int J Sci Technol Res 7: 112–121. |
| [19] |
Yu G, Yang H, Yan Z, et al. (2021) A review of designs and performance of façade-based building integrated photovoltaic-thermal (BIPVT) systems. Appl Therm Eng, 182. https://doi.org/10.1016/j.applthermaleng.2020.116081 doi: 10.1016/j.applthermaleng.2020.116081
|
| [20] |
Aspetakis G, Wang Q (2025) Critical review of Air-Based PVT technology and its integration to building energy systems. Energy Built Environ 6: 121–135. https://doi.org/10.1016/j.enbenv.2023.10.001 doi: 10.1016/j.enbenv.2023.10.001
|
| [21] |
Elnozahy A, Rahman AKA, Ali AHH, et al. (2015) Performance of a PV module integrated with standalone building in hot arid areas as enhanced by surface cooling and cleaning. Energy Build 88: 100–109. https://doi.org/10.1016/j.enbuild.2014.12.012 doi: 10.1016/j.enbuild.2014.12.012
|
| [22] |
Senthilraja S, Gangadevi R, Marimuthu R, et al. (2020) Performance evaluation of water and air based PVT solar collector for hydrogen production application. Int J Hydrogen Energy 45: 7498–7507. https://doi.org/10.1016/j.ijhydene.2019.02.223 doi: 10.1016/j.ijhydene.2019.02.223
|
| [23] |
Abidi S, Sammouda H, Bennacer R (2014) Numerical analysis of three coolants heat exchanger associated to hybrid photovoltaic thermal solar sensor. Int J Energy Eng 4: 45–53. https://doi.org/10.5923/j.ijee.20140403.01 doi: 10.5923/j.ijee.20140403.01
|
| [24] |
Aydın A, İsmail K, Hüseyin A (2024) Electrical and thermal performance enhancement of a photovoltaic thermal hybrid system with a novel inner plate-finned collective cooling with different nanofluids. Int J Green Energy, 21. https://doi.org/10.1080/15435075.2023.2201345 doi: 10.1080/15435075.2023.2201345
|
| [25] |
Mohammed E, Mohamed EZ, Kabeel AE, et al. (2024) Numerical analysis and design of a novel solar photovoltaic thermal system using finned cooling channel structures embedded with air/TiO2—water nano bi-fluid. Sol Energy, 269. https://doi.org/10.1016/j.solener.2024.112368 doi: 10.1016/j.solener.2024.112368
|
| [26] |
Irshad K, Habib K, Thirumalaiswamy N (2015) Performance evaluation of PV-Trombe wall for sustainable building development. Procedia CIRP 26: 624–629. https://doi.org/10.1016/j.procir.2014.07.116 doi: 10.1016/j.procir.2014.07.116
|
| [27] |
Calderón-Vásquez I, Segovia V, Cardemil JM, et al. (2021) Assessing the use of copper slags as thermal energy storage material for packed-bed systems. Energy, 227. https://doi.org/10.1016/j.energy.2021.120370 doi: 10.1016/j.energy.2021.120370
|
| [28] |
Luc L (2014) Law of cooling, heat conduction and Stefan-Boltzmann radiation laws fitted to experimental data for bones irradiated by CO2 laser. Biomed Opt Express 5: 701–712. https://doi.org/10.1364/BOE.5.000701 doi: 10.1364/BOE.5.000701
|
| [29] |
Mohamed G, Mohsen A, Hegazy R (2022) Temperature distribution modeling of PV and cooling water PV/T collectors through thin and thick cooling cross-fined channel box. Energy Rep 8: 1144–1153. https://doi.org/10.1016/j.egyr.2021.11.061 doi: 10.1016/j.egyr.2021.11.061
|
| [30] |
Woodfield P, Monde M, Mitsutake Y (2007) Measurement of averaged heat transfer coefficients in high-pressure vessel during charging with hydrogen, nitrogen or argon gas. J Therm Sci Technol 2: 180–191. https://doi.org/10.1299/jtst.2.180 doi: 10.1299/jtst.2.180
|
| [31] |
Palyvos J (2008) A survey of wind convection coefficient correlations for building envelope energy systems' modelling. Appl Therm Eng 28: 801–808. https://doi.org/10.1016/j.applthermaleng.2007.12.005 doi: 10.1016/j.applthermaleng.2007.12.005
|
| [32] |
Woods L (1954) A note on the numerical solution of fourth order differential equations. Aeronaut Q 5: 176–184. https://doi.org/10.1017/s0001925900001177 doi: 10.1017/s0001925900001177
|
| [33] |
Han J, Lu L, Yang H (2009) Thermal behavior of a novel type see-through glazing system with integrated PV cells. Build Environ 44: 2129–2136, https://doi.org/10.1016/j.buildenv.2009.03.003. doi: 10.1016/j.buildenv.2009.03.003
|
| [34] |
Rahman M, Hasanuzzaman M, Rahim N (2015) Effects of various parameters on PV-module power and efficiency. Energy Convers Manage 103: 348–358. https://doi.org/10.1016/j.enconman.2015.06.067 doi: 10.1016/j.enconman.2015.06.067
|
| [35] |
Akshayveer, Singh AP, Kumar A, et al. (2021) Effect of natural convection and thermal storage system on the electrical and thermal performance of a hybrid PV-T/PCM systems. Materialstoday: Proc 39: 1899–1904. https://doi.org/10.1016/j.matpr.2020.08.010 doi: 10.1016/j.matpr.2020.08.010
|
| [36] |
Alibakhsh K, Yasamin K, soudabeh G, et al. (2017) Effects of forced convection on the performance of a photovoltaic thermal system: An experimental study. Exp Therm Fluid Sci 85: 13–21. https://doi.org/10.1016/j.expthermflusci.2017.02.012 doi: 10.1016/j.expthermflusci.2017.02.012
|
| [37] |
Saber B, Abderrahim B, Taqiy E, et al. (2024) Mixed convection air-cooled PV/T solar collector with integrate porous medium. J Braz Soc Mech Sci Eng, 46. https://doi.org/10.1007/s40430-024-04821-1 doi: 10.1007/s40430-024-04821-1
|
| [38] |
Nougbléga Y, Kpode K, N'Wuitcha K, et al. (2019) Thermal efficiency of a hybrid photovoltaic-thermal chimney integrated into a building. Am J Mod Phys 8: 50. https://doi.org/10.11648/j.ajmp.20190804.11 doi: 10.11648/j.ajmp.20190804.11
|
| [39] |
Nahar A, Hasanuzzaman M, Rahim N, et al. (2019) Numerical investigation on the effect of different parameters in enhancing heat transfer performance of photovoltaic thermal systems. Renewable Energy 132: 284–295. https://doi.org/10.1016/j.renene.2018.08.008 doi: 10.1016/j.renene.2018.08.008
|
| [40] |
Ozueh T, Ajienka J, Joel O (2022) Exo-Economic analysis on the liquefaction unit of a baseload LNG plant. Int J Adv Eng Manage (IJAEM) 4: 1646. https://doi.org/10.35629/5252-040716461652 doi: 10.35629/5252-040716461652
|
| [41] |
Tang J, Skelton J (2021) Impact of noble-gas filler atoms on the lattice thermal conductivity of CoSb3 skutterudites: First-principles modelling. J Phys Condens Matter 33: 15. https://doi.org/10.1088/1361-648X/abd8b8 doi: 10.1088/1361-648X/abd8b8
|
| [42] |
Fonseca L, Miller F, Pfotenhauer J (2018) Experimental heat transfer analysis of a cryogenic nitrogen pulsating heat Pipe at various liquid fill ratios. Appl Therm Eng 130: 343–353. https://doi.org/10.1016/j.applthermaleng.2017.11.029 doi: 10.1016/j.applthermaleng.2017.11.029
|
| [43] |
Betts P, Bokhari I (2000) Experiments on turbulent natural convection in an enclosed tall cavity. Int J Heat Fluid Flow 21: 675–683. https://doi.org/10.1016/S0142-727X(00)00033-3 doi: 10.1016/S0142-727X(00)00033-3
|
| [44] |
Batchelor G (1954) Heat transfer by free convection across a closed cavity between vertical boundaries at different temperatures. Q Appl Math 12: 209–233. https://doi.org/10.1090/qam/64563 doi: 10.1090/qam/64563
|


Figures(15) / Tables(4)

Kokou Aménuvéla Toka, Yawovi Nougbléga, Komi Apélété Amou. Optimization of hybrid photovoltaic-thermal systems integrated into buildings: Impact of bi-fluid exchangers and filling gases on the thermal and electrical performances of solar cells[J]. AIMS Energy, 2024, 12(5): 1075-1095. doi: 10.3934/energy.2024051


 DownLoad: