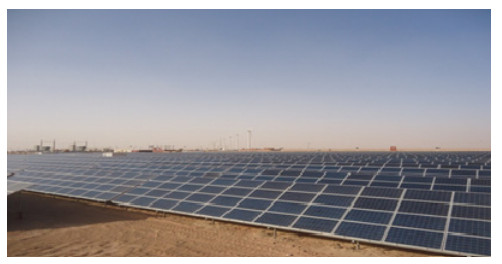
In this study, we will shed light on the aggressive effect of a blowing sandstorm in the presence of high temperatures on the photovoltaic inter-module connectors in a solar station located in the desert environment of southwestern Algeria. After a short period of operation, it is observed that the MC4 connectors, which tighten the interconnection between the photovoltaic modules, are completely faulty because of sand grains carried away by a wind blowing at an average annual speed, which exceeds 6 m/s. Then, we analyzed and evaluated the connector failure to propose an appropriate solution. We checked the variations of the intrinsic temperatures of each connector employing the thermocouple for the three cases of operating temperatures, as well as the current measurement flowing through each connector, to calculate the powers dissipated in each branch of the circuit. Finally, this experimental work shows that a loss of power reaches almost 10% from the nominal power of the typical case. The proposed solution for this problem is to cover the connectors with an impervious plastic cover.
Citation: Mebarek LAHBIB, Mohammed BOUSSAID, Houcine MOUNGAR, Ahmed TAHRI. Analytical assessment of the filed results on the PV system connectors performance under operating temperature[J]. AIMS Energy, 2023, 11(3): 555-575. doi: 10.3934/energy.2023029
In this study, we will shed light on the aggressive effect of a blowing sandstorm in the presence of high temperatures on the photovoltaic inter-module connectors in a solar station located in the desert environment of southwestern Algeria. After a short period of operation, it is observed that the MC4 connectors, which tighten the interconnection between the photovoltaic modules, are completely faulty because of sand grains carried away by a wind blowing at an average annual speed, which exceeds 6 m/s. Then, we analyzed and evaluated the connector failure to propose an appropriate solution. We checked the variations of the intrinsic temperatures of each connector employing the thermocouple for the three cases of operating temperatures, as well as the current measurement flowing through each connector, to calculate the powers dissipated in each branch of the circuit. Finally, this experimental work shows that a loss of power reaches almost 10% from the nominal power of the typical case. The proposed solution for this problem is to cover the connectors with an impervious plastic cover.

| [1] | Daher D (2017) Modeling and experimental analysis of a photovoltaic solar power plant in a maritime desert environment. Thermal[physics.class-ph]. University of Lyons. Available from: https://theses.hal.science/tel-01920874/. |
| [2] | Sørensen B, Watt G (2006) Trends in photovoltaic applications, survey report of selected IEA countries between 1992 and 2005: Report IEA-PVPS T1-15: 2006. IEA Press. Available from: http://www.iea-pvps.org/products/download/rep1_15pdf. |
| [3] | Maamar AT, Ladjouzi S, Taleb R, et al. (2018) Fault detection and classification for a GPV: Comparative study between the thresholding method and neural networks. Renewable Energy Rev 21: 45–53. Available from: https://www.cder.dz/download/Art21-1_6.pdf. |
| [4] |
Gong YJ, Wang Z, Lai ZY, et al. (2021) TVACPSO-assisted analysis of the effects of temperature and irradiance on the PV module performances. Energy 227: 120390. https://doi.org/10.1016/j.energy.2021.120390 doi: 10.1016/j.energy.2021.120390

|
| [5] |
khanam S, Meraj Md, Azhar Md, et al. (2021) Comparative performance analysis of photovoltaic modules of different materials for four different climatic zone of India. Urban Clime 39: 100957. https://doi.org/10.1016/j.uclim.2021.100957 doi: 10.1016/j.uclim.2021.100957
|
| [6] |
Ameur A, Berrada A, Bouaichi A, et al. (2022) Long-term performance and degradation analysis of different PV modules under temperate climate. Renewable Energy 188: 37–51. https://doi.org/10.1016/j.renene.2022.02.025 doi: 10.1016/j.renene.2022.02.025
|
| [7] |
Takeguchi K, Nakayama K, Chantana J, et al. (2020) Spectral gain and loss of different-type photovoltaic modules through average photon energy of various locations in Japan. Sol Energy 214: 1–10. https://doi.org/10.1016/j.solener.2020.10.092 doi: 10.1016/j.solener.2020.10.092
|
| [8] |
Aboagye B, Gyamfi S, Antwi EO, et al. (2021) Degradation analysis of installed solar photovoltaic (PV) modules under outdoor conditions in Ghana. Energy Rep 7: 6921–6931. https://doi.org/10.1016/j.egyr.2021.10.046 doi: 10.1016/j.egyr.2021.10.046
|
| [9] |
Singh R, Sharma M, Yadav K (2022) Degradation and reliability analysis of photovoltaic modules after operating for 12 years: A case study with comparisons. Renewanle Energy 196 : 1170–1186. https://doi.org/10.1016/j.renene.2022.07.048 doi: 10.1016/j.renene.2022.07.048
|
| [10] |
Dahbi H, Aoun N, Sellam M (2021) Performance analysis and investigation of a six MW grid-connected ground-based PV plant installed in hot desert climate conditions. Int J Energy Environ Eng 12: 577–587. https://doi.org/10.1007/s40095-021-00389-x doi: 10.1007/s40095-021-00389-x
|
| [11] |
Bouraiou A, Hamouda M, Chaker A, et al. (2018) Experimental investigation of observed defects in crystalline silicon PV modules under outdoor hot dry climatic conditions in Algeria. Sol Energy 159: 475–487. https://doi.org/10.1016/j.solener.2017.11.018 doi: 10.1016/j.solener.2017.11.018
|
| [12] |
Boussaid M, Belghachi A, Agroui K, et al. (2016) Solar cell degradation under open circuit condition in out-doors-in desert region. Results Phys 6: 837–842. https://doi.org/10.1016/j.rinp.2016.09.013 doi: 10.1016/j.rinp.2016.09.013
|
| [13] |
Ali Sadat S, Faraji J, Nazififard M, et al. (2021) The experimental analysis of dust deposition effect on solar photovoltaic panels in Iran's desert environment. Sustainable Energy Technol Assess 47: 101–542. https://doi.org/10.1016/j.seta.2021.101542 doi: 10.1016/j.seta.2021.101542
|
| [14] |
Zhao W, Lv YK, Zhou QW, et al. (2021) Investigation on particle deposition criterion and dust accumulation impact on solar PV module performance. Energy 233: 121–240. https://doi.org/10.1016/j.energy.2021.121240 doi: 10.1016/j.energy.2021.121240
|
| [15] |
Jiang Y, Lu L, Lu H (2016) A novel model to estimate the cleaning frequency for dirty solar photovoltaic (PV) modules in desert environment. Sol Energy 140: 236–240. https://doi.org/10.1016/j.solener.2016.11.016 doi: 10.1016/j.solener.2016.11.016
|
| [16] |
Benabdelkrim B, Benattilah A, Ghaitaoui T, et al. (2021) Experimental analysis of a photovoltaic power plant in a desert environment-Adrar area. Algerian J Renewable Energy Sustainable Dev 3: 85–96. https://doi.org/10.46657/ajresd.2021.3.1.9 doi: 10.46657/ajresd.2021.3.1.9
|
| [17] |
Mohammad AT, Al-Shohani WA (2022) Numerical and experimental investigation for analyzing the temperature influence on the performance of photovoltaic module. AIMS Energy 10: 1026–1045. https://doi.org/10.3934/energy.2022047 doi: 10.3934/energy.2022047
|
| [18] |
Muzaffar A, Hafiz MA, Waqar M, et al. (2015) Performance enhancement of PV cells through micro-channel cooling. AIMS Energy 3: 699–710. https://doi.org/10.3934/energy.2015.4.699 doi: 10.3934/energy.2015.4.699
|
| [19] |
Abdulrahman JB, Nasim U, Ahmed A, et al. (2022) Current model predictive fault-tolerant control for grid-connected photovoltaic system. AIMS Energy 10: 273–291. https://doi.org/10.3934/energy.2022015 doi: 10.3934/energy.2022015
|
| [20] |
Wei A, Yifan Z, Bo P, et al. (2021) Synergistic design of an integrated PV/distillation solar system based on nanofluid spectral splitting technique. AIMS Energy 9: 534–557. https://doi.org/10.3934/energy.2021026 doi: 10.3934/energy.2021026
|
| [21] |
Mesude B, Kirby C, Jeffrey R, et al. (2015) An automated model for rooftop PV systems assessment in ArcGIS using LIDAR. AIMS Energy 3: 401–420. https://doi.org/10.3934/energy.2015.3.401 doi: 10.3934/energy.2015.3.401
|
| [22] | Solar inverter and MC4 connectors. Available from: https://imeonenergy.com/accessoires/accessoires-onduleur-9-12/onduleur-solaire-connecteurs-mc4. |
| [23] | Photovoltaic connectivity: The MC4 and its cousins-Photovoltaic Forum. Available from: https://forum-photovoltaique.fr/viewtopic.php?t = 32400. |
| [24] |
Mohamed B, Fadela B, Mounir K (2015) Optimization of the wind turbines location in Kaberten wind farm in Algeria. Energy Proc 74: 122–129. https://doi.org/10.1016/j.egypro.2015.07.532 doi: 10.1016/j.egypro.2015.07.532
|
| [25] | Adrar climate: Average temperature, weather by month. Available from: https://en.climate-data.org/africa/algeria/adrar/adrar-44519/#temperature-graph consulté le 21 mars 2023. |
| [26] | Puydarrieux S, Pou JM, Leblond L, et al. (2019) Role of measurement uncertainty in conformity assessment. In 19th International Congress of Metrology (CIM2019), Paris, France https://doi.org/10.1051/metrology/201916003 |
| [27] | Boussaid M (2017) Mathematical models of the phenomenon of aging and degradation of photovoltaic cells and modules. Ahmed Draia University, Adrar, Doctoral thesis. |
| [28] |
Szultka S, Czapp S, Tomaszewski A, et al. (2023) Evaluation of fire hazard in electrical installations due to unfavorable ambient thermal conditions. Fire 6: 41. https://doi.org/10.3390/fire6020041 doi: 10.3390/fire6020041
|
| [29] |
Arévalo P, Benavides D, Tostado-Véliz M, et al. (2023) Smart monitoring method for photovoltaic systems and failure control based on power smoothing techniques. Renewable Energy 205: 366–383. https://doi.org/10.1016/j.renene.2023.01.059 doi: 10.1016/j.renene.2023.01.059
|
| [30] |
Benavides D, Arévalo P, Aguado JA, et al. (2023) Experimental validation of a novel power smoothing method for on-grid photovoltaic systems using supercapacitors. Int J Electrical Power Energy Syst 149: 109050. https://doi.org/10.1016/j.ijepes.2023.109050 doi: 10.1016/j.ijepes.2023.109050
|


Figures(22) / Tables(4)

Mebarek LAHBIB, Mohammed BOUSSAID, Houcine MOUNGAR, Ahmed TAHRI. Analytical assessment of the filed results on the PV system connectors performance under operating temperature[J]. AIMS Energy, 2023, 11(3): 555-575. doi: 10.3934/energy.2023029


 DownLoad: