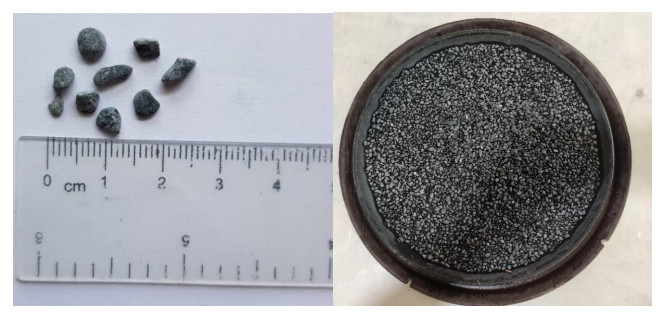
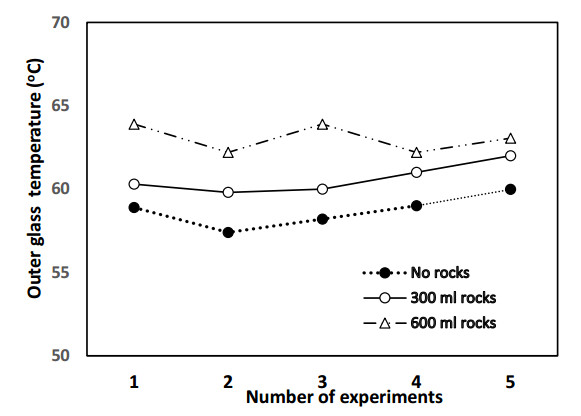
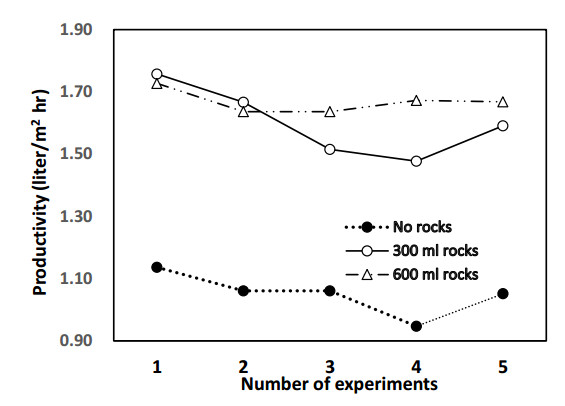
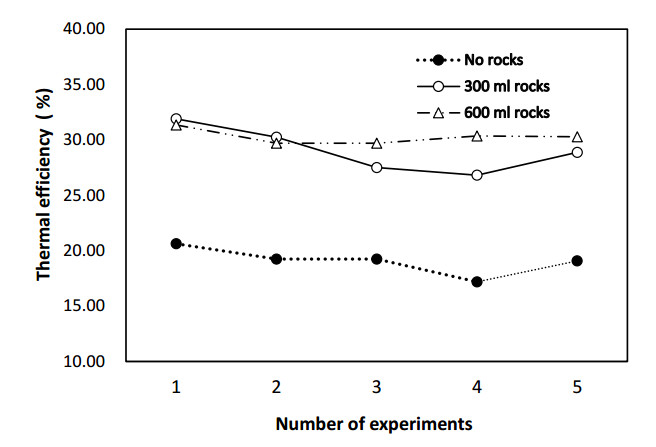
Transformation of salty seawater into fresh water by the aid of solar energy is one of the solutions for overcoming the lack of these waters with an eco-friendly procedure. The use of solar stills is one of the solutions that use solar energy with a simple design to produce fresh water in small to moderate amounts. Hemispherical solar stills are one kind of still design that does not require a particle rotational orientation, and they have proved to be more efficient than traditional designs. Solar stills generally possess a low thermal efficiency, with limitations of working hours, i.e., only daytime. To overcome these problems, rocks placed in the saline water basin are used as heat storage materials to increase the working period of the design. In the present work, different amounts of river rocks are utilized to study the effect of this addition experimentally. Steady state tests are conducted to study the influence of these additive rocks on the enhancement of solar energy absorption, since increased working time is assured by published research. Two volumes of rocks (300 mL and 600 mL) were tested, and both increased water productivity, by 52% and 58%, respectively. The increases are explained by the increases in solar energy absorption, since steady state cases were used.
Citation: Wisam A. Abd Al-wahid, Hussein Awad Kurdi Saad, Zahraa Hamzah Hasan, Kamaruzzaman Sopian. Experimental study of the performance of hemispherical solar still with optimum value of rocks as heat transfer enhancers[J]. AIMS Energy, 2022, 10(4): 885-899. doi: 10.3934/energy.2022040
Transformation of salty seawater into fresh water by the aid of solar energy is one of the solutions for overcoming the lack of these waters with an eco-friendly procedure. The use of solar stills is one of the solutions that use solar energy with a simple design to produce fresh water in small to moderate amounts. Hemispherical solar stills are one kind of still design that does not require a particle rotational orientation, and they have proved to be more efficient than traditional designs. Solar stills generally possess a low thermal efficiency, with limitations of working hours, i.e., only daytime. To overcome these problems, rocks placed in the saline water basin are used as heat storage materials to increase the working period of the design. In the present work, different amounts of river rocks are utilized to study the effect of this addition experimentally. Steady state tests are conducted to study the influence of these additive rocks on the enhancement of solar energy absorption, since increased working time is assured by published research. Two volumes of rocks (300 mL and 600 mL) were tested, and both increased water productivity, by 52% and 58%, respectively. The increases are explained by the increases in solar energy absorption, since steady state cases were used.

| [1] |
Patel Raj V, Bharti K, Singh G, et al. (2021) Solar still performance investigation by incorporating the shape of basin liner: A short review. Materialstoday: Proc 43: 597–604. https://doi.org/10.1016/j.matpr.2020.12.142 doi: 10.1016/j.matpr.2020.12.142

|
| [2] |
Madiouli J, Lashin A, Shigidi I, et al. (2020) Experimental study and evaluation of single slope solar still combined with flat plate collector, parabolic trough and packed bed. Sol Energy 196: 358–366. https://doi.org/10.1016/j.solener.2019.12.027 doi: 10.1016/j.solener.2019.12.027
|
| [3] |
Tiwari GN, Mishra AK, Meraj Md, et al. (2020) Effect of shape of condensing cover on energy and exergy analysis of a PVT-CPC active solar distillation system. Sol Energy 205: 113–125. https://doi.org/10.1016/j.solener.2020.04.084 doi: 10.1016/j.solener.2020.04.084
|
| [4] |
Naveenkumar R, Gurumoorthy G, Kunjithapatham G, et al. (2020) Impact of adding various nano materials in the efficiency of single slope solar still: A review. Materialstoday: Proc 33: 3942–3946. https://doi.org/10.1016/j.matpr.2020.06.275 doi: 10.1016/j.matpr.2020.06.275
|
| [5] |
Panchal HN, Patel S (2017) An extensive review on different designs and climatic parameters to increase distillate output of solar still. Renewable Sustainable Energy Rev 69: 750–758. https://doi.org/10.1016/j.rser.2016.09.001 doi: 10.1016/j.rser.2016.09.001
|
| [6] |
Badran OO (2007) Experimental study of the enhancement parameters on a single slope solar still productivity. Desalination 209: 136–143. https://doi.org/10.1016/j.desal.2007.04.022 doi: 10.1016/j.desal.2007.04.022
|
| [7] |
Al-Madhhachi H, Smaisim GF (2021) Experimental and numerical investigations with environmental impacts of affordable square pyramid solar still. Sol Energy 216: 303–314. https://doi.org/10.1016/j.solener.2020.12.051 doi: 10.1016/j.solener.2020.12.051
|
| [8] |
Sathyamurthy R, Kennady HJ, Nagarajan PK, et al. (2014) Factors affecting the performance of triangular pyramid solar still. Desalination 344: 383–390. https://doi.org/10.1016/j.desal.2014.04.005 doi: 10.1016/j.desal.2014.04.005
|
| [9] |
Kaviti AK, Naike VR, Ram AS, et al. (2021) Energy and exergy analysis of double slope solar still with Aluminum truncated coin fins. Materialstoday: Proc 45: 5387–5394. https://doi.org/10.1016/j.matpr.2021.02.047 doi: 10.1016/j.matpr.2021.02.047
|
| [10] |
Gad HE, El-Din Sh S, Hussien AA, et al. (2015) Thermal analysis of a conical solar still performance: An experimental study. Sol Energy 122: 900–909. https://doi.org/10.1016/j.solener.2015.10.016 doi: 10.1016/j.solener.2015.10.016
|
| [11] |
Kabeel AE, Harby K, Abdelgaied M, et al. (2021) Performance improvement of a tubular solar still using V-corrugated absorber with wick materials: Numerical and experimental investigations. Sol Energy 217: 187–199. https://doi.org/10.1016/j.solener.2021.02.008 doi: 10.1016/j.solener.2021.02.008
|
| [12] |
Elashmawy M, Alhadri M, Ahmed MMZ (2021) Enhancing tubular solar still performance using novel PCM-tubes. Desalination 500: 114880. https://doi.org/10.1016/j.desal.2020.114880 doi: 10.1016/j.desal.2020.114880
|
| [13] |
Abd Al-wahid W (2018) Theoretical study of the effect of water basin shape on productivity of tubular solar still. Univ Thi-Qar J Eng Sci 9: 1–9. https://doi.org/10.31663/tqujes.9.2.326(2018) doi: 10.31663/tqujes.9.2.326(2018)
|
| [14] |
Dhiman NK (1988) Transient analysis of a spherical solar still. Desalination 69: 47–55. https://doi.org/10.1016/0011-9164(88)80005-5 doi: 10.1016/0011-9164(88)80005-5
|
| [15] |
Attia MElH, Kabeel AE, Abdelgaied M, et al. (2021) Enhancement of hemispherical solar still productivity using iron, zinc, and copper trays. Sol Energy 216: 295–302. https://doi.org/10.1016/j.solener.2021.01.038 doi: 10.1016/j.solener.2021.01.038
|
| [16] |
Khan MZ, Nawaz I, Tiwari GN, et al. (2021) Effect of top cover cooling on the performance of hemispherical solar still. Materialtoday: Proc 38: 384–390. https://doi.org/10.1016/j.matpr.2020.07.513 doi: 10.1016/j.matpr.2020.07.513
|
| [17] |
Arunkumar T, Jayaprakash R, Denkenberger D, et al. (2012) An experimental study on a hemispherical solar still. Desalination 286: 342–348. https://doi.org/10.1016/j.desal.2011.11.047 doi: 10.1016/j.desal.2011.11.047
|
| [18] |
Ismail BI (2009) Design and performance of a transportable hemispherical solar still. Renewable Energy 34: 145–150. https://doi.org/10.1016/j.renene.2008.03.013 doi: 10.1016/j.renene.2008.03.013
|
| [19] |
Khalilmoghadam P, Rajabi-Ghahnavieh A, Shafii MB (2021) A novel energy storage system for latent heat recovery in solar still using phase change material and pulsating heat pipe. Renewable Energy 163: 2115–2127. https://doi.org/10.1016/j.renene.2020.10.073 doi: 10.1016/j.renene.2020.10.073
|
| [20] |
Patel M, Patel C, Panchal H (2020) Performance analysis of conventional triple basin solar still with evacuated heat pipes, corrugated sheets and storage materials. Groundwater Sustainable Dev 11: 100387. https://doi.org/10.1016/j.gsd.2020.100387 doi: 10.1016/j.gsd.2020.100387
|
| [21] |
Nahhas T, Py X, Sadiki N (2019) Experimental investigation of basalt rocks as storage material for high temperature concentrated solar power plant. Renewable Sustainable Energy Rev 110: 226–235. https://doi.org/10.1016/j.rser.2019.04.060 doi: 10.1016/j.rser.2019.04.060
|
| [22] |
El Alami K, Asbik M, Agalit H (2020) Identification of natural rocks as storage materials in thermal energy storage (TES) system of concentrated solar power (CSP) plants—A review. Sol Energy Mater Sol Cells 217: 110599. https://doi.org/10.1016/j.solmat.2020.110599 doi: 10.1016/j.solmat.2020.110599
|
| [23] |
Saravanan NM, Rajakumar S, Moshi AAM (2021) Experimental investigation on the performance enhancement of single basin double slope solar still using kanchey marbles as sensible heat storage materials. Materialstoday: Proc 39: 1600–1604. https://doi.org/10.1016/j.matpr.2020.05.710 doi: 10.1016/j.matpr.2020.05.710
|
| [24] | Tuly SS, Rahman MS, Sarker MRI, et al. (2021) Combined influence of fin, phase change material, wick, and external condenser on the thermal performance of a double slope solar still. 287: 125458. https://doi.org/10.1016/j.jclepro.2020.125458 |
| [25] |
Tuly SS, Sarker MRI, Das BK, et al. (2021) Effects of design and operational parameters on the performance of a solar distillation system: A comprehensive review. Groundwater Sustainable Dev 14: 100599. https://doi.org/10.1016/j.gsd.2021.100599 doi: 10.1016/j.gsd.2021.100599
|
| [26] |
Khadim MAbdAl-Amir, Al-Wahid WAAbd, Hachim DM, et al. (2021) Experimental study of the performance of cylindrical solar still with a hemispherical dome. Smart Sci 9: 30–39. https://doi.org/10.1080/23080477.2021.1876298 doi: 10.1080/23080477.2021.1876298
|
| [27] |
Nourgriaya SK, Chopra MK, Gupta B, et al. (2021) Influence of basin water depth and energy storage materials on productivity of solar still: A review. Materialstoday: Proc 44: 1589–1603. https://doi.org/10.1016/j.matpr.2020.11.796 doi: 10.1016/j.matpr.2020.11.796
|
| [28] | Wheeler AJ, Ganji AR (1996) Introduction to engineering experimentation. Prentice Hall, Englewood Cliffs, New Jersey, 1996. Available from: https://books.google.com/books?id=9nXBQgAACAAJ&source=gbs_book_other_versions. |

Figures(16) / Tables(1)

Wisam A. Abd Al-wahid, Hussein Awad Kurdi Saad, Zahraa Hamzah Hasan, Kamaruzzaman Sopian. Experimental study of the performance of hemispherical solar still with optimum value of rocks as heat transfer enhancers[J]. AIMS Energy, 2022, 10(4): 885-899. doi: 10.3934/energy.2022040


 DownLoad: