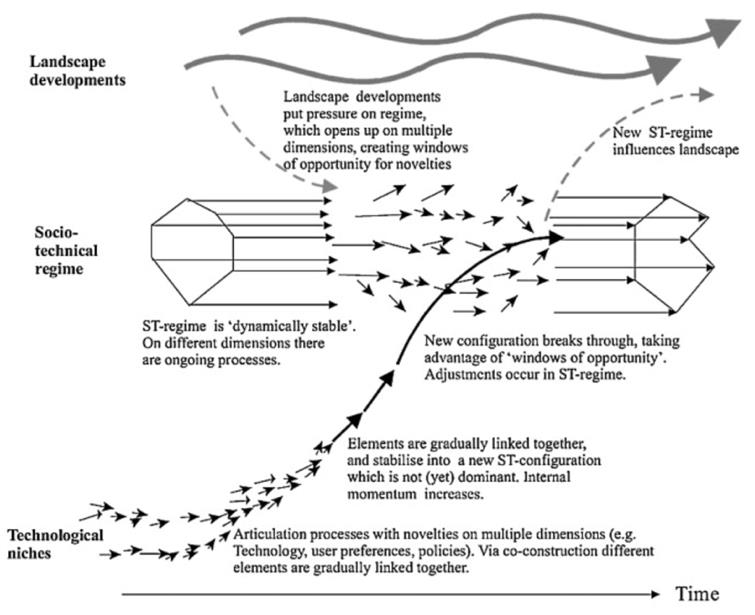
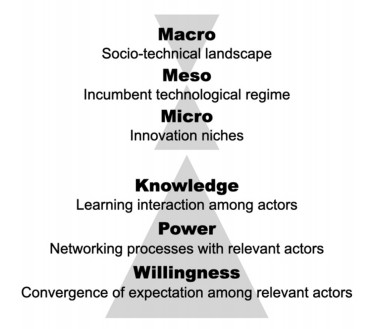
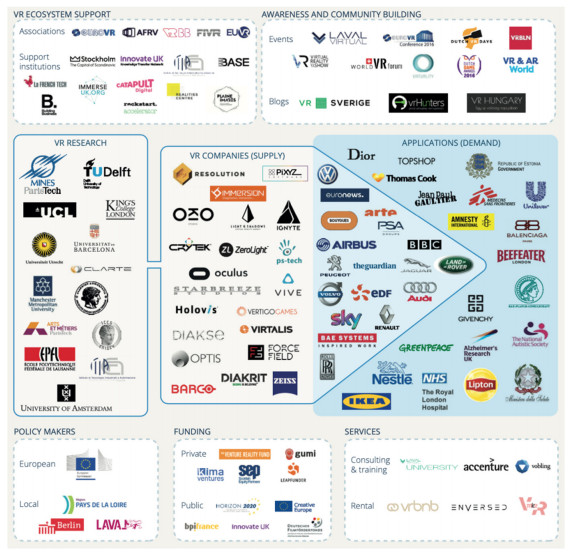
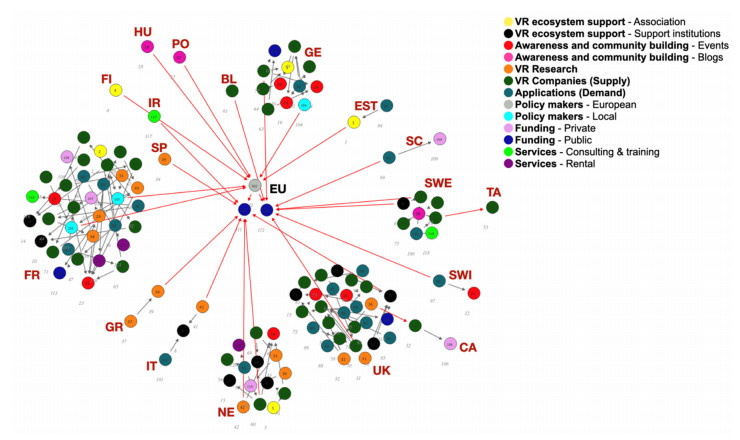
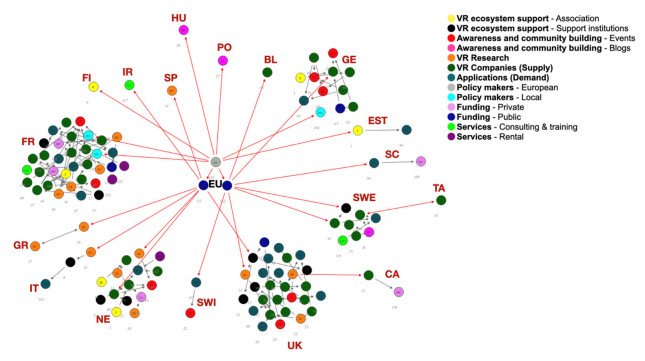
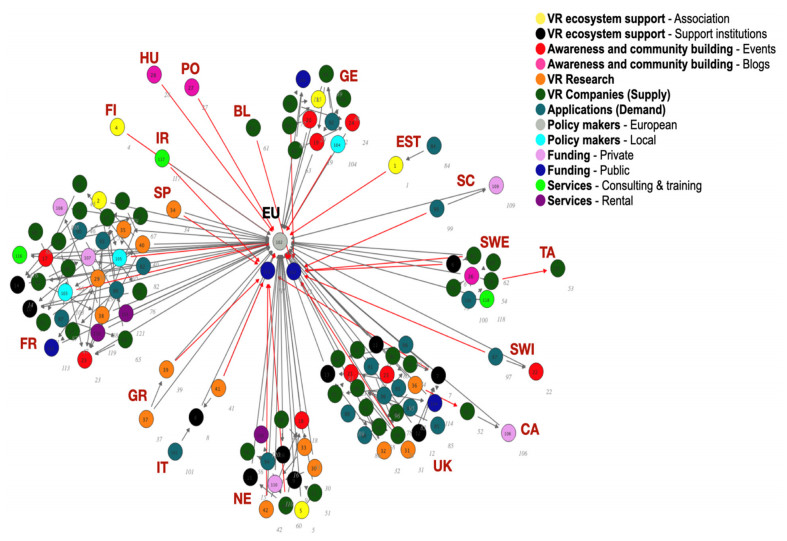
The paper investigates the socio-technical transition pathways related to innovation niches formation merging the theoretical framework of Strategic Niche Management (SNM) with the Social Network Analysis (SNA) technique. Specifically, focusing on the niche of the virtual and augmented reality, this work tries to shed light on the understanding of the niche development and the related transition towards sustainability. Combining SNM with SNA and utilizing a specific taxonomy, the study allows appreciating the actual cognitive interaction among niche members that determine the transition to succeed. Results show that the investigated niche is characterized by an embryonic stage of development which needs a better support to advance technological shift in order to reinforce the link between Industry 4.0 paradigm and Circular Economy (CE).
Citation: Patrizio Giganti, Pasquale Marcello Falcone. Socio-technical transitions and innovation niches: the case of the virtual and augmented reality in Europe[J]. AIMS Energy, 2021, 9(4): 755-774. doi: 10.3934/energy.2021035
The paper investigates the socio-technical transition pathways related to innovation niches formation merging the theoretical framework of Strategic Niche Management (SNM) with the Social Network Analysis (SNA) technique. Specifically, focusing on the niche of the virtual and augmented reality, this work tries to shed light on the understanding of the niche development and the related transition towards sustainability. Combining SNM with SNA and utilizing a specific taxonomy, the study allows appreciating the actual cognitive interaction among niche members that determine the transition to succeed. Results show that the investigated niche is characterized by an embryonic stage of development which needs a better support to advance technological shift in order to reinforce the link between Industry 4.0 paradigm and Circular Economy (CE).

| [1] |
Essletzbichler J (2012) Renewable energy technology and path creation: A multi-scalar approach to energy transition in the UK. Eur Plan Stud 20: 791-816. doi: 10.1080/09654313.2012.667926

|
| [2] |
Markard J, Raven R, Truffer B (2012) Sustainability transitions: An emerging field of research and its prospects. Res Policy 41: 955-967. doi: 10.1016/j.respol.2012.02.013
|
| [3] |
Kemp R, Schot J, Hoogma R (1998) Regime shifts to sustainability through processes of niche formation: The approach of strategic niche management. Technol Anal Strategic Manage 10: 175-198. doi: 10.1080/09537329808524310
|
| [4] |
Schot J, Hoogma R, Elzen B (1994) Strategies for shifting technological systems: The case of the automobile system. Futures 26: 1060-1076. doi: 10.1016/0016-3287(94)90073-6
|
| [5] |
Hermans F, Van Apeldoorn D, Stuiver M, et al. (2013) Niches and networks: Explaining network evolution through niche formation processes. Res Policy 42: 613-623. doi: 10.1016/j.respol.2012.10.004
|
| [6] |
Kemp R, Loorbach D, Rotmans J (2007) Transition management as a model for managing processes of co-evolution towards sustainable development. Int J Sustainable Dev World Ecol 14: 78-91. doi: 10.1080/13504500709469709
|
| [7] | Elzen B, Geels FW, Green K (2004) System innovation and the transition to sustainability: theory, evidence and policy. Edward Elgar Publishing, ISBN 1845423429. |
| [8] |
Arranz N, Arroyabe MF, Schumann M (2020) The role of NPOs and international actors in the national innovation system: A network-based approach. Technol Forecast Soc Change 159: 120183. doi: 10.1016/j.techfore.2020.120183
|
| [9] | Falcone PM, D'Alisa G, Germani AR, et al. (2020) When all seemed lost. A social network analysis of the waste-related environmental movement in Campania, Italy. Polit Geogr, 77. |
| [10] | Upadhyay A (2020) Antecedents of green supply chain practices in developing economies. Manage Environ Qual An Int J. |
| [11] |
Musiolik J, Markard J, Hekkert M (2012) Networks and network resources in technological innovation systems: Towards a conceptual framework for system building. Technol Forecast Soc Change 79: 1032-1048. doi: 10.1016/j.techfore.2012.01.003
|
| [12] |
Morone P, Falcone PM, Tartiu VE (2019) Food waste valorisation: Assessing the effectiveness of collaborative research networks through the lenses of a COST action. J Clean Prod 238: 117868. doi: 10.1016/j.jclepro.2019.117868
|
| [13] |
Magnusson T, Berggren C (2018) Competing innovation systems and the need for redeployment in sustainability transitions. Technol Forecast Soc Change 126: 217-230. doi: 10.1016/j.techfore.2017.08.014
|
| [14] |
Leon RD, Rodríguez-Rodríguez R, Gómez-Gasquet P, et al. (2017) Social network analysis: A tool for evaluating and predicting future knowledge flows from an insurance organization. Technol Forecast Soc Change 114: 103-118. doi: 10.1016/j.techfore.2016.07.032
|
| [15] |
Nugroho Y, Saritas O (2009) Incorporating network perspectives in foresight: A methodological proposal. Foresight 11: 21-41. doi: 10.1108/14636680911004948
|
| [16] |
Caniëls MCJ, Romijn HA (2008) Actor networks in strategic niche management: insights from social network theory. Futures 40: 613-629. doi: 10.1016/j.futures.2007.12.005
|
| [17] |
Lopolito A, Morone P, Sisto R (2011) Innovation niches and socio-technical transition: A case study of bio-refinery production. Futures 43: 27-38. doi: 10.1016/j.futures.2010.03.002
|
| [18] |
Falcone PM, Lopolito A, Sica E (2018) The networking dynamics of the Italian biofuel industry in time of crisis: Finding an effective instrument mix for fostering a sustainable energy transition. Energy Policy 112: 334-348. doi: 10.1016/j.enpol.2017.10.036
|
| [19] |
Upadhyay A, Laing T, Kumar V, et al. (2021) Exploring barriers and drivers to the implementation of circular economy practices in the mining industry. Resour Policy 72: 102037. doi: 10.1016/j.resourpol.2021.102037
|
| [20] | Upadhyay A, Akter S, Adams L, et al. (2019) Investigating "circular business models" in the manufacturing and service sectors. J Manuf Technol Manage, 30. |
| [21] |
Upadhyay A, Mukhuty S, Kumar V, et al. (2021) Blockchain technology and the circular economy: Implications for sustainability and social responsibility. J Clean Prod 293: 126130. doi: 10.1016/j.jclepro.2021.126130
|
| [22] | Upadhyay A, Kumar A, Akter S (2021) An analysis of UK retailers' initiatives towards circular economy transition and policy-driven directions. Clean Technol Environ Policy, 1-9. |
| [23] |
Falcone PM (2019) Tourism-based circular economy in Salento (South Italy): A SWOT-ANP analysis. Soc Sci 8: 216. doi: 10.3390/socsci8070216
|
| [24] | MacArthur E (2013) Towards the circular economy. J Ind Ecol 2: 23-44. |
| [25] | Rüßmann M, Lorenz M, Gerbert P, et al. (2015) Industry 4.0: The future of productivity and growth in manufacturing industries. Bost Consult Gr 9: 54-89. |
| [26] |
Gorissen L, Vrancken K, Manshoven S (2016) Transition thinking and business model innovation—towards a transformative business model and new role for the reuse centers of Limburg, Belgium. Sustainability 8: 112. doi: 10.3390/su8020112
|
| [27] | Liao Y, Deschamps F, Loures ER, et al. (2017) Past, present and future of Industry 4.0-a systematic literature review and research agenda proposal. Int J Prod Res 55: 3609-3629. |
| [28] | Smart P, Hemel S, Lettice F, et al. (2017) Pre-paradigmatic status of industrial sustainability: a systematic review. Int J Oper Prod Manage, 37. |
| [29] |
Ge X, Jackson J (2014) The big data application strategy for cost reduction in automotive industry. SAE Int J Commer Veh 7: 588-598. doi: 10.4271/2014-01-2410
|
| [30] |
Antikainen M, Uusitalo T, Kivikytö-Reponen P (2018) Digitalisation as an enabler of circular economy. Procedia CIRP 73: 45-49. doi: 10.1016/j.procir.2018.04.027
|
| [31] | Askoxylakis I (2018) A framework for pairing circular economy and the Internet of Things. In Proceedings of the 2018 IEEE International Conference on Communications (ICC); IEEE, 1-6. |
| [32] | Wang Y, Zhang M, Zuo Y (2016) Potential applications of IoT-based product lifecycle energy management. In Proceedings of the 2016 IEEE 11th Conference on Industrial Electronics and Applications (ICIEA), 1999-2002. |
| [33] |
Soroka A, Liu Y, Han L, et al. (2017) Big data driven customer insights for SMEs in redistributed manufacturing. Procedia CIRP 63: 692-697. doi: 10.1016/j.procir.2017.03.319
|
| [34] | Isaksson O, Hallstedt SI, Rönnbäck AÖ (2018) Digitalisation, sustainability and servitisation: Consequences on product development capabilities in manufacturing firms. DS 91 Proc Nord 2018, Linköping, Sweden, 14th—17th August 2018. |
| [35] | van Schaik A, Reuter MA (2016) Recycling indices visualizing the performance of the circular economy. World Met Erzmetall 69: 5-20. |
| [36] |
Lahrour Y, Brissaud DA (2018) technical assessment of product/component re-manufacturability for additive remanufacturing. Procedia Cirp 69: 142-147. doi: 10.1016/j.procir.2017.11.105
|
| [37] |
Demestichas K, Daskalakis E (2020) Information and Communication Technology Solutions for the Circular Economy. Sustainability 12: 7272. doi: 10.3390/su12187272
|
| [38] | Grin J, Rotmans J, Schot J (2010) Transitions to sustainable development: new directions in the study of long term transformative change; Routledge; ISBN 1135151180. |
| [39] |
Smith A, Stirling A, Berkhout F (2005) The governance of sustainable socio-technical transitions. Res Policy 34: 1491-1510. doi: 10.1016/j.respol.2005.07.005
|
| [40] | Jæger B, Menebo MM, Upadhyay A (2021) Identification of environmental supply chain bottlenecks: a case study of the Ethiopian healthcare supply chain. Manage Environ Qual An Int J. |
| [41] |
Geels FW (2002) Technological transitions as evolutionary reconfiguration processes: A multi-level perspective and a case-study. Res Policy 31: 1257-1274. doi: 10.1016/S0048-7333(02)00062-8
|
| [42] |
Geels FW (2011) The multi-level perspective on sustainability transitions: Responses to seven criticisms. Environ Innov Soc Transitions 1: 24-40. doi: 10.1016/j.eist.2011.02.002
|
| [43] |
Falcone PM (2018) Analysing stakeholders' perspectives towards a socio-technical change: The energy transition journey in Gela Municipality. AIMS Energy 6: 645-657. doi: 10.3934/energy.2018.4.645
|
| [44] |
Geels FW, Schot J (2007) Typology of sociotechnical transition pathways. Res Policy 36: 399-417. doi: 10.1016/j.respol.2007.01.003
|
| [45] |
White GRT, Cicmil S, Upadhyay A, et al. (2019) The soft side of knowledge transfer partnerships between universities and small to medium enterprises: An exploratory study to understand process improvement. Prod Plan Control 30: 907-918. doi: 10.1080/09537287.2019.1582098
|
| [46] |
Scholz RW, Spoerri A, Lang DJ (2009) Problem structuring for transitions: The case of Swiss waste management. Futures 41: 171-181. doi: 10.1016/j.futures.2008.09.013
|
| [47] | Raven R (2005) Strategic niche management for biomass. Eindhoven Univ Netherlands. |
| [48] |
Spielman DJ, Davis K, Negash M, et al. (2011) Rural innovation systems and networks: findings from a study of Ethiopian smallholders. Agric Human Values 28: 195-212. doi: 10.1007/s10460-010-9273-y
|
| [49] |
Freeman LC (1978) Centrality in social networks conceptual clarification. Soc Networks 1: 215-239. doi: 10.1016/0378-8733(78)90021-7
|
| [50] |
Meagher K, Rogers M (2004) Network density and R & D spillovers. J Econ Behav Organ 53: 237-260. doi: 10.1016/j.jebo.2002.10.004
|
| [51] |
Cowan R, Jonard N (2004) Network structure and the diffusion of knowledge. J Econ Dyn Control 28: 1557-1575. doi: 10.1016/j.jedc.2003.04.002
|
| [52] | Steuer J (1992) Defining virtual reality: Dimensions determining telepresence. J Commun 42: 73-93. |
| [53] | Lee K (2012) Augmented reality in education and training. TechTrends 56: 13-21. |
| [54] |
Azuma RT (1997) A survey of augmented reality. Presence Teleoperators Virtual Environ 6: 355-385. doi: 10.1162/pres.1997.6.4.355
|
| [55] | Hirve SA, Kunjir A, Shaikh B, et al. (2017) An approach towards data visualization based on AR principles. In Proceedings of the 2017 International Conference on Big Data Analytics and Computational Intelligence (ICBDAC), 128-133. |
| [56] | Bezegová E, Ledgard M, Molemaker RJ, et al. (2017) Virtual reality and its potential for Europe. Ecorys, Bruxells. |
| [57] | Watts DJ (2004) Small worlds: the dynamics of networks between order and randomness; Princeton university press; ISBN 0691117047. |
| [58] |
Nobre GC, Tavares E (2017) Scientific literature analysis on big data and internet of things applications on circular economy: a bibliometric study. Scientometrics 111: 463-492. doi: 10.1007/s11192-017-2281-6
|
| [59] |
Bressanelli G, Adrodegari F, Perona M, et al. (2018) Exploring how usage-focused business models enable circular economy through digital technologies. Sustainability 10: 639. doi: 10.3390/su10030639
|
| [60] |
Baines T, Lightfoot HW (2014) Servitization of the manufacturing firm. Int J Oper Prod Manage 34: 2-35. doi: 10.1108/IJOPM-02-2012-0086
|
| [61] | Kamp B, Parry G (2017) Servitization and advanced business services as levers for competitiveness. Ind Mark Manage, 60. |
| [62] |
Lenka S, Parida V, Wincent J (2017) Digitalization capabilities as enablers of value co‐creation in servitizing firms. Psychol Mark 34: 92-100. doi: 10.1002/mar.20975
|
| [63] |
Despeisse M, Baumers M, Brown P, et al. (2017) Unlocking value for a circular economy through 3D printing: A research agenda. Technol Forecast Soc Change 115: 75-84. doi: 10.1016/j.techfore.2016.09.021
|
| [64] | de Sousa Jabbour ABL, Jabbour CJC, Godinho Filho M, et al. (2018) Industry 4.0 and the circular economy: a proposed research agenda and original roadmap for sustainable operations. Ann Oper Res 270: 273-286. |
| [65] | Ávila-Gutiérrez MJ, Martín-Gómez A, Aguayo-González F, et al. (2019) Standardization framework for sustainability from circular economy 4.0. Sustainability 11: 6490. |
| [66] | Falcone PM (2020) Environmental regulation and green investments: The role of green finance. Int J Green Econ, 14. |
Figures(7) / Tables(6)

Patrizio Giganti, Pasquale Marcello Falcone. Socio-technical transitions and innovation niches: the case of the virtual and augmented reality in Europe[J]. AIMS Energy, 2021, 9(4): 755-774. doi: 10.3934/energy.2021035


 DownLoad: