


Figure 1.
The principle of windowing.
Citation: Daphiny Pottmaier, Marcello Baricco. Materials for hydrogen storage and the Na-Mg-B-H system[J]. AIMS Energy, 2015, 3(1): 75-100. doi: 10.3934/energy.2015.1.75
| [1] | Shuangte Wang, Hengguo Yu . Stability and bifurcation analysis of the Bazykin's predator-prey ecosystem with Holling type Ⅱ functional response. Mathematical Biosciences and Engineering, 2021, 18(6): 7877-7918. doi: 10.3934/mbe.2021391 |
| [2] | Yuhong Huo, Gourav Mandal, Lakshmi Narayan Guin, Santabrata Chakravarty, Renji Han . Allee effect-driven complexity in a spatiotemporal predator-prey system with fear factor. Mathematical Biosciences and Engineering, 2023, 20(10): 18820-18860. doi: 10.3934/mbe.2023834 |
| [3] | Eduardo González-Olivares, Claudio Arancibia-Ibarra, Alejandro Rojas-Palma, Betsabé González-Yañez . Bifurcations and multistability on the May-Holling-Tanner predation model considering alternative food for the predators. Mathematical Biosciences and Engineering, 2019, 16(5): 4274-4298. doi: 10.3934/mbe.2019213 |
| [4] | Christian Cortés García, Jasmidt Vera Cuenca . Impact of alternative food on predator diet in a Leslie-Gower model with prey refuge and Holling Ⅱ functional response. Mathematical Biosciences and Engineering, 2023, 20(8): 13681-13703. doi: 10.3934/mbe.2023610 |
| [5] | Eric M. Takyi, Charles Ohanian, Margaret Cathcart, Nihal Kumar . Dynamical analysis of a predator-prey system with prey vigilance and hunting cooperation in predators. Mathematical Biosciences and Engineering, 2024, 21(2): 2768-2786. doi: 10.3934/mbe.2024123 |
| [6] | Sangeeta Kumari, Sidharth Menon, Abhirami K . Dynamical system of quokka population depicting Fennecaphobia by Vulpes vulpes. Mathematical Biosciences and Engineering, 2025, 22(6): 1342-1363. doi: 10.3934/mbe.2025050 |
| [7] | Peter A. Braza . A dominant predator, a predator, and a prey. Mathematical Biosciences and Engineering, 2008, 5(1): 61-73. doi: 10.3934/mbe.2008.5.61 |
| [8] | Kunlun Huang, Xintian Jia, Cuiping Li . Analysis of modified Holling-Tanner model with strong Allee effect. Mathematical Biosciences and Engineering, 2023, 20(8): 15524-15543. doi: 10.3934/mbe.2023693 |
| [9] | Xiaoyuan Chang, Junjie Wei . Stability and Hopf bifurcation in a diffusivepredator-prey system incorporating a prey refuge. Mathematical Biosciences and Engineering, 2013, 10(4): 979-996. doi: 10.3934/mbe.2013.10.979 |
| [10] | Pei Yu, Xiangyu Wang . Analysis on recurrence behavior in oscillating networks of biologically relevant organic reactions. Mathematical Biosciences and Engineering, 2019, 16(5): 5263-5286. doi: 10.3934/mbe.2019263 |
Research in neuroscience and psychology has shown that EEG signals can intuitively reflect an individual's emotional changes [1]. EEG signals are subject to individual differences and are non-stationarity [2], so the construction of a cross-subject emotion recognition model has become an important research direction and has great significance. This study focuses on exploring the emotions generated by the same emotion-inducing mode between subjects and cross-subjects, and conducts training based on cross-subjects' emotional characteristics, aiming to improve the emotion classification accuracy of the cross-subjects emotion recognition model [3].
Machine learning is the method of making computers with human intelligence, which requires training models to improve themselves by learning from data, a technique that is well suited to tasks such as processing electrical brain signals. Aljuhani et al. [4] used machine learning algorithms to identify emotions from speech, extracting various spectral features, such as the Mel-frequency cepstrum coefficient (MFCC) and mel spectrum, and obtained 77.14% accuracy by the SVM method. Liu and Fu [5] trained a support vector machine in emotion recognition and proposed a multi-channel feature fusion method. The recognition accuracy of different subjects ranged from 0.70 to 0.87, and the results of PLCC and SROSS measurements reached 0.843 and 0.789. Salido Ortega et al. [6] used machine learning technology to establish individual models, general models, and gender models to automatically identify subjects' emotions, which verified that their individual emotions are highly correlated with the situation. They used the situation data to realize automatic recognition of emotions in real situations. Karbauskaite et al. [7] studied facial emotion recognition, and combining four features made the emotion classification accuracy reach 76%. Xie et al. [8] proposed a transformer-based cross-mode fusion technology and blackmail network architecture for emotion estimation, and this multi-mode network architecture can achieve an accuracy of 65%. Li et al. [9] proposed a TANN neural network. Adaptive highlighting of transferable brain region data and samples through local and global attention mechanisms was used to learn emotion discrimination information.
Deep learning is a technique that combines low-level features to form more abstract high-level features or categories, so as to learn effective feature representations from a large number of input data and apply these features to classification, regression, and information retrieval. It is also applicable to the processing of EEG signals. Jiang et al. [10] established a 5-layer CNN model to classify EEG signals, and the average accuracy reached 69.84%, 0.79% higher than that of the CVS system. Zhang and Li [11] proposed a teaching speech emotion recognition method based on multi-feature fusion deep learning, and the recognition accuracy reached 75.36%. Liu and Liu [12] applied BP (back-propagation) neural network as Technical Support and Combines EEG Signals to Classify Criminal Psychological Emotions. Liu et al. [13] used the MHED dataset to study the multi-modal fusion network of video emotion recognition based on hierarchical attention, and the accuracy was 63.08%. Quan et al. [14] showed that interpersonal characteristics can help improve the performance of automatic emotion recognition tasks, and the highest accuracy at the titer level was 76.68%. Fang et al. [15] proposed a Multi-feature Deep Forest (MFDF) model to identify human emotions.
We employed the random forest (RF) classification model in the field of machine learning. As the integration of decision trees, RF is a classifier that uses multiple trees to train and predict samples. It has the advantages of being built easily, able to obtain the importance weight of features, and is less likely to overfit. Anzai et al. [16] used the machine learning random forest algorithm to build a fragile classifier and a descent classifier to identify the frail state and fall risk of the elderly, and the overall balance accuracy for the identification of frail subjects was 75% ± 0.04%. The overall balance accuracy for classifying subjects with a recent history of falls was 0.57 ± 0.05 (F1 score: 0.62 ± 0.04).
In the field of optimization classification model, related researchers have made great progress. Zhang et al. [17] used Bayesian super parameters to optimize the stochastic forest classifier on Sentinel-2 satellite image urban land cover classification. As a result, the RF after Bayesian optimization was 0.5% higher than RF by using RGB band features, and its accuracy increased 1.8% by using multi-spectral band features. Beni and Wang [18] proposed swarm intelligence in 1989. The probabilistic search algorithm built by simulating the swarm behavior of natural organisms was intelligent, because it was independent of the optimization problem itself, required fewer parameters, had high fault tolerance, and had strong stability. Ye et al. [19] adopted a genetic algorithm to optimize the decision tree combination in the parametric optimization random forest, comparing with the actual profit, the profit score of RFoGAPS increases by 7.73%.
In recent years, the swarm intelligence algorithm based on biological characteristics has been widely used in electronic information, engineering technology, biomedicine, and other fields. Sparse Bayesian Learning for end-to-end spatio-temporal-filtering-based single-trial EEG classification (SBLEST) optimized spatio-temporal filters and the classifier simultaneously within a principled sparse Bayesian learning framework to maximize prediction accuracy [20,21]. Since feature extraction and emotion classification were completed independently at different stages in the EEG decoding process, and the research aimed to reduce the cost generated in the classification process, we put forward an optimization method that can dynamically optimize the parameters of RF model, which can improve the accuracy. At the same time, the intelligent optimization algorithm we sought should be as simple in structure as possible, easy to implement, and with few control parameters, so we selected the Sparrow Search Algorithm (SSA). We applied the SSA to optimize the key parameters of RF and improve the classification accuracy in cross-subject emotion recognition.
SSA-RF was used on the DEAP and SEED datasets, which verified that it had better adaptability, effectiveness, necessity of classification model parameters, and reduced subject dependency.
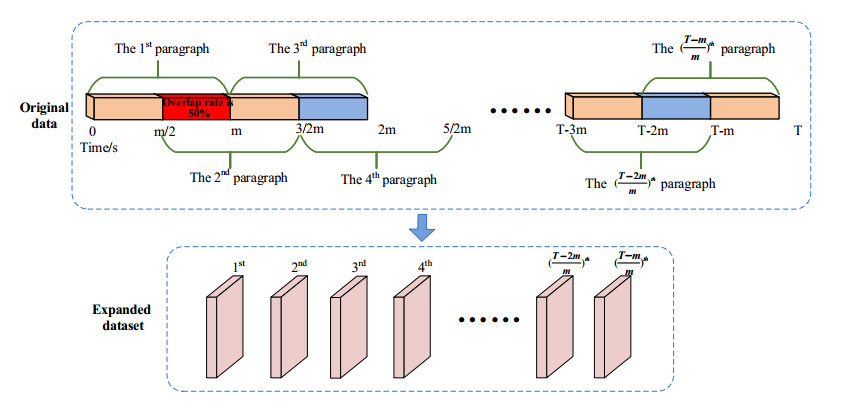
Windowing is employed to avoid overfitting which is caused by small data. For data of T $ \left(\mathrm{s}\right) $, the time window is $ \mathrm{m}\left(\mathrm{s}\right) $, and the overlap rate is 50%. The principle of windowing is shown in Figure 1.
Feature extraction is one of the crucial processing components of cross-subject emotion recognition, which can mine the hidden information of mental activity and cognitive function.
Different emotional features are reflected in different physical quantities of signals. The wavelet transform is effective in finding the optimal trade-off between time and frequency resolution. Traditional features are extracted from the time-domain, frequency-domain, and time-frequency domains [22]. Soroush et al. [23] obtained good classification accuracy by applying the characteristics of mean, skewness, and Shannon entropy. The research motivation comes from the combinations of different features [24] or principal component analysis and discrete wavelet transform for feature selection [25].
In this paper, 9 features of time domain, 2 features of frequency domain, and 1 feature of time-frequency domain are extracted for SSA-RF cross-subject emotion recognition. We used all channels, which can provide more information.
In the time domain, the zero crossing rate (ZCR), standard deviation (SD), mean, root mean square (RMS), energy (Eng), skewness, approximate entropy (ApEn), sample entropy (SampEn), and Hjorth are extracted as the features of the EEG, which are shown in Table 1.
| Feature | Definition | Formula and description | The connection to emotions |
| ZCR | The number of times the signal passes the zero value in unit time. | $ {Z}_{x}=\frac{1}{N}{Z}_{num}\left(x\right) $, where N is the length of the signal sample. Znum is the number of times the signal passes through zero in unit time. | ZCR is closely related to positive emotions. The higher the ZCR value, the more significant the positive emotions will be. |
| SD | The degree of dispersion among individuals in the sample, the amplitude of indirect reaction signal change from the mean. | $ {S}_{x}=\sqrt{\frac{\sum _{i=1}^{n}{\left({x}_{i}-\stackrel{-}{x}\right)}^{2}}{n-1}} $, where $ n $ is the number of samples, $ {x}_{i} $ is the value of each data, and $ \stackrel{-}{x} $ is the mean of the sample. | SD indirectly represents signal changes from the mean, so as to judge whether the brain activity pulls away from the stationary state. |
| Mean | Indirectly reflects the intensity of brain activity. | $ {\mu }_{\xi }=\frac{1}{T}\sum _{t=1}^{T}\xi \left(t\right) $, where $ \mathrm{\xi }\left(\mathrm{t}\right) $ is the time domain data, and T is the data length. | Mean represents the intensity of brain activity in a certain period of time, the higher the value, the greater the intensity of activity. |
| RMS | The degree to which the data value of each frame of the EEG signal deviates from the mean value of the overall sample signal. | $ rms=\sqrt{\frac{\sum _{\mathrm{i}=0}^{n}{{x}_{\mathrm{i}}}^{2}}{n}} $, where $ {x}_{\mathrm{i}} $ is the time domain signal data, and n is the sample length. | RMS represents the degree to which the data value of each frame deviates from the mean of the whole sample signal, reflecting the degree of deviation from the intensity of brain activity. |
| Eng | EEG is variable and non-stationary, and its total energy is infinite. | $ {E}_{x}={\int }_{-\mathrm{\infty }}^{\mathrm{\infty }}{\left|x\left(t\right)\right|}^{2}dt $, where $ x\left(t\right) $ represents the signal data value at a certain time, and the total energy is the integral of the square of the signal data. | Eng can capture the emotional change and evolution trend, the higher the Eng value, the stronger the positive emotion will be. |
| Skewness | The distribution symmetry of the values of a particular population is described. | $ {b}_{1}=\frac{{m}_{3}}{{s}^{3}}=\frac{\frac{1}{n}{\sum }_{i=1}^{n}{\left({x}_{i}-\overline{x}\right)}^{3}}{{\left[\frac{1}{n-1}{\sum }_{i=1}^{n}{\left({x}_{i}-\overline{x}\right)}^{2}\right]}^{3/2}} $, where $ \overline{\mathrm{x}} $ is the mean, $ \mathrm{s} $ is the standard deviation, and $ {m}_{3} $ is the third-order central matrix. | Skewness represents the degree of deviation between each frame and the normal distribution. The larger the value, the larger the skewness of its distribution form. |
| ApEn | A nonlinear parameter used to quantify the regularity and unpredictability of time series fluctuation | (1) $ {X}_{i}=\left[x\left(i\right), x\left(i+1\right), ..., x\left(i+x-1\right)\right] $ (2) $ d\left[{X}_{i}, {X}_{j}\right]=max\left|x\left(i+k\right)-x\left(j+k\right)\right|, k\in \left(0, m-1\right) $ (3) $ {B}_{i}^{m}\left(r\right)=\frac{{B}_{i}}{N-m+1} $ (4) $ {B}^{m}\left(r\right)=\frac{1}{N-m+1}\sum _{i=1}^{N-m+1}\mathrm{ln}{B}_{i}^{m}\left(r\right) $ (5) $ ApEn\left(m, r, N\right)={B}_{i}^{m}\left(r\right){-B}^{m+1}\left(r\right) $ (6) Arrange the elements of the time series X in order as vectors with m dimension (7) Define $ d\left[{X}_{i}, {X}_{j}\right] $ as the distance between vector $ {X}_{i} $ and vector $ {X}_{j} $ (8) Write $ {B}_{i}^{} $ as the number of $ d\left[{X}_{i}, {X}_{j}\right]\le r $ (r is the similarity tolerance), and calculate the ratio of $ {B}_{i}^{} $ to the total number of vectors (N-m+1) (9) Take the logarithmic operation on $ {B}_{i}^{m}\left(r\right) $, and then find its average of all $ \mathrm{i} $, and write it as $ {B}^{m}\left(r\right) $ (10) Make $ m=m+1 $ and repeat (1)–(4) to obtain $ {B}^{m+1}\left(r\right) $. (11) Final representation approximate entropy |
ApEn represents the complexity of EEG and reflects the possibility of new information. The more complex time series, the greater the value will be. |
| SampEn | The probability of generating new patterns in the sequence when measuring the complexity and dimensional changes of EEG. | (1) $ {B}_{i}^{m}\left(r\right)=\frac{1}{N-m}num\left\{d\left[{X}_{i}, {X}_{j}\right] < r\right\} $ (2) $ {B}^{m}\left(r\right)=\frac{1}{N-m+1}\sum _{i=1}^{N-m+1}{B}_{i}^{m}\left(r\right) $ (3) It is the same as the approximate entropy in the first two steps. Starting from the third step, the specific steps are as follows: (4) Given threshold $ \mathrm{r}\left(\mathrm{r} > 0\right) $, count the number of $ d\left[{X}_{i}, {X}_{j}\right] < r $ and its ratio to the total number of vectors $ \left(N-m\right) $ (5) Average the results of the previous step (6) Add dimension 𝑚 to 1 and repeat the above four steps (7) The actual number of samples is limited, and the final sample entropy is obtained |
SampEn measures the probability of generating new patterns in sequence when the EEG complexity and dimension change. The higher the probability, the greater the complexity. |
| Hjorth | Describe the three time-domain feature sets of EEG single channel, including activity, mobility, and complexity. | $ HA={\sigma }_{0}^{2} $; $ HM=\frac{{\sigma }_{1}}{{\sigma }_{0}} $; $ HC=\frac{{\sigma }_{2}{\sigma }_{0}}{{\sigma }_{1}^{2}} $ where $ {\sigma }_{0} $ is the standard deviation of the signal, and $ {\sigma }_{1} $ and $ {\sigma }_{2} $ are the standard deviations of the first and second derivatives of the signal. |
Hjorth represents the EEG changes at different time and spatial locations, thereby revealing the rules and characteristics of brain electrical activity. |
 DownLoad:
CSV
DownLoad:
CSV
We transform the time domain EEG to the frequency domain through the Fast Fourier Transform (FFT), and the Power Spectral Density (PSD) and Differential Entropy (DE) are extracted as the features, which are shown in Table 2.
| Feature | Definition | Formula and description | The connection to emotions |
| PSD | Represents the conversion of signal strength to unit bandwidth frequency, i.e. the distribution of signal strength within the frequency range. | (1) EEG signals $ s\left[0\right], s\left[1\right], \cdots \cdots, s\left[N-1\right] $ are divided into k segments, calculate the windowed discrete Fourier transform $ {S}_{k\left(v\right)} $, which is shown as follows:$ {S}_{k\left(v\right)}=\sum _{m}S\left[m\right]w\left[m\right]exp\left(-j2\pi vm\right) $ where, $ m $ is between $ \left(k-1\right)L $ and $ M+\left(k-1\right)L-1 $, $ w\left(m\right) $ is the window function, M is the segment size, and L is the number of information points between segments, $ v=i $/M, where $ -\left(\frac{M}{2}-1\right) < i < \frac{M}{2} $. (2) Calculate the modified periodic chart value using the formula: $ {P}_{k}\left(v\right)=1/wabs{\left({S}_{k}\left(v\right)\right)}^{2} $ where, $ w={\sum }_{m=0}^{M}{w}^{2}\left[m\right] $. (3) Estimate the power spectral density by using the average of the periodic plot values calculated using the equation: $ {L}_{s}\left(v\right)=1/K\sum _{k=1}^{K}{P}_{k}\left(v\right) $ where, the number of points shared by two adjacent signal segments is equal to (M-L), which means that the two adjacent segments will be overlapped by (M-L) points. |
PSD represents the energy distribution of EEG signals in different frequency bands, and identifies emotional states through the difference of energy distribution. |
| DE | It is a generalization of Shannon's information entropy $ -{\sum }_{x}p\left(x\right)\mathit{log}\left(p\left(x\right)\right) $ on continuous variables. | $ DE=-{\int }_{a}^{b}p\left(x\right)\mathit{log}\left(p\left(x\right)\right)dx={\int }_{a}^{b}\frac{1}{\sqrt{2\pi {\sigma }_{i}^{2}}}{e}^{-\frac{{\left(x-\mu \right)}^{2}}{2{\sigma }_{i}^{2}}}\mathit{log}(1√2πσ2ie−(x−μ)22σ2i) dx=\frac{1}{2}\mathit{log}\left(2\pi e{\sigma }_{i}^{2}\right) $ Here $ p\left(x\right) $ represents the probability density function of continuous information, and [a, b] represents the interval of information values, which is equal to the logarithm of its energy spectrum in a specific frequency band. |
DE represents the complexity and irregularity of EEG signals in the frequency domain and captures the dynamic changes. |
DownLoad:
CSV
Due to the characteristics of both time and frequency domains, the time-frequency domain can comprehensively reflect the information of the EEG, which is a more comprehensive display of EEG feature information. After transforming the EEG into the time-frequency domain through the wavelet transform (WT), the wavelet shannon entropy (SE) is extracted as the feature, which provides uncertainty, information content, spectral characteristics, and time-frequency variation characteristics of the EEG, and reveals the correlation between the EEG signal and emotion so as to realize emotion recognition. The SE of the time-frequency domain can describe the information content and complexity of the signal at different times and frequencies, as shown in Eq (1):
| $ H\left(X\right) = -\sum _{x}P\left(x\right){\mathit{log}}_{2}\left[P\left(x\right)\right] $ | (1) |
Here, H(X) is the SE, and $ P\left(x\right) $ is the probability value of different sample data, in bits.
SSA is used to obtain the optimal NDT and MNL of the RF dynamically, and the SSA is inspired by the foraging behavior of sparrows to obtain the optimal parameters.
According to the biological rules of the SSA, the discoverer first finds the optimal foraging area. Followers search for food in the area around the discoverers or obtain food from them. They may also engage in food plundering between individuals and update their foraging area. When the sparrows are aware of danger, they also update their foraging area to avoid being attacked by predators. Assuming there are n sparrows in d-dimensional space, X represents the position of the sparrow. The main responsibility of discoverers is to find food for the population and guide their followers in the foraging direction. According to this rule, the location of the discoverer is updated as described in Eq (2):
|
$ {X}_{i, j}^{t+1} = \left\{Xti,j⋅exp(−iα⋅iter max) R2<STXti,j+Q⋅L R2≥ST \right. $
|
(2) |
Here, $ {i}_{termax} $ is the maximum number of iterations, t is the current number of iterations, $ {X}_{ij} $ is the position information of the sparrow i in the j dimension, $ {R}_{2} $ and $ {S}_{T} $ are the warning and safety values respectively, Q and $ \alpha (\alpha \in \left(\left.0, 1\right])\right. $ are the random numbers, Q follows a normal distribution, and L is a matrix with all elements being $ 1\times d $. When $ {R}_{2} < {S}_{T} $, there are no predators in the foraging environment, and the discoverer can conduct a safe and extensive search. When $ {R}_{2}\ge {S}_{T} $, some sparrows confirm the presence of predators and issue an alert, and all the sparrows need to move to the feeding area in a timely manner.
The position update of followers is described in Eq (3):
|
$ {X}_{i, j}^{t+1} = \left\{Q⋅exp(xtworst−Xti,ji2) i>n/2Xt+1P+|Xti,j−Xt+1P|⋅A+⋅L other \right. $
|
(3) |
Here, $ {X}_{P}^{} $ is the optimal position occupied by the current discoverer, and $ {X}_{worst} $ is the current global worst position, A is a matrix of $ 1\times d $, with elements randomly assigned to 1 or -1, and $ {A}^{+} = {A}^{T}{\left(A{A}^{T}\right)}^{-1} $. When $ i > n/2 $, The follower i is in a state of hunger, whose fitness is reduced, and in order to find food, it needs to change areas for foraging.
When aware of danger, the sparrow population will engage in anti-predatory behavior, as described in Eq (4):
|
$ {X}_{i, j}^{t+1} = \left\{Xtbest+β⋅|Xti,j−Xtbest| fi>fgXti,j+K⋅(|Xti,j−Xtworst|(fi−fw)+ϵ) fi=fg \right. $
|
(4) |
Here $ {f}_{i} $ is the fitness value of the current sparrow individual, $ {f}_{g} $ and $ {f}_{w} $ are the current global best and worst fitness, $ {X}_{best}^{} $ is the current global optimal position, $ \beta $ represents the wavelength control parameter, which is a random number subject to a standard normal distribution (mean 0, variance 1), $ K(K\in \left[-\mathrm{1, 1}\right]) $ is a random number representing the direction of sparrow movement, and $ \epsilon $ is the smallest constant to avoid a denominator of 0.
When $ {\mathrm{f}}_{\mathrm{i}} > {\mathrm{f}}_{\mathrm{g}} $, sparrows are in a hazardous area and can be easily spotted or attacked by natural predators.
When $ {\mathrm{f}}_{\mathrm{i}} = {\mathrm{f}}_{\mathrm{g}} $, sparrows realize that they are currently in a dangerous position, and in order to avoid being attacked by predators, they need to move closer to the sparrows in the safe area to reduce the likelihood of predation. The implementation of SSA-RF is shown in Table 3.
| Algorithm: SSA-RF |
| Input: D: EEG Data |
| G: Number of iterations |
| P: Number of population |
| F0: Global optimal fitness value |
| F: Current fitness value |
| Output: Optimal DTN and LMN of RF |
| 1: Initialize the RF model and substitute D into it |
| 2: Determine the initial location of sparrow population |
| 3: while i < G do |
| 4: for m = 1 to P do |
| 5: Use the fitness function to determine the global fitness value |
| 6: Update population position based on fitness ranking order |
| 7: if F < F0 then |
| 8: Update the global optimal position |
| 9: end if |
| 10: end for |
| 11: Select the global optimal position |
| 12: end while |
| 13: Extract the two dimensional data of the global optimal position (DTN and LMN) and substitute it into the RF model to output the results |
DownLoad:
CSV
In SSA-RF, the fitness function is used to search for the optimal number of DTN and LMN. The classification error of the training and testing sets is used as the fitness. After the model training is completed, the optimal position of the sparrow population is output, corresponding to the optimal number of DTN and LMN in the RF, Finally, the optimization results were incorporated into the RF for experimentation, which summarized the complete process of SSA-RF optimization parameters. The flowchart of SSA-RF algorithm is shown in Figure 2.

The DEAP dataset was established by Koelstra et al. [26] from Queen Mary's College London, which included multi-channel physiological signals, facial expression videos, and emotional self-evaluation labels established using the SAM (Self Assessment Manikins) table. It collected EEG data from 32 healthy subjects (16 males and 16 females), with the first 32 channels of EEG.
The SEED dataset was established by the BCMI laboratory, which recorded the EEG of 15 subjects (including 7 males and 8 females), with an average age of 23.37 years old. Each group had 15 experiments, each consisting of 5 seconds of suggestion before the start, 4 minutes of movie clips, 45 s of self-evaluation, and 15 s of rest. The emotion-inducing materials consist of 15 segments from six movies. After watching the videos, participants recorded their emotional reactions by filling out questionnaires, which were divided into three types: positive emotions, neutral emotions, and negative emotions.
The data formats of the two datasets were shown in Table 4.
| Dataset | Data format | Caption |
| DEAP | 40 × 32 × 7680 | 40: video 32: channel 7680: data |
| SEED | 15 × 3 × 62 × M | 15: video 3: number of experiments 62: channel M: data |
DownLoad:
CSV
The parameters of SSA-RF were population number, maximum number of iterations, dimension, upper boundary, and lower boundary. These parameter values are shown in Table 5.
| Parameter | Value |
| Population number | 8 |
| Maximum number of iterations | 20 |
| Dimension | 2 |
| lower boundary | 1 |
| Upper boundary | 50 |
DownLoad:
CSV
For the DEAP dataset, it was composed of participants collecting EEG signals while being emotionally induced, then the participants labeled the label size by watching video through their personal subjective emotions.
The baseline signal mean was removed during baseline processing [27]. The pre-processed data were augmented by windowing. There were 40 sets of data from 40 emotion-inducing videos of each subject, each of which lasted 60 s. These data were processed with a windowing of 10 s and a 50% overlap rate, each video was reconstructed into 440 video data of 10 s. Each video sample had a duration of 10 s, a data sampling rate of 128 Hz, and 32 unaltered channels. Therefore, the amount of data per sample for a single channel was 1280. The original data was reconstructed from 40 × 32 × 7680 to 40 × 32 × 14,080.
For the SEED dataset, it was based on the premise of determining the label to which the emotion-evoking material belongs. In the stage of preprocessing, all data of each subject was integrated and reconstructed, and the original data format of 15 × 3 × 62 × M was reconstructed into a format of 225 × 186 × M. The dataset had a total of 15 subjects, and each subject had 15 segments of emotional stimulation materials. All emotional stimulation material data was unified into 15 × 15, so the first dimension was 225, Each subject was separated for a period of time to perform the same experiment 3 times, each experiment collected 62 channels of EEG signals, and the second dimension was 3 × 62, which was 186, M was the amount of data in a single channel of each trial, because each test was not the same time duration, so M was in the range of 37,001–53,001. The original data was reconstructed from 15 × 3 × 62 × M to 225 × 186 × M.
We conducted 15 randomized grouping experiments. The 25 subjects were randomly selected as the training set, and the other 7 people were selected as the test set for 30 experiments, and 20 iterations were carried out in each experiment.
A total of 20 features were extracted: ZCR, SD, Mean, RMS, Eng, Skew, ApEn, SampEn, Hjorh, PSD, and DE of five frequency bands ($ \mathrm{\delta } $, $ \mathrm{\theta } $, $ \mathrm{\alpha } $, $ \mathrm{\beta } $, and $ \mathrm{\gamma } $), and SE in the time-frequency domain. We performed many experiments of different feature combinations, and selected the top 8 combinations with high accuracy. There are shown as follows:
Combination 1: All features of the composite domain (20 features);
Combination 2: ZCR, SD, Mean, RMS, Eng, Skewness, ApEn, SampEn, PSD, DE, SE;
Combination 3: SD, RMS, Eng, PSD-δ, DE-δ, DE-β, DE-γ;
Combination 4: F-all, SE, and Hjorth;
Combination 5: Mean, SampEn, DE-β, DE-γ, PSD-β, PSD-γ, SE;
Combination 6: SD, Mean, RMS, Eng, Skewness, Apen, SampEn, DE-α, DE-β, DE-γ, PSD-α, PSD-β, and PSD-γ;
Combination 7: ZCR, SD, Mean, RMS, Eng, Skewness, ApEn, SampEn, DE-α, DE-β, DE-γ, PSD-α, PSD-β and PSD-γ;
Combination 8: SD, Mean, RMS, Eng, and F-α, β, γ;
The value of parameters of RF were generally based on empirical data, and the empirical values of DTN and MLN were 30 and 1, respectively, but they were not suitable for each type of data. We applied SSA algorithm to automatically search for optimal parameters (DTN and MLN) of RF for the 8 combinations, and the optimal values of DTN and MLN are shown in Table 6.
 |
1 | 2 | 3 | 4 | 5 | 6 | 7 | 8 |
| DTN | 34 | 50 | 49 | 37 | 29 | 24 | 24 | 27 |
| MLN | 1 | 1 | 1 | 2 | 2 | 1 | 3 | 1 |
DownLoad:
CSV
It can be seen from Table 6 that the optimal parameter values of different feature combinations were different, and they were different from the empirical values, DTN especially showed significant differences. To test which feature combination can achieve the highest accuracy, we experimental with 100 epochs for each feature combination based on the DEAP dataset.
Figure 3 shows the violin plots of the accuracy for different combinations. The median accuracy of combination 3 was higher than the others, and the median accuracy of combination 8 was the lowest. On the whole, the accuracy of each combination was in the range of 72–81%.

The experimental results of SSA-RF on the DEAP dataset showed the accuracy of the test set was improved compared with RF. The classification results and improvement amount are shown in Figure 4 and Table 7.

 |
1 | 2 | 3 | 4 | 5 | 6 | 7 | 8 |
| SSA-RF | 76.70 | 77.27 | 77.57 | 76.80 | 77.40 | 76.52 | 76.40 | 75.83 |
| RF | 73.05 | 76.88 | 74.55 | 75.03 | 76.59 | 76.19 | 73.86 | 75.39 |
| Difference | 3.65↑ | 0.39↑ | 3.02↑ | 1.77↑ | 0.81↑ | 0.33↑ | 2.54↑ | 0.44↑ |
| Average | 1.62↑ | |||||||
DownLoad:
CSV
From Table 7 and Figure 4, it could be seen that the accuracy of SSA-RF was higher than RF on each feature combination, with an average improvement of 1.62%. Among them, combination 1 had the highest improvement, which was 3.65%, while combination 3 had the highest accuracy with a growth of 3.02%. Combination 3 was selected as the optimal feature combination.
Then, we analyzed the misjudged subjects based on combination 3. Subject 15 was used for analysis that misjudged negative emotions as positive emotions. We compared the features of combination 3 (SD, RMS, Eng, PSD-δ, DE-δ, DE-β, DE-γ) with the mean of the same features in the training set, as shown in Figure 5.

From Figure 5, it could be seen that the SD and RMS of subject 15 showed significant differences from the mean of the same features of the training set. When SDmean = 11.75 and SD15 = 87.27, ΔSD ≈ 75.52. When RMSmean = 16.13 and RMS15 = 79.8, ΔRMS ≈ 63.69. Other feature values of subject 15 were also higher than the mean of the same features of training set. This indicated that subject 15 exhibited significant individual differences in the dataset, and was the reason why it was misjudged. The subject of individual differences should be included in the training set for training SSA-RF to obtain the better generalization ability.
We conducted 15 randomized grouping experiments, 12 subjects were randomly selected as the training set, the other 3 people were selected as the test set for 30 experiments, and 20 iterations were carried out in each experiment.
A total of 18 features were extracted: ZCR, SD, Mean, RMS, Eng, Skewness, Hjorth, PSD and DE of five frequency bands ($ \mathrm{\delta } $, $ \mathrm{\theta } $, $ \mathrm{\alpha } $, $ \mathrm{\beta } $, and $ \mathrm{\gamma } $), and SE in the time-frequency domain. We performed many experiments of different feature combinations, and selected the top 8 combinations with high accuracy. These are shown as follows:
Combination 1: All time domain features;
Combination 2: All;
Combination 3: RMS, Eng, PSD-δ, DE-δ, DE-β, DE-γ;
Combination 4: DE-β, DE-α, PSD-β, PSD-α;
Combination 5: Eng, Skewness, Hjorth, PSD;
Combination 6: T-all and F-all;
Combination 7: DE-θ, DE-δ, PSD-θ, PSD-δ;
Combination 8: T-all and PSD;
The parameters value of RF were generally based on empirical evidence, and the empirical values of DTN and MLN were 30 and 1, respectively, but they were not suitable for each type of data. We applied SSA to automatically search for optimal parameters (DTN and MLN) of RF of the 8 combinations, and the optimal values of DTN and MLN were shown in Table 8.
 |
1 | 2 | 3 | 4 | 5 | 6 | 7 | 8 |
| DTN | 33 | 35 | 32 | 50 | 34 | 28 | 34 | 43 |
| MLN | 10 | 9 | 4 | 4 | 1 | 4 | 16 | 13 |
DownLoad:
CSV
Since multiple experiments were performed for each feature combination of the SEED dataset, the results of each experiment were recorded and statistically analyzed to draw a violin plot as shown in Figure 6.

It can be seen from the violin plot the accuracy corresponding to the feature combinations of the SEED dataset. The accuracy of the combination 1 was significantly higher than that of the other 7 combinations, and the accuracy of each combination was in the range of 65–93%, whose numerical span was larger than the DEAP dataset.
The experimental results of SSA-RF in the SEED dataset indicated that the accuracy of training set was close to 100%. The accuracy and improvement of the three classifications in the test set are shown in Figure 7 and Table 9.

 |
1 | 2 | 3 | 4 | 5 | 6 | 7 | 8 |
| SSA-RF | 82.58 | 72.89 | 79.73 | 75.38 | 75.20 | 73.11 | 74.84 | 73.96 |
| RF | 73.33 | 62.22 | 66.67 | 64.44 | 68.89 | 68.89 | 64.44 | 60.00 |
| Difference | 9.25↑ | 10.67↑ | 13.06↑ | 10.94↑ | 6.31↑ | 4.22↑ | 10.40↑ | 13.96↑ |
| Average | 9.85↑ | |||||||
DownLoad:
CSV
From Figure 7 and Table 9, it can be concluded that SSA-RF had a better optimization effect on the SEED dataset than the DEAP dataset. It can be seen that the accuracy of SSA-RF was higher than RF on each feature combination, with an average improvement of 9.85%. Among them, the accuracy of all time-domain feature combinations was 82.58%, with an improvement of 9.25%.
For the misjudgment analysis of the discrimination results of combination 1 (All time domain features) in the SEED dataset, we extracted the feature data of combination 1 for subject 1 when misjudging (misjudging positive emotions as negative emotions), and compared it with the mean of those in the training set, as shown in Figure 8.

From Figure 8, it can be seen that the ZCR and SD of subject 1 shows significant differences compared with the mean of those in the training set.
When ZCRmean = 6930.1, ZCR1 = 218,213.6, which was almost a thirty-fold difference. Meanwhile, when SDmean = 2880.4, SD1 = 206,475.2, and the other feature values of subject 1 were also higher than the mean of those in the training set. Therefore it could be seen that subject1 exhibited significant individual differences in this dataset. For this reason, its accuracy was lower. Subsequent work needs to include subject 1 in the training set to train SSA-RF to obtain better generalization ability.
In the course of our research, we compared with particle swarm optimization algorithm (PSO), whale algorithm (WOA), and genetic algorithm (GA) with SSA algorithm, applied to the DEAP dataset. The experimental results are shown in Table 10.
 |
1 | 2 | 3 | 4 | 5 | 6 | 7 | 8 |
| PSO-RF | 75.23 | 77.50 | 77.50 | 73.18 | 59.55 | 70.23 | 63.41 | 64.32 |
| WOA-RF | 71.36 | 54.09 | 73.18 | 69.77 | 65.68 | 59.55 | 69.55 | 61.36 |
| GA-RF | 62.73 | 72.50 | 74.55 | 74.09 | 63.41 | 74.55 | 62.05 | 68.40 |
| SSA-RF | 76.70 | 77.27 | 77.57 | 76.80 | 77.40 | 76.52 | 76.40 | 75.83 |
| RF | 73.05 | 76.88 | 74.55 | 75.03 | 76.59 | 76.19 | 73.86 | 75.39 |
DownLoad:
CSV
To sum up, SSA has the best effect compared to similar algorithms.
We compared the findings of this paper with previous research, the average accuracy was based on 100 epochs, and the results of the comparison are shown in Table 11.
| Dataset | References (Year) | Model | Average Acc (%) |
| DEAP | Arnau-Gonzalez et al. [28] (2017) | SVM | 73.41 |
| Li et al. [29] (2018) | SVM | 59.06 | |
| Pandey et al. [30] (2019) | Deep Neural Network | 62.50 | |
| Cimtay et al. [31] (2020) | CNN | 72.81 | |
| Mert Ahmet et al. [32] (2021) | ANN | 70.02 | |
| Xu et al. [33] (2022) | GRU-Conv | 70.07 | |
| She et al. [34] (2023) | DDSA-mRMR-SRM | 64.40 | |
| Ours | SSA-RF | 76.81 | |
| SEED | Lan et al. [35] (2018) | MIDA | 72.47 |
| Gupta et al. [36] (2019) | Random forest classification model | 72.07 | |
| Luo et al. [37] (2020) | sWGAN + SVM | 67.7 | |
| Topic et al. [38] (2021) | TOPO-FM and HOLO-FM | 73.11 | |
| Emsawas et al. [39] (2022) | MultiT-S ConvNet | 54.60 | |
| Zhang et al. [40] (2023) | Semi-supervised emotion recognition model | 73.26 | |
| Ours | SSA-RF | 75.96 |
DownLoad:
CSV
We compared SSA-RF and the relevant references from the past 7 years in Table 11. The average accuracy of our method was 76.81%, which was higher than the others the on the DEAP dataset, The average accuracy of our method was 75.96%, which was higher than the others on the SEED dataset. SSA-RF improved the accuracy of cross-subject emotion recognition.
At present, there has been no research on SSA optimizing RFs in the field of emotion recognition based on EEG. This research demonstrated that SSA-RF can obtain better accuracy in cross-subject emotion recognition. After extracting the composite domain features of EEG signals, we conducted a variety of feature combination experiments. Through this method, we found the optimal parameters of RF, and the accuracy was significantly improved. For the DEAP dataset, the average accuracy was 76.81%, with a maximum accuracy of 77.57%, which was 1.61% higher than RF. For the SEED dataset, the average accuracy was 75.96%, with a maximum accuracy of 82.58%, which was 9.85% higher than RF.
The SSA-RF algorithm proposed in our research is applicable to the classification training of personal emotion models, solving the inefficiency problems of high time cost and low adaptability of setting model parameters manually. SSA-RF can be applied in practice, and it has certain theoretical and practical significance for the development of emotion recognition.
Factors affecting the accuracy or efficiency of cross-subject emotion recognition also include baseline processing methods and automatic optimization of feature combinations. Therefore, multi-baseline processing and automatic optimization of feature selection have important research significance.
Conceptualization and methodology, X.Z.; software, S.W. and X.Z.; formal analysis, X.Z. and S.W.; investigation, X.Z. and Y.S.; data curation, K.X.; writing-original draft preparation, X.Z., S.W.; writing-review and editing, X.Z. and K.X.; funding acquisition, X.Z. and R.Z. All authors have read and agreed to the published version of the manuscript.
The authors declare they have not used Artificial Intelligence (AI) tools in the creation of this article.
This research was funded by National Natural Science Foundation of China, grant number 81901827, Natural Science Basic Research Program of Shaanxi province, grant number 2022JM-146, 2024 Graduate Innovation Fund of Xi'an Polytechnic University.
The data used in this research are DEAP and SEED dataset which are the public datasets.
http://www.eecs.qmul.ac.uk/mmv/datasets/deap/; https://bcmi.sjtu.edu.cn/~seed/index.html.
The authors declare no competing interests.
| [1] |
Crabtree GW, Dresselhaus MS, Buchanan MV (2004) The Hydrogen Economy. Phys Today 57: 39-44. doi: 10.1063/1.1878333

|
| [2] | Zuttel A, Borgschulte A, Schlapbach L (2008) Hydrogen as a Future Energy Carrier. Winheim: Wiley-VCH Verlag GmbH & Co. |
| [3] | Riis T, Hagen EF, Vie PJS, et al. (2006) Hydrogen Production R&D. Paris: IEA. |
| [4] |
Turner JA (2004) Sustainable Hydrogen Production. Science 305: 972-974. doi: 10.1126/science.1103197
|
| [5] |
Merle G, Wessling M, Nijmeijer K (2011) Anion exchange membranes for alkaline fuel cells: A review. J Membrane Sci 377: 1-35. doi: 10.1016/j.memsci.2011.04.043
|
| [6] |
Giddey S, Badwal SPS, Kulkarni A, et al. (2012) A comprehensive review of direct carbon fuel cell technology. Prog Energy Combust 38: 360-399. doi: 10.1016/j.pecs.2012.01.003
|
| [7] |
Antolini E, Perez J (2011) The use of rare earth-based materials in low-temperature fuel cells. Int J Hydrogen Energy 36: 15752-15765. doi: 10.1016/j.ijhydene.2011.08.104
|
| [8] |
Stambouli AB, Traversa E (2002) Solid oxide fuel cells (SOFCs): a review of an environmentally clean and efficient source of energy. Renew Sust Energy Rev 6: 433-455. doi: 10.1016/S1364-0321(02)00014-X
|
| [9] | Riis T, Sandrock G, Ulleberg O, et al. (2006) Hydrogen Storage R&D. Paris: IEA. |
| [10] |
Elam CC, Padró CEG, Sandrock G, et al. (2003) Realizing the hydrogen future: the International Energy Agency's efforts to advance hydrogen energy technologies. Int J Hydrogen Energy 28: 601-607. doi: 10.1016/S0360-3199(02)00147-7
|
| [11] | MHCoE For a description of the Metal Hydride Center of Excellence. Available from: http://www.sandia.gov/MHCoE. |
| [12] | CHCoE For a description of the Chemical Hydride Center of Excellence. Available from: http://www.hydrogen.energy.gov/annual_progress10_storage.html. |
| [13] | HSCoE For a description of the Hydrogen Sorption Center of Excellence. Available from: http://www.nrel.gov/basic_sciences/carbon_based_hydrogen_center.cfm#hsce. |
| [14] | Klebanoff L (2013) Hydrogen Storage Technology: Materials and Applications. United States of America: CRC press. |
| [15] | US-DOE (2010) Hydrogen and Fuel Cells: Current Technology of Hydrogen Storage. Available from: http://www1.eere.energy.gov/hydrogenandfuelcells/storage/current_technology.html. |
| [16] |
Felderhoff M, Weidenthaler C, von Helmolt R, et al. (2007) Hydrogen storage: the remaining scientific and technological challenges. Phys Chem Chem Phys 9: 2643-2653. doi: 10.1039/b701563c
|
| [17] |
Graetz J (2009) New approaches to hydrogen storage. Chem Soc Rev 38: 73-82. doi: 10.1039/B718842K
|
| [18] | van den Berg AWC, Arean CO (2008) Materials for hydrogen storage: current research trends and perspectives. Chem Commun 14: 668-681. |
| [19] | Klebanoff LE, Keller JO (2013) 5 Years of hydrogen storage research in the U.S. DOE Metal Hydride Center of Excellence (MHCoE). Int J Hydrogen Energ 38: 4533-4576. |
| [20] | Lu Z-H, Xu Q (2012) Recent Progress in Boron and Nitrogen based Chemical Hydrogen Storage. Functional Materials Letters 05. |
| [21] |
Michel KJ, Ozoliņš V (2013) Recent advances in the theory of hydrogen storage in complex metal hydrides. MRS Bulletin 38: 462-472. doi: 10.1557/mrs.2013.130
|
| [22] | Varin RA, Czujiko T, Wronski ZS (2009) Nanomaterials for solid state hydrogen storage. Cleveland: Springer. |
| [23] |
Grochala W, Edwards PP (2004) Thermal Decomposition of the Non-Interstitial Hydrides for the Storage and Production of Hydrogen. Chem Rev 104: 1283-1316. doi: 10.1021/cr030691s
|
| [24] |
Eremets MI, Trojan IA, Medvedev SA, et al. (2008) Superconductivity in Hydrogen Dominant Materials: Silane. Science 319: 1506-1509. doi: 10.1126/science.1153282
|
| [25] |
Scheler T, Degtyareva O, Marqués M, et al. (2011) Synthesis and properties of platinum hydride. Phys Rev B 83: 214106. doi: 10.1103/PhysRevB.83.214106
|
| [26] | Gao G, Wang H, Zhu L, et al. (2011) Pressure-Induced Formation of Noble Metal Hydrides. J Phys Chem C 116: 1995-2000. |
| [27] |
Driessen A, Sanger P, Hemmes H, et al. (1990) Metal hydride formation at pressures up to 1 Mbar. J Physics: Condensed Matter 2: 9797. doi: 10.1088/0953-8984/2/49/007
|
| [28] | Sandrock G (1999) A panoramic overview of hydrogen storage alloys from a gas reaction point of view. J Alloys Compounds 293-295: 877-888. |
| [29] | Bogdanovi B, Schwickardi M (1997) Ti-doped alkali metal aluminium hydrides as potential novel reversible hydrogen storage materials. J Alloy Compd 253-254: 1-9. |
| [30] |
Bogdanović B, Brand RA, Marjanović A, et al. (2000) Metal-doped sodium aluminium hydrides as potential new hydrogen storage materials. J Alloy Compd 302: 36-58. doi: 10.1016/S0925-8388(99)00663-5
|
| [31] |
Eberle U, Arnold G, von Helmolt R (2006) Hydrogen storage in metal-hydrogen systems and their derivatives. J Power Sources 154: 456-460. doi: 10.1016/j.jpowsour.2005.10.050
|
| [32] |
Sandrock G, Gross K, Thomas G (2002) Effect of Ti-catalyst content on the reversible hydrogen storage properties of the sodium alanates. J Alloy Compd 339: 299-308. doi: 10.1016/S0925-8388(01)02014-X
|
| [33] |
Zaluska A, Zaluski L, Ström-Olsen JO (2000) Sodium alanates for reversible hydrogen storage. J Allos Compd 298: 125-134. doi: 10.1016/S0925-8388(99)00666-0
|
| [34] | Gross KJ, Sandrock G, Thomas GJ (2002) Dynamic in situ X-ray diffraction of catalyzed alanates. J Alloy Compd 330-332: 691-695. |
| [35] | Bellosta von Colbe JM, Felderhoff M, Bogdanovic B, et al. (2005) One-step direct synthesis of a Ti-doped sodium alanate hydrogen storage material. Chem Commun 4732-4734. |
| [36] |
Li L, Xu C, Chen C, et al. (2013) Sodium alanate system for efficient hydrogen storage. Int J Hydrogen Energy 38: 8798-8812. doi: 10.1016/j.ijhydene.2013.04.109
|
| [37] | NIST. Availabe from: http://webbook.nist.gov ed. |
| [38] | Zaluska A, Zaluski L, Srom-Olsen JO, et al. (1999) Method for inducing hydrogen desorption from a metal hydride. In: 5882623, Patent. United States of America. |
| [39] |
Zaluska A, Zaluski L, Strm-Olsen JO (1999) Nanocrystalline magnesium for hydrogen storage. J Alloy Compd 288: 217-225. doi: 10.1016/S0925-8388(99)00073-0
|
| [40] |
Varin RA, Czujko T, Wronski ZS, et al. (2009) Nanomaterials for hydrogen storage produced by ball milling. Can Metall Quart 48: 11-26. doi: 10.1179/cmq.2009.48.1.11
|
| [41] |
Fichtner M (2009) Properties of nanoscale metal hydrides. Nanotechnology 20: 204009. doi: 10.1088/0957-4484/20/20/204009
|
| [42] |
Bérubé V, Radtke G, Dresselhaus M, et al. (2007) Size effects on the hydrogen storage properties of nanostructured metal hydrides: A review. Int J Energy Res 31: 637-663. doi: 10.1002/er.1284
|
| [43] |
Chen PX, Z.; Luo, J.; Lin, J.; Tan, K. L. (2002) Interaction of hydrogen with metal nitrides and imides. Nature 420: 302-304. doi: 10.1038/nature01210
|
| [44] |
Hu YH, Ruckenstein E (2003) Ultrafast Reaction between LiH and NH3 during H2 Storage in Li3N. J Phys Chem A 107: 9737-9739. doi: 10.1021/jp036257b
|
| [45] |
Ichikawa T, Hanada N, Isobe S, et al. (2004) Mechanism of Novel Reaction from LiNH2 and LiH to Li2NH and H2 as a Promising Hydrogen Storage System. J Phys Chem B 108: 7887-7892. doi: 10.1021/jp049968y
|
| [46] | Lohstroh W, Fichtner M (2007) Reaction steps in the Li-Mg-N-H hydrogen storage system. J Alloy Compd 446-447: 332-335. |
| [47] |
Hu YH, Ruckenstein E (2004) Highly Effective Li2O/Li3N with Ultrafast Kinetics for H2 Storage. Ind Eng Chem Res 43: 2464-2467. doi: 10.1021/ie049947q
|
| [48] |
Zuttel A, Wenger P, Rentsch S, et al. (2003) LiBH4 a new hydrogen storage material. J Power Sources 118: 1-7. doi: 10.1016/S0378-7753(03)00054-5
|
| [49] | Mosegaard L, Moller B, Jorgensen J-E, et al. (2008) Reactivity of LiBH4: In Situ Synchrotron Radiation Powder X-ray Diffraction Study. J Phys Chem C 112: 1299-1303. |
| [50] |
Yu XB, Grant DM, Walker GS (2009) Dehydrogenation of LiBH4 Destabilized with Various Oxides. J Phys Chem C 113: 17945-17949. doi: 10.1021/jp906519p
|
| [51] |
Maekawa H, Matsuo M, Takamura H, et al. (2009) Halide-Stabilized LiBH4, a Room-Temperature Lithium Fast-Ion Conductor. J Am Chem Soc 131: 894-895. doi: 10.1021/ja807392k
|
| [52] |
Luo C, Wang H, Sun T, et al. (2012) Enhanced dehydrogenation properties of LiBH4 compositing with hydrogenated magnesium-rare earth compounds. Int J Hydrogen Energy 37: 13446-13451. doi: 10.1016/j.ijhydene.2012.06.114
|
| [53] | Pendolino F (2011) “Boron Effect” on the Thermal Decomposition of Light Metal Borohydrides MBH4 (M = Li, Na, Ca). J Phys Chem C 116: 1390-1394. |
| [54] |
Pendolino F (2013) Thermal study on decomposition of LiBH4 at non-isothermal and non-equilibrium conditions. J Thermal Analysis Calorimetry 112: 1207-1211. doi: 10.1007/s10973-012-2662-2
|
| [55] |
Gross AF, Vajo JJ, Van Atta SL, et al. (2008) Enhanced Hydrogen Storage Kinetics of LiBH4 in Nanoporous Carbon Scaffolds. J Phys Chem C 112: 5651-5657. doi: 10.1021/jp711066t
|
| [56] | Xu J, Yu X, Ni J, et al. (2009) Enhanced catalytic dehydrogenation of LiBH4 by carbon-supported Pd nanoparticles. Dalton Transactions: 8386-8391. |
| [57] | Xu J, Yu X, Zou Z, et al. (2008) Enhanced dehydrogenation of LiBH4 catalyzed by carbon-supported Pt nanoparticles. Chem Commun 5740-5742. |
| [58] | Xu J, Qi Z, Cao J, et al. (2013) Reversible hydrogen desorption from LiBH4 catalyzed by graphene supported Pt nanoparticles. Dalton Transactions 42: 12926-12933 |
| [59] |
Luo W (2004) (LiNH2-MgH2): a viable hydrogen storage system. J Alloy Compd 381: 284-287. doi: 10.1016/j.jallcom.2004.03.119
|
| [60] |
Xiong Z, Wu G, Hu J, et al. (2004) Ternary Imides for Hydrogen Storage. Adv Mater 16: 1522-1525. doi: 10.1002/adma.200400571
|
| [61] |
Leng HY, Ichikawa T, Hino S, et al. (2004) New Metal-N-H System Composed of Mg(NH2)2 and LiH for Hydrogen Storage. J Phy Chem B 108: 8763-8765. doi: 10.1021/jp048002j
|
| [62] |
Nakamori Y, Kitahara G, Orimo S (2004) Synthesis and dehydriding studies of Mg-N-H systems. J Power Sources 138: 309-312. doi: 10.1016/j.jpowsour.2004.06.026
|
| [63] | Nakamori Y, Kitahara G, Miwa K, et al. (2005) Reversible hydrogen-storage functions for mixtures of Li3N and Mg3N2. Appl Phys A 80: 1-3. |
| [64] |
Dolci F, Weidner E, Hoelzel M, et al. (2010) In-situ neutron diffraction study of magnesium amide/lithium hydride stoichiometric mixtures with lithium hydride excess. Int J Hydrogen Energy 35: 5448-5453. doi: 10.1016/j.ijhydene.2010.03.030
|
| [65] |
Barison S, Agresti F, Lo Russo S, et al. (2008) A study of the LiNH2-MgH2 system for solid state hydrogen storage. J Alloy Compd 459: 343-347. doi: 10.1016/j.jallcom.2007.04.278
|
| [66] |
Shahi RR, Yadav TP, Shaz MA, et al. (2008) Effects of mechanical milling on desorption kinetics and phase transformation of LiNH2/MgH2 mixture. Int J Hydrogen Energy 33: 6188-6194. doi: 10.1016/j.ijhydene.2008.07.029
|
| [67] |
Liang C, Liu Y, Luo K, et al. (2010) Reaction Pathways Determined by Mechanical Milling Process for Dehydrogenation/Hydrogenation of the LiNH2/MgH2 System. Chemistry A European Journal 16: 693-702. doi: 10.1002/chem.200901967
|
| [68] |
Liu Y, Li B, Tu F, et al. (2011) Correlation between composition and hydrogen storage behaviors of the Li2NH-MgNH combination system. Dalton Transactions 40: 8179-8186. doi: 10.1039/c1dt10108k
|
| [69] |
Lu J, Choi YJ, Fang ZZ, et al. (2010) Effect of milling intensity on the formation of LiMgN from the dehydrogenation of LiNH2-MgH2 (1:1) mixture. J Power Sources 195: 1992-1997. doi: 10.1016/j.jpowsour.2009.10.032
|
| [70] | Pottmaier D, Dolci F, Orlova M, et al. (2011) Hydrogen release and structural transformations in LiNH2-MgH2 systems. J Alloy Compd 509, Supplement 2: S719-S723. |
| [71] |
Vajo JJ, Skeith SL, Mertens F (2005) Reversible Storage of Hydrogen in Destabilized LiBH4. J Phys Chem B 109: 3719-3722. doi: 10.1021/jp040769o
|
| [72] |
Bosenberg U, Doppiu S, Mosegaard L, et al. (2007) Hydrogen sorption properties of MgH2-LiBH4 composites. Acta Materialia 55: 3951-3958. doi: 10.1016/j.actamat.2007.03.010
|
| [73] | Bosenberg U, Ravnsbk DB, Hagemann H, et al. (2010) Pressure and Temperature Influence on the Desorption Pathway of the LiBH4-MgH2 Composite System. J Phys Chem C 114: 15212-15217. |
| [74] | Nakagawa T, Ichikawa T, Hanada N, et al. (2007) Thermal analysis on the Li-Mg-B-H systems. J Alloy Compd 446-447: 306-309. |
| [75] | Shim J-H, Lim J-H, Rather S-u, et al. (2009) Effect of Hydrogen Back Pressure on Dehydrogenation Behavior of LiBH4-Based Reactive Hydride Composites. J Phys Chem Lett 1: 59-63. |
| [76] |
Yang J, Sudik A, Wolverton C (2007) Destabilizing LiBH 4 with a Metal ( M ) Mg , Al , Ti , V , Cr , or Sc ) or Metal Hydride ( MH 2 ). J Phys Chem C 111: 19134-19140. doi: 10.1021/jp076434z
|
| [77] |
Pinkerton FE, Meyer MS, Meisner GP, et al. (2007) Phase Boundaries and Reversibility of LiBH 4 / MgH 2 Hydrogen Storage Material. J Phys Chem Lett C 111: 12881-12885. doi: 10.1021/jp0742867
|
| [78] |
Price TEC, Grant DM, Legrand V, et al. (2010) Enhanced kinetics for the LiBH4:MgH2 multi-component hydrogen storage system—The effects of stoichiometry and decomposition environment on cycling behaviour. Int J Hydrogen Energy 35: 4154-4161. doi: 10.1016/j.ijhydene.2010.02.082
|
| [79] |
Wan X, Markmaitree T, Osborn W, et al. (2008) Nanoengineering-Enabled Solid-State Hydrogen Uptake and Release in the LiBH4 Plus MgH2 System. J Phys Chem C 112: 18232-18243. doi: 10.1021/jp8033159
|
| [80] |
Price TEC, Grant DM, Telepeni I, et al. (2009) The decomposition pathways for LiBD4-MgD2 multicomponent systems investigated by in situ neutron diffraction. J Alloy Compd 472: 559-564. doi: 10.1016/j.jallcom.2008.05.030
|
| [81] |
Walker GS, Grant DM, Price TC, et al. (2009) High capacity multicomponent hydrogen storage materials: Investigation of the effect of stoichiometry and decomposition conditions on the cycling behaviour of LiBH4,ÄìMgH2. J Power Sources 194: 1128-1134. doi: 10.1016/j.jpowsour.2009.06.075
|
| [82] | Yu XB, Grant DM, Walker GS (2006) A new dehydrogenation mechanism for reversible multicomponent borohydride systems--The role of Li-Mg alloys. Chem commun (Cambridge, England) 1: 3906-3908. |
| [83] |
Dobbins T, NaraseGowda S, Butler LG (2012) Study of Morphological Changes in MgH2 Destabilized LiBH4 Systems Using Computed X-ray Microtomography. Materials 5: 1740-1751. doi: 10.3390/ma5101740
|
| [84] |
Barkhordarian G, Klassen T, Dornheim M, et al. (2007) Unexpected kinetic effect of MgB2 in reactive hydride composites containing complex borohydrides. J Alloy Compd 440: L18-L21. doi: 10.1016/j.jallcom.2006.09.048
|
| [85] | COSY-network Complex Solid State Reaction for Energy Efficient Hydrogen Storage. Available from: www.cosy-net.eu. |
| [86] |
Santos DMF, Sequeira CAC (2011) Sodium borohydride as a fuel for the future. Renew Sust Energy Rev 15: 3980-4001. doi: 10.1016/j.rser.2011.07.018
|
| [87] |
Dinsdale AT (1991) SGTE Data for Pure Elements. CALPHAD 15: 317-425. doi: 10.1016/0364-5916(91)90030-N
|
| [88] | Manchester FD (2000) Phase Diagrams of Binary Hydrogen Alloys. United State of America: ASM International. |
| [89] |
George L, Saxena SK (2010) Structural stability of metal hydrides, alanates and borohydrides of alkali and alkali- earth elements: A review. Int J Hydrogen Energy 35: 5454-5470. doi: 10.1016/j.ijhydene.2010.03.078
|
| [90] |
Pottmaier D, Pinatel ER, Vitillo JG, et al. (2011) Structure and Thermodynamic Properties of the NaMgH3 Perovskite: A Comprehensive Study. Chem Mater 23: 2317-2326. doi: 10.1021/cm103204p
|
| [91] |
Barrico M, Paulmbo M, Pinatel E, et al. (2010) Thermodynamic Database for Hydrogen Storage Materials. Adv Sci Tech 72: 213-218. doi: 10.4028/www.scientific.net/AST.72.213
|
| [92] | Stasinevich G, Egorenko A (1969) J Inorg Chem 13: 341-343. |
| [93] | Martelli P, Caputo R, Remhof A, et al. (2010) Stability and Decomposition of NaBH 4. The J Phys Chem C 114: 7173-7177. |
| [94] |
Urgnani J, Torres F, Palumbo M, et al. (2008) Hydrogen release from solid state NaBH4. Int J Hydrogen Energy 33: 3111-3115. doi: 10.1016/j.ijhydene.2008.03.031
|
| [95] |
Mao JF, Yu XB, Guo ZP, et al. (2009) Enhanced hydrogen storage performances of NaBH4-MgH2 system. J Alloy Compd 479: 619-623. doi: 10.1016/j.jallcom.2009.01.012
|
| [96] |
Humphries TD, Kalantzopoulos GN, Llamas-Jansa I, et al. (2013) Reversible Hydrogenation Studies of NaBH4 Milled with Ni-Containing Additives. J Phys Chem C 117: 6060-6065. doi: 10.1021/jp312105w
|
| [97] |
Pendolino F, Mauron P, Borgschulte A, et al. (2009) Effect of Boron on the Activation Energy of the Decomposition of LiBH4. J Phys Chem C 113: 17231-17234. doi: 10.1021/jp902384v
|
| [98] |
Caputo R, Garroni S, Olid D, et al. (2010) Can Na2[B12H12] be a decomposition product of NaBH4? Phys Chem Chem Phys 12: 15093-15100.99. Her J-H, Zhou W, Stavila V, et al. (2009) Role of Cation Size on the Structural Behavior of the Alkali-Metal Dodecahydro-closo-Dodecaborates. J Phys Chem Lett C 113: 11187-11189. doi: 10.1021/jp904980m
|
| [99] |
100. Friedrichs O, Remhof A, Hwang K-J, et al. (2010) Role of Li2B12H12 for the formation and decomposition of LiBH4. Chem Mater 22: 3265-3268. doi: 10.1021/cm100536a
|
| [100] |
101. Her JH, Yousufuddin M, Zhou W, et al. (2008) Crystal structure of Li2B12H12: a possible intermediate species in the decomposition of LiBH4. Inorg Chem 47: 9757-9759. doi: 10.1021/ic801345h
|
| [101] | 102. Hwang SJ, Bowman RC, Reiter JW, et al. (2008) NMR Confirmation for Formation of [B12H12]2- Complexes during Hydrogen Desorption from Metal Borohydrides. J Phys Chem C 112: 3164-3169. |
| [102] |
103. Minella CB, Pistidda C, Garroni S, et al. (2013) Ca(BH4)2 + MgH2: Desorption Reaction and Role of Mg on Its Reversibility. J Phys Chem C 117: 3846-3852. doi: 10.1021/jp312271s
|
| [103] |
104. Yan Y, Remhof A, Rentsch D, et al. (2013) Is Y2(B12H12)3 the main intermediate in the decomposition process of Y(BH4)3? Chem Commun 49: 5234-5236. doi: 10.1039/c3cc41184b
|
| [104] |
105. Mao J, Guo Z, Yu X, et al. (2013) Combined effects of hydrogen back-pressure and NbF5 addition on the dehydrogenation and rehydrogenation kinetics of the LiBH4-MgH2 composite system. Int J Hydrogen Energy 38: 3650-3660. doi: 10.1016/j.ijhydene.2012.12.106
|
| [105] |
106. Yan Y, Li H-W, Maekawa H, et al. (2011) Formation of Intermediate Compound Li2B12H12 during the Dehydrogenation Process of the LiBH4-MgH2 System. J Phys Chem C 115: 19419-19423. doi: 10.1021/jp205450c
|
| [106] |
107. Garroni S, Milanese C, Pottmaier D, et al. (2011) Experimental Evidence of Na2[B12H12] and Na Formation in the Desorption Pathway of the 2NaBH4 + MgH2 System. J Phys Chem C 115: 16664-16671. doi: 10.1021/jp202341j
|
| [107] |
108. Pottmaier D, Pistidda C, Groppo E, et al. (2011) Dehydrogenation reactions of 2NaBH4 + MgH2 system. Int J Hydrogen Energy 36: 7891-7896. doi: 10.1016/j.ijhydene.2011.01.059
|
| [108] |
109. Pistidda C, Garroni S, Minella CB, et al. (2010) Pressure Effect on the 2NaH + MgB2 Hydrogen Absorption Reaction. J Phys Chem C 114: 21816-21823. doi: 10.1021/jp107363q
|
| [109] |
110. Garroni S, Milanese C, Girella A, et al. (2010) Sorption properties of NaBH4/MH2 (M = Mg, Ti) powder systems. Int J Hydrogen Energy 35: 5434-5441. doi: 10.1016/j.ijhydene.2010.03.004
|
| [110] |
111. Shi L, Gi Y, Qian T, et al. (2004) Synthesis of ultrafine superconducting MgB2 by a convenient solid-state reaction route. Physica C 405: 271-274. doi: 10.1016/j.physc.2004.02.013
|
| [111] |
112. Varin RA, Chiu C, Wronski ZS (2008) Mechano-chemical activation synthesis (MCAS) of disordered Mg(BH4)2 using NaBH 4. J Alloy Compd 462: 201-208. doi: 10.1016/j.jallcom.2007.07.110
|
| [112] |
113. Varin Ra, Czujko T, Chiu C, et al. (2009) Synthesis of nanocomposite hydrides for solid-state hydrogen storage by controlled mechanical milling techniques. J Alloy Compd 483: 252-255. doi: 10.1016/j.jallcom.2008.07.207
|
| [113] |
114. Czujko T, Varin R, Wronski Z, et al. (2007) Synthesis and hydrogen desorption properties of nanocomposite magnesium hydride with sodium borohydride (MgH2+NaBH4). J Alloy Compd 427: 291-299. doi: 10.1016/j.jallcom.2006.03.020
|
| [114] | 115. Czujiko T, Varin R, Zaranski Z, et al. (2010) The dehydrogenation process of destabilized NaBH4-MgH2 solid state hydride composites. Arch Metall Mater 55: 539-552. |
| [115] |
116. Garroni S, Pistidda C, Brunelli M, et al. (2009) Hydrogen desorption mechanism of 2NaBH4+MgH2 composite prepared by high-energy ball milling. Scripta Materialia 60: 1129-1132. doi: 10.1016/j.scriptamat.2009.02.059
|
| [116] |
117. Caputo R, Garroni S, Olid D, et al. (2010) Can Na2[B12H12] be a decomposition product of NaBH4? Phys Chem Chem Phys 12: 15093-15100. doi: 10.1039/c0cp00877j
|
| [117] |
118. Garroni S, Milanese C, Girella A, et al. (2010) Sorption properties of NaBH4/MH2 (M=Mg, Ti) powder systems. Int J Hydrogen Energy 35: 5434-5441. doi: 10.1016/j.ijhydene.2010.03.004
|
| [118] |
119. Pottmaier D, Garroni S, Barò MD, et al. (2010) Hydrogen Desorption Reactions of the Na-Mg-B-H System. Adv Sci Tech72: 164-169. doi: 10.4028/www.scientific.net/AST.72.164
|
| [119] | 120.Pottmaier D, Garroni S, Brunelli M, et al. (2010) NaBX4-MgX2 Composites (X= D,H) Investigated by In situ Neutron Diffraction. Mater Res Soc Symp Proc 1262: W03-04. |
| [120] |
121. Nwakwuo CC, Pistidda C, Dornheim M, et al. (2012) Microstructural study of hydrogen desorption in 2NaBH4 + MgH2 reactive hydride composite. Int J Hydrogen Energy 37: 2382-2387. doi: 10.1016/j.ijhydene.2011.10.070
|
| [121] |
122. Mao J, Guo Z, Yu X, et al. (2011) Improved Hydrogen Storage Properties of NaBH4 Destabilized by CaH2 and Ca(BH4)2. J Phys Chem C 115: 9283-9290. doi: 10.1021/jp2020319
|
| [122] |
123. Franco F, Baricco M, Chierotti MR, et al. (2013) Coupling Solid-State NMR with GIPAW ab Initio Calculations in Metal Hydrides and Borohydrides. J Phys Chem C 117: 9991-9998. doi: 10.1021/jp3126895
|
| [123] |
124. Shane DT, Corey RL, Bowman Jr RC, et al. (2009) NMR studies of the hydrogen storage compound NaMgH3. J Phys Chem C 113: 18414-18419. doi: 10.1021/jp906414q
|
| [124] |
125. Huang Z, Eagles M, Porter S, et al. (2013) Thermolysis and solid state NMR studies of NaB3H8, NH3B3H7, and NH4B3H8. Dalton Transactions 42: 701-708. doi: 10.1039/C2DT31365K
|
| [125] |
126. Çakır D, de Wijs GA, Brocks G (2011) Native Defects and the Dehydrogenation of NaBH4. J Phys Chem C 115: 24429-24434. doi: 10.1021/jp208642g
|
| [126] |
127. Pistidda C, Barkhordarian G, Rzeszutek A, et al. (2011) Activation of the reactive hydride composite 2NaBH4+MgH2. Scripta Materialia 64: 1035-1038. doi: 10.1016/j.scriptamat.2011.02.017
|
| [127] |
128. Kato S, Borgschulte A, Bielmann M, et al. (2012) Interface reactions and stability of a hydride composite (NaBH4 + MgH2). Phys Chem Chem Phys 14: 8360-8368. doi: 10.1039/c2cp23491b
|
| [128] |
129. Pistidda C, Napolitano E, Pottmaier D, et al. (2013) Structural study of a new B-rich phase obtained by partial hydrogenation of 2NaH + MgB2. Int J Hydrogen Energy 38: 10479-10484. doi: 10.1016/j.ijhydene.2013.06.025
|
| [129] |
130. Milanese C, Garroni S, Girella A, et al. (2011) Thermodynamic and Kinetic Investigations on Pure and Doped NaBH4-MgH2 System. J Phys Chem C 115: 3151-3162. doi: 10.1021/jp109392e
|
| [130] |
131. Saldan I, Gosalawit-Utke R, Pistidda C, et al. (2012) Influence of Stoichiometry on the Hydrogen Sorption Behavior in the LiF-MgB2 System. J Phys Chem C 116: 7010-7015. doi: 10.1021/jp212322u
|
| [131] |
132. Christian M, Aguey-Zinsou K-F (2013) Synthesis of core-shell NaBH4@M (M = Co, Cu, Fe, Ni, Sn) nanoparticles leading to various morphologies and hydrogen storage properties. Chem Commun 49: 6794-6796. doi: 10.1039/c3cc42815j
|
| [132] | 133. Mulas G, Campesi R, Garroni S, et al. (2012) Hydrogen storage in 2NaBH4+MgH2 mixtures: Destabilization by additives and nanoconfinement. J Alloy Compd 536, Supplement 1: S236-S240. |
| [133] | 134. Peru F, Garroni S, Campesi R, et al. (2013) Ammonia-free infiltration of NaBH4 into highly-ordered mesoporous silica and carbon matrices for hydrogen storage. J Alloy Compd 580, Supplement 1: S309-S312. |
| [134] | 135. Bardhan R, Hedges LO, Pint CL, et al. (2013) Uncovering the intrinsic size dependence of hydriding phase transformations in nanocrystals. Nat Mater advance online publication. |
| [135] | 136. Schlesinger HI, Sanderson RT, Burg AB (1940) Metallo Borohydrides. I. Aluminum Borohydride. J Am Chem Soc 62: 3421-3425. |
| [136] |
137. Schlesinger HI, Brown HC (1940) Metallo Borohydrides. III. Lithium Borohydride. J Am Chem Soc 62: 3429-3435. doi: 10.1021/ja01869a039
|
| [137] | 138. Schlesinger HI, Brown HC, Hoekstra HR, et al. (1953) Reactions of Diborane with Alkali Metal Hydrides and Their Addition Compounds. New Syntheses of Borohydrides. Sodium and Potassium Borohydrides1. J Am Chem Soc 75: 199-204. |
| [138] | 139. Schlesinger HI, Brown HC, Abraham B, et al. (1953) New Developments in the Chemistry of Diborane and the Borohydrides. I. General Summary1. J Am Chem Soc 75: 186-190. |
| [139] |
140. Miwa K, Aoki M, Noritake T, et al. (2006) Correlation between thermodynamic staibilties of metal borohydrides and cation electronegavities: First principles calculations and experiments. Phys Rev B 74: 075110. doi: 10.1103/PhysRevB.74.075110
|
| [140] | 141. Nakamori Y, Li H, Kikuchi K, et al. (2007) Thermodynamical stabilities of metal-borohydrides. J Alloy Compd 447: 296-300. |
| [141] |
142. Hu J, Kwak JH, Zhenguo Y, et al. (2009) Direct observation of ion exchange in mechanism activated LiH+MgB2 system using ultrahigh field nuclear magnetic resonance spectroscopy. Appl Phys Lett 94: 05. doi: 10.1063/1.3110966
|
| [142] |
143. Li H-W, Matsunaga T, Yan Y, et al. (2010) Nanostructure-induced hydrogenation of layered compound MgB2. J Alloy Compd 505: 654-656. doi: 10.1016/j.jallcom.2010.06.101
|
| [143] |
144. Pistidda C, Garroni S, Dolci F, et al. (2010) Synthesis of amorphous Mg(BH4)2 from MgB2 and H2 at room temperature. J Alloy Compd 508: 212-215. doi: 10.1016/j.jallcom.2010.07.226
|
| [144] | 145. Barkhordarian G, Jensen TR, Doppiu S, et al. (2008) Formation of Ca(BH4)2 from Hydrogenation of CaH2+MgB2 Composite. J Phys Chem C 112: 2743-2749. |
| [145] |
146. Nwakwuo CC, Pistidda C, Dornheim M, et al. (2011) Microstructural analysis of hydrogen absorption in 2NaH+MgB2. Scripta Materialia 64: 351-354. doi: 10.1016/j.scriptamat.2010.10.034
|
| [146] |
147. Garroni S, Minella CB, Pottmaier D, et al. (2013) Mechanochemical synthesis of NaBH4 starting from NaH-MgB2 reactive hydride composite system. Int J Hydrogen Energy 38: 2363-2369. doi: 10.1016/j.ijhydene.2012.11.136
|
| [147] |
148. Nwakwuo CC, Hutchison JL, Sykes JM (2012) Hydrogen sorption in 3NaH+MgB2/2NaBH4+NaMgH3 composite. Scripta Materialia 66: 175-177. doi: 10.1016/j.scriptamat.2011.10.035
|
| [148] | 149. Wang H, Zhang J, Liu JW, et al. (2013) Catalysis and hydrolysis properties of perovskite hydride NaMgH3. J Alloy Compd 580, Supplement 1: S197-S201. |
| [149] |
150. Rafi ud d, Xuanhui Q, Zahid GH, et al. (2014) Improved hydrogen storage performances of MgH2-NaAlH4 system catalyzed by TiO2 nanoparticles. J Alloy Compd 604: 317-324. doi: 10.1016/j.jallcom.2014.03.150
|
| [150] |
151. Milošević S, Milanović I, Mamula BP, et al. (2013) Hydrogen desorption properties of MgH2 catalysed with NaNH2. Int J Hydrogen Energy 38: 12223-12229. doi: 10.1016/j.ijhydene.2013.06.083
|
| [151] |
152. Li Y, Fang F, Song Y, et al. (2013) Hydrogen storage of a novel combined system of LiNH2-NaMgH3: synergistic effects of in situ formed alkali and alkaline-earth metal hydrides. Dalton Transactions 42: 1810-1819. doi: 10.1039/C2DT31923C
|
| 1. | Xiao Wu, Zilai Zhou, Feng Xie, Multi-scale dynamics of a piecewise-smooth Bazykin’s prey–predator system, 2024, 0924-090X, 10.1007/s11071-024-10292-9 |
Figures(2) / Tables(3)

Daphiny Pottmaier, Marcello Baricco. Materials for hydrogen storage and the Na-Mg-B-H system[J]. AIMS Energy, 2015, 3(1): 75-100. doi: 10.3934/energy.2015.1.75

| Feature | Definition | Formula and description | The connection to emotions |
| ZCR | The number of times the signal passes the zero value in unit time. | $ {Z}_{x}=\frac{1}{N}{Z}_{num}\left(x\right) $, where N is the length of the signal sample. Znum is the number of times the signal passes through zero in unit time. | ZCR is closely related to positive emotions. The higher the ZCR value, the more significant the positive emotions will be. |
| SD | The degree of dispersion among individuals in the sample, the amplitude of indirect reaction signal change from the mean. | $ {S}_{x}=\sqrt{\frac{\sum _{i=1}^{n}{\left({x}_{i}-\stackrel{-}{x}\right)}^{2}}{n-1}} $, where $ n $ is the number of samples, $ {x}_{i} $ is the value of each data, and $ \stackrel{-}{x} $ is the mean of the sample. | SD indirectly represents signal changes from the mean, so as to judge whether the brain activity pulls away from the stationary state. |
| Mean | Indirectly reflects the intensity of brain activity. | $ {\mu }_{\xi }=\frac{1}{T}\sum _{t=1}^{T}\xi \left(t\right) $, where $ \mathrm{\xi }\left(\mathrm{t}\right) $ is the time domain data, and T is the data length. | Mean represents the intensity of brain activity in a certain period of time, the higher the value, the greater the intensity of activity. |
| RMS | The degree to which the data value of each frame of the EEG signal deviates from the mean value of the overall sample signal. | $ rms=\sqrt{\frac{\sum _{\mathrm{i}=0}^{n}{{x}_{\mathrm{i}}}^{2}}{n}} $, where $ {x}_{\mathrm{i}} $ is the time domain signal data, and n is the sample length. | RMS represents the degree to which the data value of each frame deviates from the mean of the whole sample signal, reflecting the degree of deviation from the intensity of brain activity. |
| Eng | EEG is variable and non-stationary, and its total energy is infinite. | $ {E}_{x}={\int }_{-\mathrm{\infty }}^{\mathrm{\infty }}{\left|x\left(t\right)\right|}^{2}dt $, where $ x\left(t\right) $ represents the signal data value at a certain time, and the total energy is the integral of the square of the signal data. | Eng can capture the emotional change and evolution trend, the higher the Eng value, the stronger the positive emotion will be. |
| Skewness | The distribution symmetry of the values of a particular population is described. | $ {b}_{1}=\frac{{m}_{3}}{{s}^{3}}=\frac{\frac{1}{n}{\sum }_{i=1}^{n}{\left({x}_{i}-\overline{x}\right)}^{3}}{{\left[\frac{1}{n-1}{\sum }_{i=1}^{n}{\left({x}_{i}-\overline{x}\right)}^{2}\right]}^{3/2}} $, where $ \overline{\mathrm{x}} $ is the mean, $ \mathrm{s} $ is the standard deviation, and $ {m}_{3} $ is the third-order central matrix. | Skewness represents the degree of deviation between each frame and the normal distribution. The larger the value, the larger the skewness of its distribution form. |
| ApEn | A nonlinear parameter used to quantify the regularity and unpredictability of time series fluctuation | (1) $ {X}_{i}=\left[x\left(i\right), x\left(i+1\right), ..., x\left(i+x-1\right)\right] $ (2) $ d\left[{X}_{i}, {X}_{j}\right]=max\left|x\left(i+k\right)-x\left(j+k\right)\right|, k\in \left(0, m-1\right) $ (3) $ {B}_{i}^{m}\left(r\right)=\frac{{B}_{i}}{N-m+1} $ (4) $ {B}^{m}\left(r\right)=\frac{1}{N-m+1}\sum _{i=1}^{N-m+1}\mathrm{ln}{B}_{i}^{m}\left(r\right) $ (5) $ ApEn\left(m, r, N\right)={B}_{i}^{m}\left(r\right){-B}^{m+1}\left(r\right) $ (6) Arrange the elements of the time series X in order as vectors with m dimension (7) Define $ d\left[{X}_{i}, {X}_{j}\right] $ as the distance between vector $ {X}_{i} $ and vector $ {X}_{j} $ (8) Write $ {B}_{i}^{} $ as the number of $ d\left[{X}_{i}, {X}_{j}\right]\le r $ (r is the similarity tolerance), and calculate the ratio of $ {B}_{i}^{} $ to the total number of vectors (N-m+1) (9) Take the logarithmic operation on $ {B}_{i}^{m}\left(r\right) $, and then find its average of all $ \mathrm{i} $, and write it as $ {B}^{m}\left(r\right) $ (10) Make $ m=m+1 $ and repeat (1)–(4) to obtain $ {B}^{m+1}\left(r\right) $. (11) Final representation approximate entropy |
ApEn represents the complexity of EEG and reflects the possibility of new information. The more complex time series, the greater the value will be. |
| SampEn | The probability of generating new patterns in the sequence when measuring the complexity and dimensional changes of EEG. | (1) $ {B}_{i}^{m}\left(r\right)=\frac{1}{N-m}num\left\{d\left[{X}_{i}, {X}_{j}\right] < r\right\} $ (2) $ {B}^{m}\left(r\right)=\frac{1}{N-m+1}\sum _{i=1}^{N-m+1}{B}_{i}^{m}\left(r\right) $ (3) It is the same as the approximate entropy in the first two steps. Starting from the third step, the specific steps are as follows: (4) Given threshold $ \mathrm{r}\left(\mathrm{r} > 0\right) $, count the number of $ d\left[{X}_{i}, {X}_{j}\right] < r $ and its ratio to the total number of vectors $ \left(N-m\right) $ (5) Average the results of the previous step (6) Add dimension 𝑚 to 1 and repeat the above four steps (7) The actual number of samples is limited, and the final sample entropy is obtained |
SampEn measures the probability of generating new patterns in sequence when the EEG complexity and dimension change. The higher the probability, the greater the complexity. |
| Hjorth | Describe the three time-domain feature sets of EEG single channel, including activity, mobility, and complexity. | $ HA={\sigma }_{0}^{2} $; $ HM=\frac{{\sigma }_{1}}{{\sigma }_{0}} $; $ HC=\frac{{\sigma }_{2}{\sigma }_{0}}{{\sigma }_{1}^{2}} $ where $ {\sigma }_{0} $ is the standard deviation of the signal, and $ {\sigma }_{1} $ and $ {\sigma }_{2} $ are the standard deviations of the first and second derivatives of the signal. |
Hjorth represents the EEG changes at different time and spatial locations, thereby revealing the rules and characteristics of brain electrical activity. |
DownLoad:
CSV
| Feature | Definition | Formula and description | The connection to emotions |
| PSD | Represents the conversion of signal strength to unit bandwidth frequency, i.e. the distribution of signal strength within the frequency range. | (1) EEG signals $ s\left[0\right], s\left[1\right], \cdots \cdots, s\left[N-1\right] $ are divided into k segments, calculate the windowed discrete Fourier transform $ {S}_{k\left(v\right)} $, which is shown as follows:$ {S}_{k\left(v\right)}=\sum _{m}S\left[m\right]w\left[m\right]exp\left(-j2\pi vm\right) $ where, $ m $ is between $ \left(k-1\right)L $ and $ M+\left(k-1\right)L-1 $, $ w\left(m\right) $ is the window function, M is the segment size, and L is the number of information points between segments, $ v=i $/M, where $ -\left(\frac{M}{2}-1\right) < i < \frac{M}{2} $. (2) Calculate the modified periodic chart value using the formula: $ {P}_{k}\left(v\right)=1/wabs{\left({S}_{k}\left(v\right)\right)}^{2} $ where, $ w={\sum }_{m=0}^{M}{w}^{2}\left[m\right] $. (3) Estimate the power spectral density by using the average of the periodic plot values calculated using the equation: $ {L}_{s}\left(v\right)=1/K\sum _{k=1}^{K}{P}_{k}\left(v\right) $ where, the number of points shared by two adjacent signal segments is equal to (M-L), which means that the two adjacent segments will be overlapped by (M-L) points. |
PSD represents the energy distribution of EEG signals in different frequency bands, and identifies emotional states through the difference of energy distribution. |
| DE | It is a generalization of Shannon's information entropy $ -{\sum }_{x}p\left(x\right)\mathit{log}\left(p\left(x\right)\right) $ on continuous variables. | $ DE=-{\int }_{a}^{b}p\left(x\right)\mathit{log}\left(p\left(x\right)\right)dx={\int }_{a}^{b}\frac{1}{\sqrt{2\pi {\sigma }_{i}^{2}}}{e}^{-\frac{{\left(x-\mu \right)}^{2}}{2{\sigma }_{i}^{2}}}\mathit{log}(1√2πσ2ie−(x−μ)22σ2i) dx=\frac{1}{2}\mathit{log}\left(2\pi e{\sigma }_{i}^{2}\right) $ Here $ p\left(x\right) $ represents the probability density function of continuous information, and [a, b] represents the interval of information values, which is equal to the logarithm of its energy spectrum in a specific frequency band. |
DE represents the complexity and irregularity of EEG signals in the frequency domain and captures the dynamic changes. |
DownLoad:
CSV
| Algorithm: SSA-RF |
| Input: D: EEG Data |
| G: Number of iterations |
| P: Number of population |
| F0: Global optimal fitness value |
| F: Current fitness value |
| Output: Optimal DTN and LMN of RF |
| 1: Initialize the RF model and substitute D into it |
| 2: Determine the initial location of sparrow population |
| 3: while i < G do |
| 4: for m = 1 to P do |
| 5: Use the fitness function to determine the global fitness value |
| 6: Update population position based on fitness ranking order |
| 7: if F < F0 then |
| 8: Update the global optimal position |
| 9: end if |
| 10: end for |
| 11: Select the global optimal position |
| 12: end while |
| 13: Extract the two dimensional data of the global optimal position (DTN and LMN) and substitute it into the RF model to output the results |
DownLoad:
CSV
| Dataset | Data format | Caption |
| DEAP | 40 × 32 × 7680 | 40: video 32: channel 7680: data |
| SEED | 15 × 3 × 62 × M | 15: video 3: number of experiments 62: channel M: data |
DownLoad:
CSV
| Parameter | Value |
| Population number | 8 |
| Maximum number of iterations | 20 |
| Dimension | 2 |
| lower boundary | 1 |
| Upper boundary | 50 |
DownLoad:
CSV
|
1 | 2 | 3 | 4 | 5 | 6 | 7 | 8 |
| DTN | 34 | 50 | 49 | 37 | 29 | 24 | 24 | 27 |
| MLN | 1 | 1 | 1 | 2 | 2 | 1 | 3 | 1 |
DownLoad:
CSV
|
1 | 2 | 3 | 4 | 5 | 6 | 7 | 8 |
| SSA-RF | 76.70 | 77.27 | 77.57 | 76.80 | 77.40 | 76.52 | 76.40 | 75.83 |
| RF | 73.05 | 76.88 | 74.55 | 75.03 | 76.59 | 76.19 | 73.86 | 75.39 |
| Difference | 3.65↑ | 0.39↑ | 3.02↑ | 1.77↑ | 0.81↑ | 0.33↑ | 2.54↑ | 0.44↑ |
| Average | 1.62↑ | |||||||
DownLoad:
CSV
|
1 | 2 | 3 | 4 | 5 | 6 | 7 | 8 |
| DTN | 33 | 35 | 32 | 50 | 34 | 28 | 34 | 43 |
| MLN | 10 | 9 | 4 | 4 | 1 | 4 | 16 | 13 |
DownLoad:
CSV
|
1 | 2 | 3 | 4 | 5 | 6 | 7 | 8 |
| SSA-RF | 82.58 | 72.89 | 79.73 | 75.38 | 75.20 | 73.11 | 74.84 | 73.96 |
| RF | 73.33 | 62.22 | 66.67 | 64.44 | 68.89 | 68.89 | 64.44 | 60.00 |
| Difference | 9.25↑ | 10.67↑ | 13.06↑ | 10.94↑ | 6.31↑ | 4.22↑ | 10.40↑ | 13.96↑ |
| Average | 9.85↑ | |||||||
DownLoad:
CSV
|
1 | 2 | 3 | 4 | 5 | 6 | 7 | 8 |
| PSO-RF | 75.23 | 77.50 | 77.50 | 73.18 | 59.55 | 70.23 | 63.41 | 64.32 |
| WOA-RF | 71.36 | 54.09 | 73.18 | 69.77 | 65.68 | 59.55 | 69.55 | 61.36 |
| GA-RF | 62.73 | 72.50 | 74.55 | 74.09 | 63.41 | 74.55 | 62.05 | 68.40 |
| SSA-RF | 76.70 | 77.27 | 77.57 | 76.80 | 77.40 | 76.52 | 76.40 | 75.83 |
| RF | 73.05 | 76.88 | 74.55 | 75.03 | 76.59 | 76.19 | 73.86 | 75.39 |
DownLoad:
CSV
| Dataset | References (Year) | Model | Average Acc (%) |
| DEAP | Arnau-Gonzalez et al. [28] (2017) | SVM | 73.41 |
| Li et al. [29] (2018) | SVM | 59.06 | |
| Pandey et al. [30] (2019) | Deep Neural Network | 62.50 | |
| Cimtay et al. [31] (2020) | CNN | 72.81 | |
| Mert Ahmet et al. [32] (2021) | ANN | 70.02 | |
| Xu et al. [33] (2022) | GRU-Conv | 70.07 | |
| She et al. [34] (2023) | DDSA-mRMR-SRM | 64.40 | |
| Ours | SSA-RF | 76.81 | |
| SEED | Lan et al. [35] (2018) | MIDA | 72.47 |
| Gupta et al. [36] (2019) | Random forest classification model | 72.07 | |
| Luo et al. [37] (2020) | sWGAN + SVM | 67.7 | |
| Topic et al. [38] (2021) | TOPO-FM and HOLO-FM | 73.11 | |
| Emsawas et al. [39] (2022) | MultiT-S ConvNet | 54.60 | |
| Zhang et al. [40] (2023) | Semi-supervised emotion recognition model | 73.26 | |
| Ours | SSA-RF | 75.96 |
DownLoad:
CSV
| Feature | Definition | Formula and description | The connection to emotions |
| ZCR | The number of times the signal passes the zero value in unit time. | $ {Z}_{x}=\frac{1}{N}{Z}_{num}\left(x\right) $, where N is the length of the signal sample. Znum is the number of times the signal passes through zero in unit time. | ZCR is closely related to positive emotions. The higher the ZCR value, the more significant the positive emotions will be. |
| SD | The degree of dispersion among individuals in the sample, the amplitude of indirect reaction signal change from the mean. | $ {S}_{x}=\sqrt{\frac{\sum _{i=1}^{n}{\left({x}_{i}-\stackrel{-}{x}\right)}^{2}}{n-1}} $, where $ n $ is the number of samples, $ {x}_{i} $ is the value of each data, and $ \stackrel{-}{x} $ is the mean of the sample. | SD indirectly represents signal changes from the mean, so as to judge whether the brain activity pulls away from the stationary state. |
| Mean | Indirectly reflects the intensity of brain activity. | $ {\mu }_{\xi }=\frac{1}{T}\sum _{t=1}^{T}\xi \left(t\right) $, where $ \mathrm{\xi }\left(\mathrm{t}\right) $ is the time domain data, and T is the data length. | Mean represents the intensity of brain activity in a certain period of time, the higher the value, the greater the intensity of activity. |
| RMS | The degree to which the data value of each frame of the EEG signal deviates from the mean value of the overall sample signal. | $ rms=\sqrt{\frac{\sum _{\mathrm{i}=0}^{n}{{x}_{\mathrm{i}}}^{2}}{n}} $, where $ {x}_{\mathrm{i}} $ is the time domain signal data, and n is the sample length. | RMS represents the degree to which the data value of each frame deviates from the mean of the whole sample signal, reflecting the degree of deviation from the intensity of brain activity. |
| Eng | EEG is variable and non-stationary, and its total energy is infinite. | $ {E}_{x}={\int }_{-\mathrm{\infty }}^{\mathrm{\infty }}{\left|x\left(t\right)\right|}^{2}dt $, where $ x\left(t\right) $ represents the signal data value at a certain time, and the total energy is the integral of the square of the signal data. | Eng can capture the emotional change and evolution trend, the higher the Eng value, the stronger the positive emotion will be. |
| Skewness | The distribution symmetry of the values of a particular population is described. | $ {b}_{1}=\frac{{m}_{3}}{{s}^{3}}=\frac{\frac{1}{n}{\sum }_{i=1}^{n}{\left({x}_{i}-\overline{x}\right)}^{3}}{{\left[\frac{1}{n-1}{\sum }_{i=1}^{n}{\left({x}_{i}-\overline{x}\right)}^{2}\right]}^{3/2}} $, where $ \overline{\mathrm{x}} $ is the mean, $ \mathrm{s} $ is the standard deviation, and $ {m}_{3} $ is the third-order central matrix. | Skewness represents the degree of deviation between each frame and the normal distribution. The larger the value, the larger the skewness of its distribution form. |
| ApEn | A nonlinear parameter used to quantify the regularity and unpredictability of time series fluctuation | (1) $ {X}_{i}=\left[x\left(i\right), x\left(i+1\right), ..., x\left(i+x-1\right)\right] $ (2) $ d\left[{X}_{i}, {X}_{j}\right]=max\left|x\left(i+k\right)-x\left(j+k\right)\right|, k\in \left(0, m-1\right) $ (3) $ {B}_{i}^{m}\left(r\right)=\frac{{B}_{i}}{N-m+1} $ (4) $ {B}^{m}\left(r\right)=\frac{1}{N-m+1}\sum _{i=1}^{N-m+1}\mathrm{ln}{B}_{i}^{m}\left(r\right) $ (5) $ ApEn\left(m, r, N\right)={B}_{i}^{m}\left(r\right){-B}^{m+1}\left(r\right) $ (6) Arrange the elements of the time series X in order as vectors with m dimension (7) Define $ d\left[{X}_{i}, {X}_{j}\right] $ as the distance between vector $ {X}_{i} $ and vector $ {X}_{j} $ (8) Write $ {B}_{i}^{} $ as the number of $ d\left[{X}_{i}, {X}_{j}\right]\le r $ (r is the similarity tolerance), and calculate the ratio of $ {B}_{i}^{} $ to the total number of vectors (N-m+1) (9) Take the logarithmic operation on $ {B}_{i}^{m}\left(r\right) $, and then find its average of all $ \mathrm{i} $, and write it as $ {B}^{m}\left(r\right) $ (10) Make $ m=m+1 $ and repeat (1)–(4) to obtain $ {B}^{m+1}\left(r\right) $. (11) Final representation approximate entropy |
ApEn represents the complexity of EEG and reflects the possibility of new information. The more complex time series, the greater the value will be. |
| SampEn | The probability of generating new patterns in the sequence when measuring the complexity and dimensional changes of EEG. | (1) $ {B}_{i}^{m}\left(r\right)=\frac{1}{N-m}num\left\{d\left[{X}_{i}, {X}_{j}\right] < r\right\} $ (2) $ {B}^{m}\left(r\right)=\frac{1}{N-m+1}\sum _{i=1}^{N-m+1}{B}_{i}^{m}\left(r\right) $ (3) It is the same as the approximate entropy in the first two steps. Starting from the third step, the specific steps are as follows: (4) Given threshold $ \mathrm{r}\left(\mathrm{r} > 0\right) $, count the number of $ d\left[{X}_{i}, {X}_{j}\right] < r $ and its ratio to the total number of vectors $ \left(N-m\right) $ (5) Average the results of the previous step (6) Add dimension 𝑚 to 1 and repeat the above four steps (7) The actual number of samples is limited, and the final sample entropy is obtained |
SampEn measures the probability of generating new patterns in sequence when the EEG complexity and dimension change. The higher the probability, the greater the complexity. |
| Hjorth | Describe the three time-domain feature sets of EEG single channel, including activity, mobility, and complexity. | $ HA={\sigma }_{0}^{2} $; $ HM=\frac{{\sigma }_{1}}{{\sigma }_{0}} $; $ HC=\frac{{\sigma }_{2}{\sigma }_{0}}{{\sigma }_{1}^{2}} $ where $ {\sigma }_{0} $ is the standard deviation of the signal, and $ {\sigma }_{1} $ and $ {\sigma }_{2} $ are the standard deviations of the first and second derivatives of the signal. |
Hjorth represents the EEG changes at different time and spatial locations, thereby revealing the rules and characteristics of brain electrical activity. |
| Feature | Definition | Formula and description | The connection to emotions |
| PSD | Represents the conversion of signal strength to unit bandwidth frequency, i.e. the distribution of signal strength within the frequency range. | (1) EEG signals $ s\left[0\right], s\left[1\right], \cdots \cdots, s\left[N-1\right] $ are divided into k segments, calculate the windowed discrete Fourier transform $ {S}_{k\left(v\right)} $, which is shown as follows:$ {S}_{k\left(v\right)}=\sum _{m}S\left[m\right]w\left[m\right]exp\left(-j2\pi vm\right) $ where, $ m $ is between $ \left(k-1\right)L $ and $ M+\left(k-1\right)L-1 $, $ w\left(m\right) $ is the window function, M is the segment size, and L is the number of information points between segments, $ v=i $/M, where $ -\left(\frac{M}{2}-1\right) < i < \frac{M}{2} $. (2) Calculate the modified periodic chart value using the formula: $ {P}_{k}\left(v\right)=1/wabs{\left({S}_{k}\left(v\right)\right)}^{2} $ where, $ w={\sum }_{m=0}^{M}{w}^{2}\left[m\right] $. (3) Estimate the power spectral density by using the average of the periodic plot values calculated using the equation: $ {L}_{s}\left(v\right)=1/K\sum _{k=1}^{K}{P}_{k}\left(v\right) $ where, the number of points shared by two adjacent signal segments is equal to (M-L), which means that the two adjacent segments will be overlapped by (M-L) points. |
PSD represents the energy distribution of EEG signals in different frequency bands, and identifies emotional states through the difference of energy distribution. |
| DE | It is a generalization of Shannon's information entropy $ -{\sum }_{x}p\left(x\right)\mathit{log}\left(p\left(x\right)\right) $ on continuous variables. | $ DE=-{\int }_{a}^{b}p\left(x\right)\mathit{log}\left(p\left(x\right)\right)dx={\int }_{a}^{b}\frac{1}{\sqrt{2\pi {\sigma }_{i}^{2}}}{e}^{-\frac{{\left(x-\mu \right)}^{2}}{2{\sigma }_{i}^{2}}}\mathit{log}(1√2πσ2ie−(x−μ)22σ2i) dx=\frac{1}{2}\mathit{log}\left(2\pi e{\sigma }_{i}^{2}\right) $ Here $ p\left(x\right) $ represents the probability density function of continuous information, and [a, b] represents the interval of information values, which is equal to the logarithm of its energy spectrum in a specific frequency band. |
DE represents the complexity and irregularity of EEG signals in the frequency domain and captures the dynamic changes. |
| Algorithm: SSA-RF |
| Input: D: EEG Data |
| G: Number of iterations |
| P: Number of population |
| F0: Global optimal fitness value |
| F: Current fitness value |
| Output: Optimal DTN and LMN of RF |
| 1: Initialize the RF model and substitute D into it |
| 2: Determine the initial location of sparrow population |
| 3: while i < G do |
| 4: for m = 1 to P do |
| 5: Use the fitness function to determine the global fitness value |
| 6: Update population position based on fitness ranking order |
| 7: if F < F0 then |
| 8: Update the global optimal position |
| 9: end if |
| 10: end for |
| 11: Select the global optimal position |
| 12: end while |
| 13: Extract the two dimensional data of the global optimal position (DTN and LMN) and substitute it into the RF model to output the results |
| Dataset | Data format | Caption |
| DEAP | 40 × 32 × 7680 | 40: video 32: channel 7680: data |
| SEED | 15 × 3 × 62 × M | 15: video 3: number of experiments 62: channel M: data |
| Parameter | Value |
| Population number | 8 |
| Maximum number of iterations | 20 |
| Dimension | 2 |
| lower boundary | 1 |
| Upper boundary | 50 |
|
1 | 2 | 3 | 4 | 5 | 6 | 7 | 8 |
| DTN | 34 | 50 | 49 | 37 | 29 | 24 | 24 | 27 |
| MLN | 1 | 1 | 1 | 2 | 2 | 1 | 3 | 1 |
|
1 | 2 | 3 | 4 | 5 | 6 | 7 | 8 |
| SSA-RF | 76.70 | 77.27 | 77.57 | 76.80 | 77.40 | 76.52 | 76.40 | 75.83 |
| RF | 73.05 | 76.88 | 74.55 | 75.03 | 76.59 | 76.19 | 73.86 | 75.39 |
| Difference | 3.65↑ | 0.39↑ | 3.02↑ | 1.77↑ | 0.81↑ | 0.33↑ | 2.54↑ | 0.44↑ |
| Average | 1.62↑ | |||||||
|
1 | 2 | 3 | 4 | 5 | 6 | 7 | 8 |
| DTN | 33 | 35 | 32 | 50 | 34 | 28 | 34 | 43 |
| MLN | 10 | 9 | 4 | 4 | 1 | 4 | 16 | 13 |
|
1 | 2 | 3 | 4 | 5 | 6 | 7 | 8 |
| SSA-RF | 82.58 | 72.89 | 79.73 | 75.38 | 75.20 | 73.11 | 74.84 | 73.96 |
| RF | 73.33 | 62.22 | 66.67 | 64.44 | 68.89 | 68.89 | 64.44 | 60.00 |
| Difference | 9.25↑ | 10.67↑ | 13.06↑ | 10.94↑ | 6.31↑ | 4.22↑ | 10.40↑ | 13.96↑ |
| Average | 9.85↑ | |||||||
|
1 | 2 | 3 | 4 | 5 | 6 | 7 | 8 |
| PSO-RF | 75.23 | 77.50 | 77.50 | 73.18 | 59.55 | 70.23 | 63.41 | 64.32 |
| WOA-RF | 71.36 | 54.09 | 73.18 | 69.77 | 65.68 | 59.55 | 69.55 | 61.36 |
| GA-RF | 62.73 | 72.50 | 74.55 | 74.09 | 63.41 | 74.55 | 62.05 | 68.40 |
| SSA-RF | 76.70 | 77.27 | 77.57 | 76.80 | 77.40 | 76.52 | 76.40 | 75.83 |
| RF | 73.05 | 76.88 | 74.55 | 75.03 | 76.59 | 76.19 | 73.86 | 75.39 |
| Dataset | References (Year) | Model | Average Acc (%) |
| DEAP | Arnau-Gonzalez et al. [28] (2017) | SVM | 73.41 |
| Li et al. [29] (2018) | SVM | 59.06 | |
| Pandey et al. [30] (2019) | Deep Neural Network | 62.50 | |
| Cimtay et al. [31] (2020) | CNN | 72.81 | |
| Mert Ahmet et al. [32] (2021) | ANN | 70.02 | |
| Xu et al. [33] (2022) | GRU-Conv | 70.07 | |
| She et al. [34] (2023) | DDSA-mRMR-SRM | 64.40 | |
| Ours | SSA-RF | 76.81 | |
| SEED | Lan et al. [35] (2018) | MIDA | 72.47 |
| Gupta et al. [36] (2019) | Random forest classification model | 72.07 | |
| Luo et al. [37] (2020) | sWGAN + SVM | 67.7 | |
| Topic et al. [38] (2021) | TOPO-FM and HOLO-FM | 73.11 | |
| Emsawas et al. [39] (2022) | MultiT-S ConvNet | 54.60 | |
| Zhang et al. [40] (2023) | Semi-supervised emotion recognition model | 73.26 | |
| Ours | SSA-RF | 75.96 |
