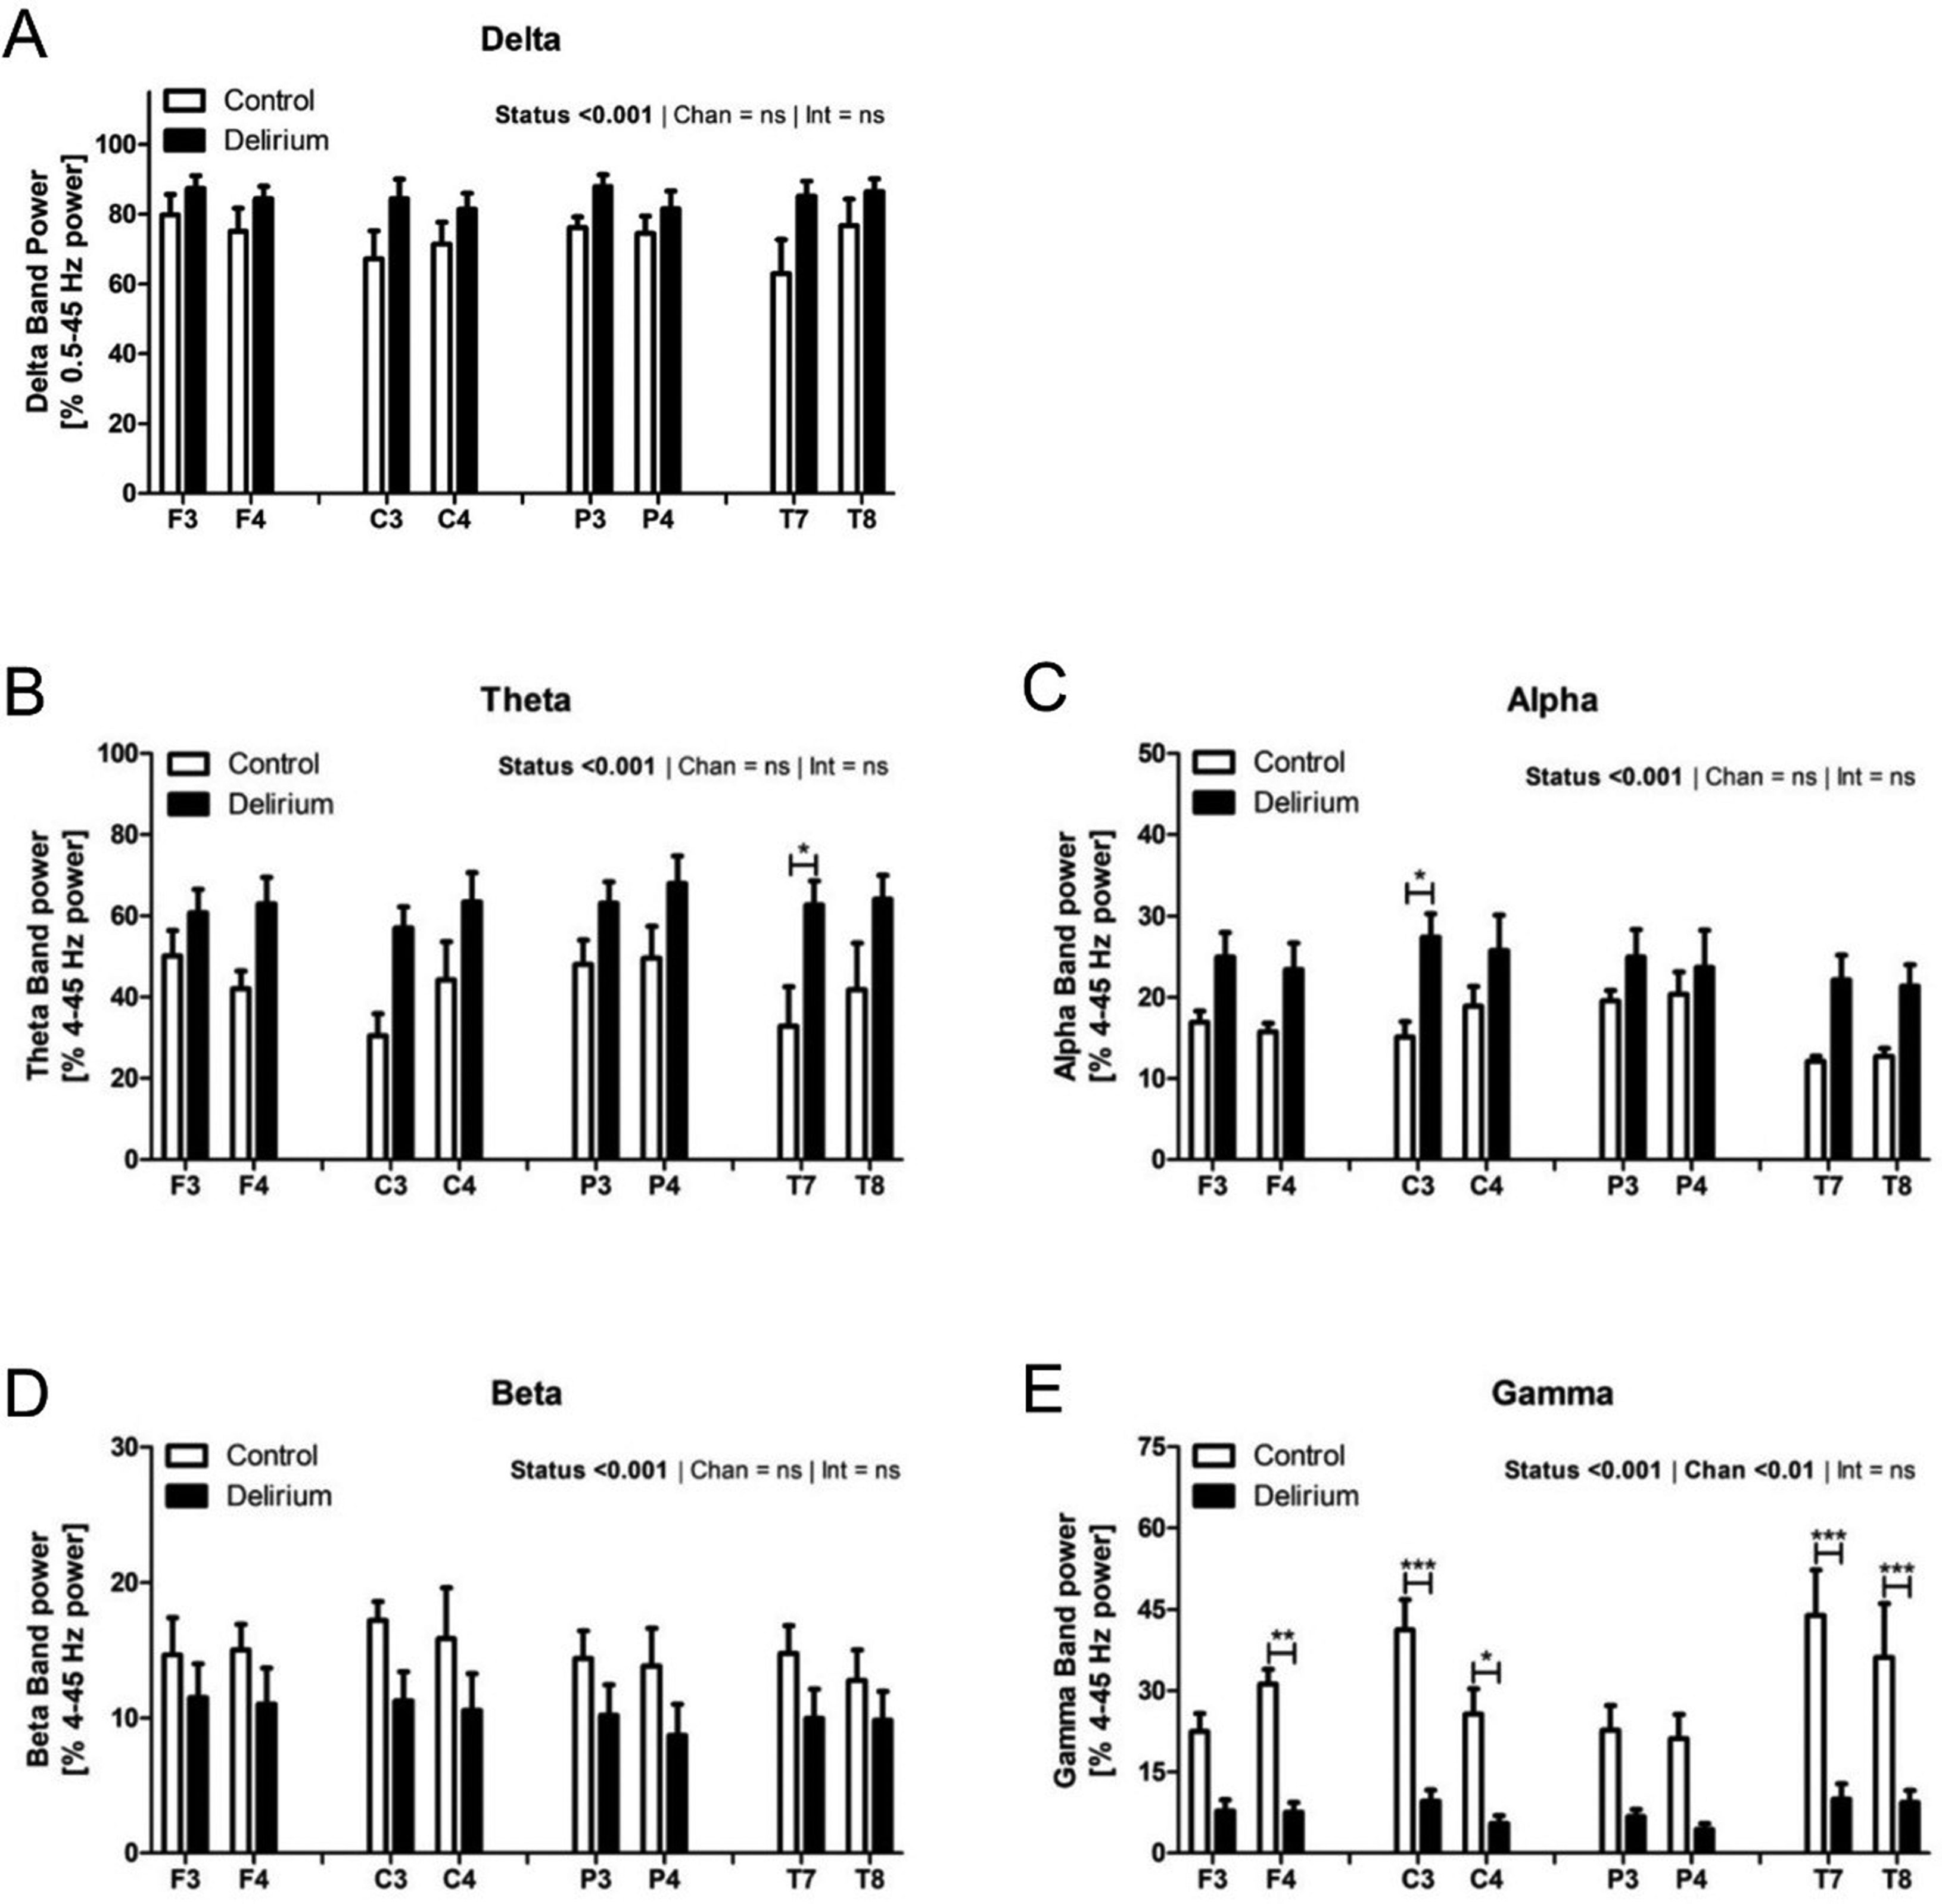
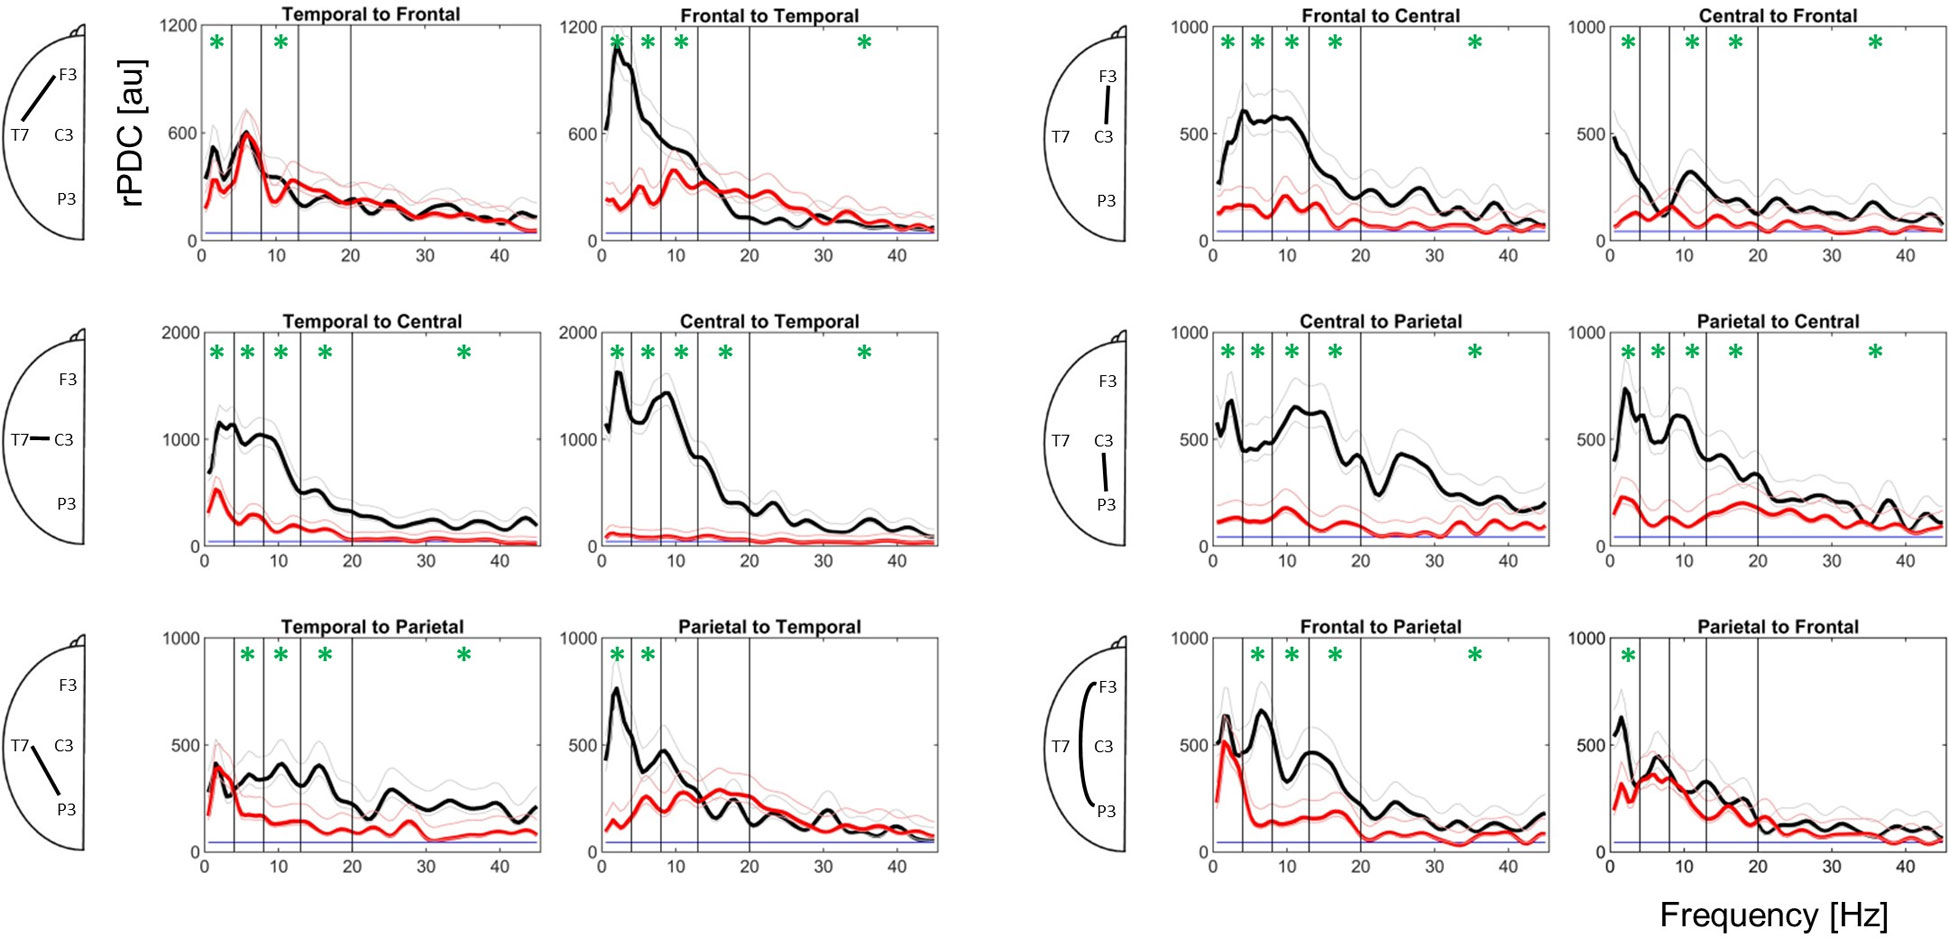
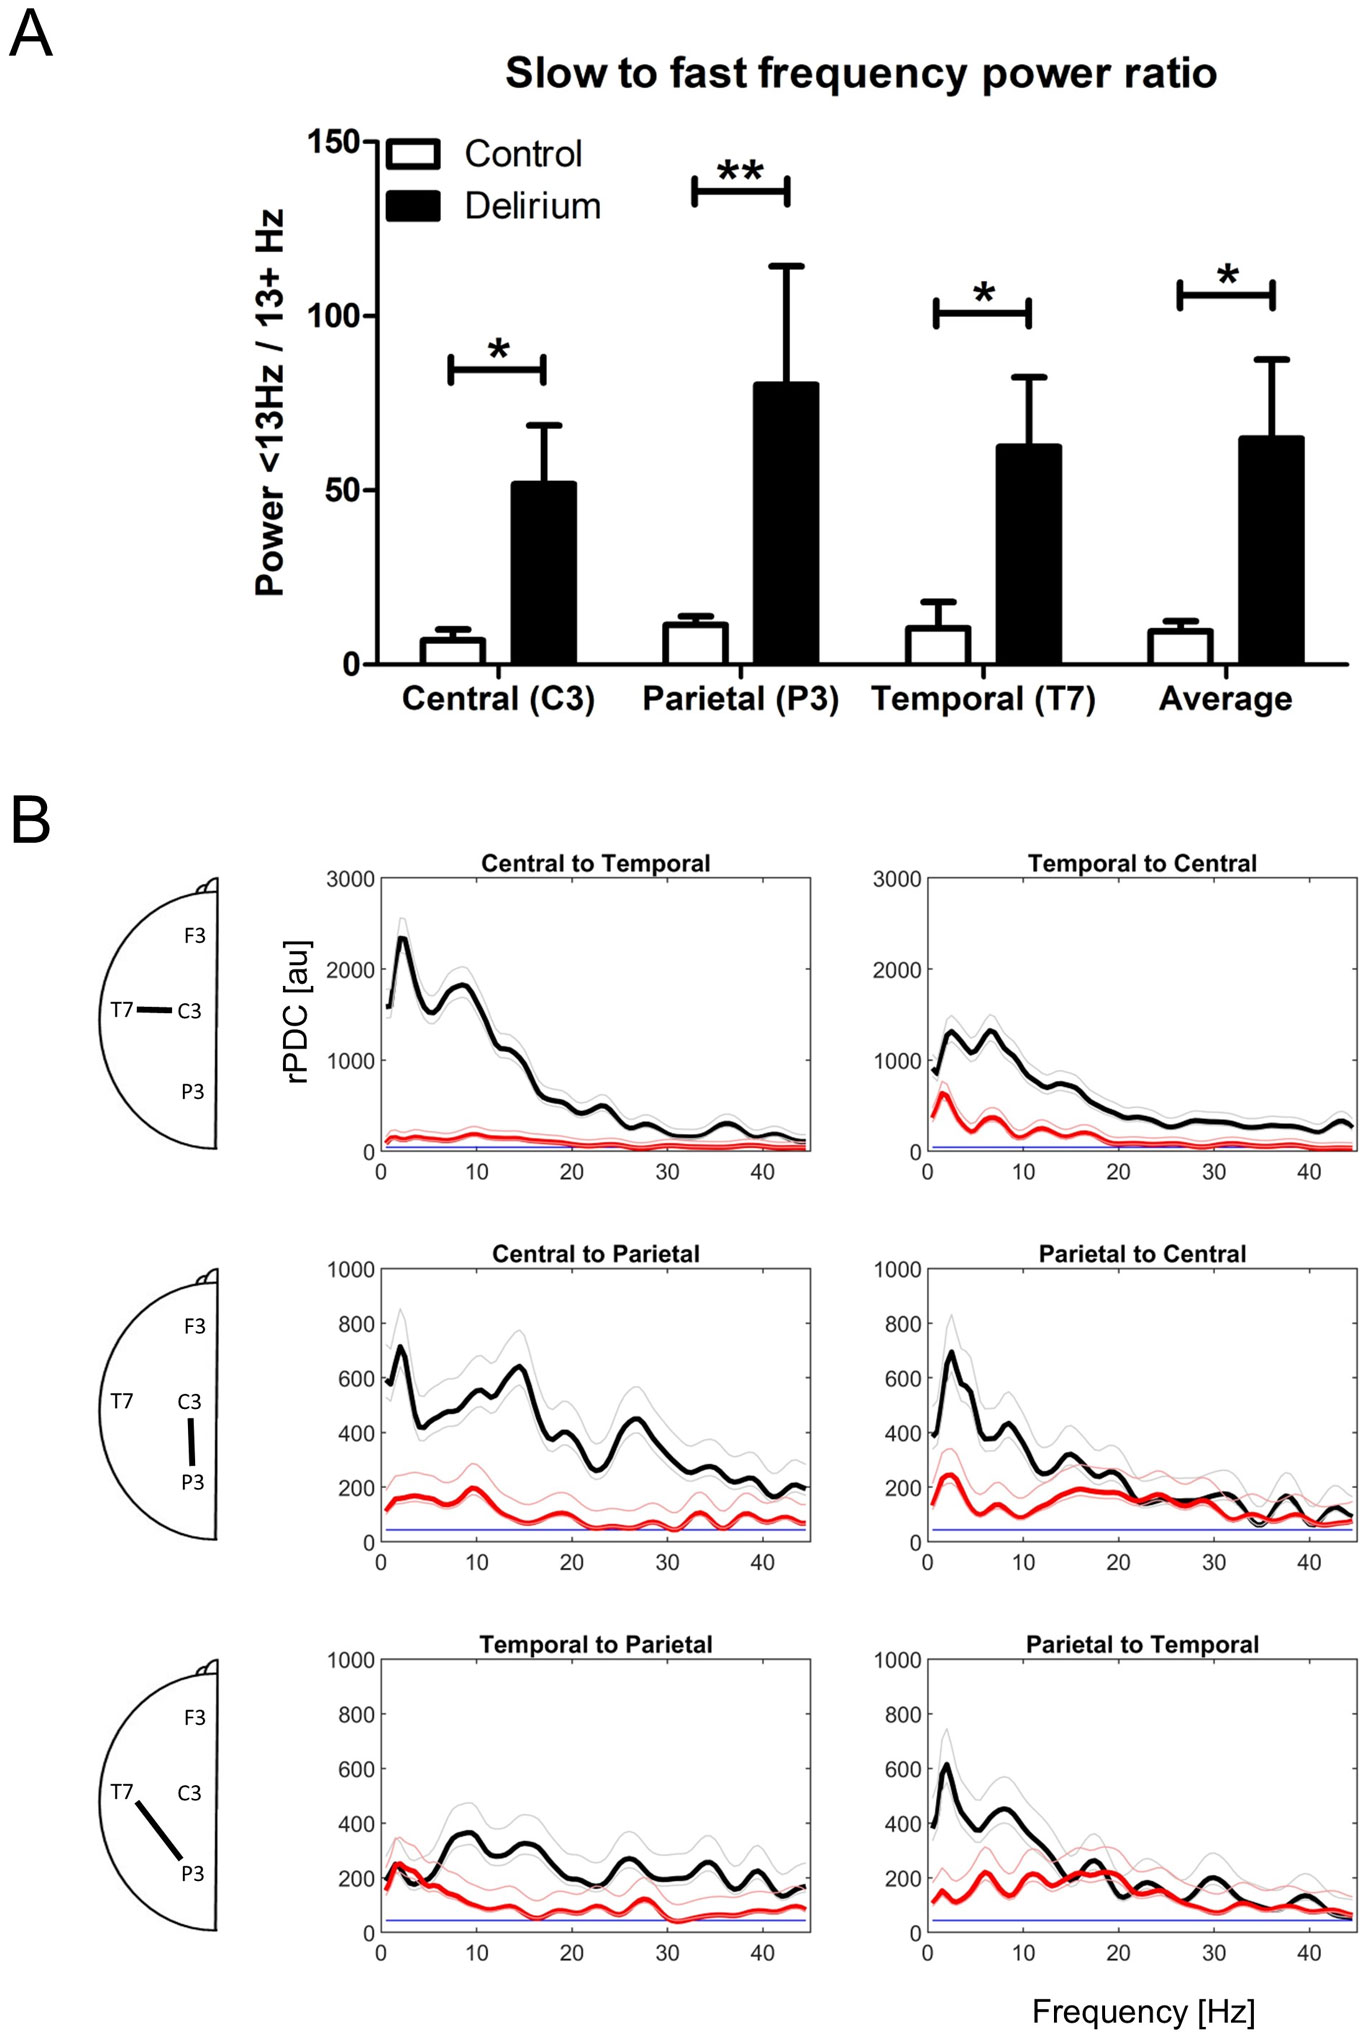
Delirium is an under-diagnosed yet frequently occurring clinical complication with potentially serious consequences for intensive care unit (ICU) patients. Diagnosis is currently reactive and based upon qualitative assessment of the patient's cognitive status by ICU staff. Here, we conducted a preliminary investigation into whether emerging quantitative electroencephalography (QEEG) analysis techniques can accurately discriminate between delirious and non-delirious patients in an ICU setting. Resting EEG recordings from 5 ICU patients in a state of delirium and 5 age matched control patients were analyzed using autoregressive spectral estimation for quantification of EEG power and renormalized partial directed coherence for analysis of directed functional connectivity. Delirious subjects exhibited pronounced EEG slowing as well as severe general loss of directed functional connectivity between recording sites. Distinction between groups based on these parameters was surprisingly clear given the low sample size employed. Furthermore, by targeting the electrode positions where effects were most apparent it was possible to clearly segregate patients using only 3 scalp electrodes. These findings indicate that quantitative diagnosis and monitoring of delirium is not only possible using emerging QEEG methods but is also accomplishable using very low-density electrode systems.
Citation: Andrew Hunter, Barry Crouch, Nigel Webster, Bettina Platt. Delirium screening in the intensive care unit using emerging QEEG techniques: A pilot study[J]. AIMS Neuroscience, 2020, 7(1): 1-16. doi: 10.3934/Neuroscience.2020001
Delirium is an under-diagnosed yet frequently occurring clinical complication with potentially serious consequences for intensive care unit (ICU) patients. Diagnosis is currently reactive and based upon qualitative assessment of the patient's cognitive status by ICU staff. Here, we conducted a preliminary investigation into whether emerging quantitative electroencephalography (QEEG) analysis techniques can accurately discriminate between delirious and non-delirious patients in an ICU setting. Resting EEG recordings from 5 ICU patients in a state of delirium and 5 age matched control patients were analyzed using autoregressive spectral estimation for quantification of EEG power and renormalized partial directed coherence for analysis of directed functional connectivity. Delirious subjects exhibited pronounced EEG slowing as well as severe general loss of directed functional connectivity between recording sites. Distinction between groups based on these parameters was surprisingly clear given the low sample size employed. Furthermore, by targeting the electrode positions where effects were most apparent it was possible to clearly segregate patients using only 3 scalp electrodes. These findings indicate that quantitative diagnosis and monitoring of delirium is not only possible using emerging QEEG methods but is also accomplishable using very low-density electrode systems.

| [1] | American Psychiatric Association (APA) (2013) Diagnostic and statistical manual of mental disorders (5th ed.). |
| [2] |
Truman B, Ely EW (2003) Monitoring delirium in critically ill patients. Using the confusion assessment method for the intensive care unit. Crit Care Nurse 23: 25-28. doi: 10.4037/ccn2003.23.2.25

|
| [3] |
Ely EW, Stephens RK, Jackson JC, et al. (2004) Current opinions regarding the importance, diagnosis, and management of delirium in the intensive care unit: A survey of 912 healthcare professionals. Crit Care Med 32: 106-112. doi: 10.1097/01.CCM.0000098033.94737.84
|
| [4] |
Boot R (2012) Delirium: A review of the nurses role in the intensive care unit. Intensive Crit Care Nurs 28: 185-189. doi: 10.1016/j.iccn.2011.11.004
|
| [5] |
Ely EW, Margolin R, Francis J, et al. (2001) Evaluation of delirium in critically ill patients: Validation of the Confusion Assessment Method for the intensive care unit (CAM-ICU). Crit Care Med 29: 1370-1379. doi: 10.1097/00003246-200107000-00012
|
| [6] |
Ely EW, Shintani A, Truman B, et al. (2004) Delirium as a predictor of mortality in mechanically ventilated patients in the intensive care unit. J Am Med Assoc 291: 1753-1762. doi: 10.1001/jama.291.14.1753
|
| [7] |
Han JH, Wilson A, Graves AJ, et al. (2014) Validation of the confusion assessment method for the intensive care unit in older emergency department patients. Acad Emerg Med 21: 180-187. doi: 10.1111/acem.12309
|
| [8] |
Van Eijk MM, Van Den Boogaard M, Van Marum RJ, et al. (2011) Routine use of the confusion assessment method for the intensive care unit: A multicenter study. Am J Respir Crit Care Med 184: 340-344. doi: 10.1164/rccm.201101-0065OC
|
| [9] | Jacobson S, Jerrier H (2000) EEG in delirium. Semin Clin Neuropsychiatry 5: 86-92. |
| [10] |
Shafi MM, Santarnecchi E, Fong TG, et al. (2017) Advancing the neurophysiological understanding of delirium. J Am Geriatr Soc 65: 1114-1118. doi: 10.1111/jgs.14748
|
| [11] |
Koponen H, Partanen J, Pääkkönen A, et al. (1989) EEG spectral analysis in delirium. J Neurol Neurosurg Psychiatry 52: 980-985. doi: 10.1136/jnnp.52.8.980
|
| [12] |
Jacobson SA, Leuchter AF, Walter DO, et al. (1993) Serial quantitative EEG among elderly subjects with delirium. Biol Psychiatry 34: 135-140. doi: 10.1016/0006-3223(93)90382-N
|
| [13] |
Whitham EM, Pope KJ, Fitzgibbon SP, et al. (2007) Scalp electrical recording during paralysis: Quantitative evidence that EEG frequencies above 20 Hz are contaminated by EMG. Clin Neurophysiol 118: 1877-1888. doi: 10.1016/j.clinph.2007.04.027
|
| [14] |
Van Dellen E, Van Der Kooi AW, Numan T, et al. (2014) Decreased functional connectivity and disturbed directionality of information flow in the electroencephalography of intensive care unit patients with delirium after cardiac surgery. Anesthesiology 121: 328-335. doi: 10.1097/ALN.0000000000000329
|
| [15] |
Crouch B, Sommerlade L, Veselcic P, et al. (2018) Detection of time-, frequency- and direction-resolved communication within brain networks. Sci Rep 8: 1825. doi: 10.1038/s41598-018-19707-1
|
| [16] |
Choi SH, Lee H, Chung TS, et al. (2012) Neural network functional connectivity during and after an episode of delirium. Am J Psychiatry 169: 498-507. doi: 10.1176/appi.ajp.2012.11060976
|
| [17] |
Numan T, Slooter AJC, van der Kooi AW, et al. (2017) Functional connectivity and network analysis during hypoactive delirium and recovery from anesthesia. Clin Neurophysiol 128: 914-924. doi: 10.1016/j.clinph.2017.02.022
|
| [18] |
Schelter B, Timmer J, Eichler M (2009) Assessing the strength of directed influences among neural signals using renormalized partial directed coherence. J Neurosci Methods 179: 121-130. doi: 10.1016/j.jneumeth.2009.01.006
|
| [19] |
Sommerlade L, Thiel M, Mader M, et al. (2015) Assessing the strength of directed influences among neural signals: An approach to noisy data. J Neurosci Methods 239: 47-64. doi: 10.1016/j.jneumeth.2014.09.007
|
| [20] |
Granger CWJ (1969) Investigating causal relations by econometric models and cross-spectral methods. Econometrica 37: 424-438. doi: 10.2307/1912791
|
| [21] |
Stam CJ, van Straaten ECW (2012) Go with the flow: Use of a directed phase lag index (dPLI) to characterize patterns of phase relations in a large-scale model of brain dynamics. Neuroimage 62: 1415-1428. doi: 10.1016/j.neuroimage.2012.05.050
|
| [22] |
Guevara R, Velazquez JLP, Nenadovic V, et al. (2005) Phase synchronization measurements using electroencephalographic recordings: What can we really say about neuronal synchrony? Neuroinformatics 3: 301-314. doi: 10.1385/NI:3:4:301
|
| [23] |
Hillebrand A, Tewarie P, van Dellen E, et al. (2016) Direction of information flow in large-scale resting-state networks is frequency-dependent. Proc Natl Acad Sci 113: 3867-3872. doi: 10.1073/pnas.1515657113
|
| [24] |
Lee H, Mashour GA, Noh GJ, et al. (2013) Reconfiguration of network hub structure after propofol-induced unconsciousness. Anesthesiology 119: 1347-1359. doi: 10.1097/ALN.0b013e3182a8ec8c
|
| [25] |
Ku SW, Lee U, Noh GJ, et al. (2011) Preferential inhibition of frontal-to-parietal feedback connectivity is a neurophysiologic correlate of general anesthesia in surgical patients. PLoS One 6: e25155. doi: 10.1371/journal.pone.0025155
|
| [26] |
Lee U, Müller M, Noh GJ, et al. (2011) Dissociable network properties of anesthetic state transitions. Anesthesiology 114: 872-881. doi: 10.1097/ALN.0b013e31821102c9
|
| [27] |
Hudetz A (2009) Cortical disintegration mechanism of anesthetic-induced unconsciousness. Suppressing the Mind USA: Humana Press, 99-125. doi: 10.1007/978-1-60761-462-3_5
|
| [28] | Pal D, Silverstein BH, Sharba L, et al. (2017) Propofol, sevoflurane, and ketamine induce a reversible increase in Delta-Gamma and Theta-Gamma phase-amplitude coupling in frontal cortex of rat. Front Syst Neurosci 11: 41. |
| [29] |
Seifert HA, Blouin RT, Conard PF, et al. (1993) Sedative doses of propofol increase beta activity of the processed electroencephalogram. Anesth Analg 76: 976-978. doi: 10.1213/00000539-199305000-00010
|
| [30] |
Brown KE, Mirrakhimov AE, Yeddula K, et al. (2013) Propofol and the risk of delirium: exploring the anticholinergic properties of propofol. Med Hypotheses 81: 536-539. doi: 10.1016/j.mehy.2013.06.027
|
| [31] |
Klimesch W (1999) EEG alpha and theta oscillations reflect cognitive and memory performance: A review and analysis. Brain Res Rev 29: 169-195. doi: 10.1016/S0165-0173(98)00056-3
|
| [32] |
Cassani R, Estarellas M, San-Martin R, et al. (2018) Systematic review on resting-state EEG for Alzheimer's disease diagnosis and progression assessment. Dis Markers 2018: 5174815. doi: 10.1155/2018/5174815
|
| [33] |
Engels MMA, Stam CJ, van der Flier WM, et al. (2015) Declining functional connectivity and changing hub locations in Alzheimer's disease: An EEG study. BMC Neurol 15: 145. doi: 10.1186/s12883-015-0400-7
|
| [34] |
van der Kooi AW, Zaal IJ, Klijn FA, et al. (2015) Delirium detection using EEG. Chest 147: 94-101. doi: 10.1378/chest.13-3050
|
 neurosci-07-01-001-s001.pdf neurosci-07-01-001-s001.pdf |
 |

Figures(4) / Tables(1)

Andrew Hunter, Barry Crouch, Nigel Webster, Bettina Platt. Delirium screening in the intensive care unit using emerging QEEG techniques: A pilot study[J]. AIMS Neuroscience, 2020, 7(1): 1-16. doi: 10.3934/Neuroscience.2020001


 DownLoad: