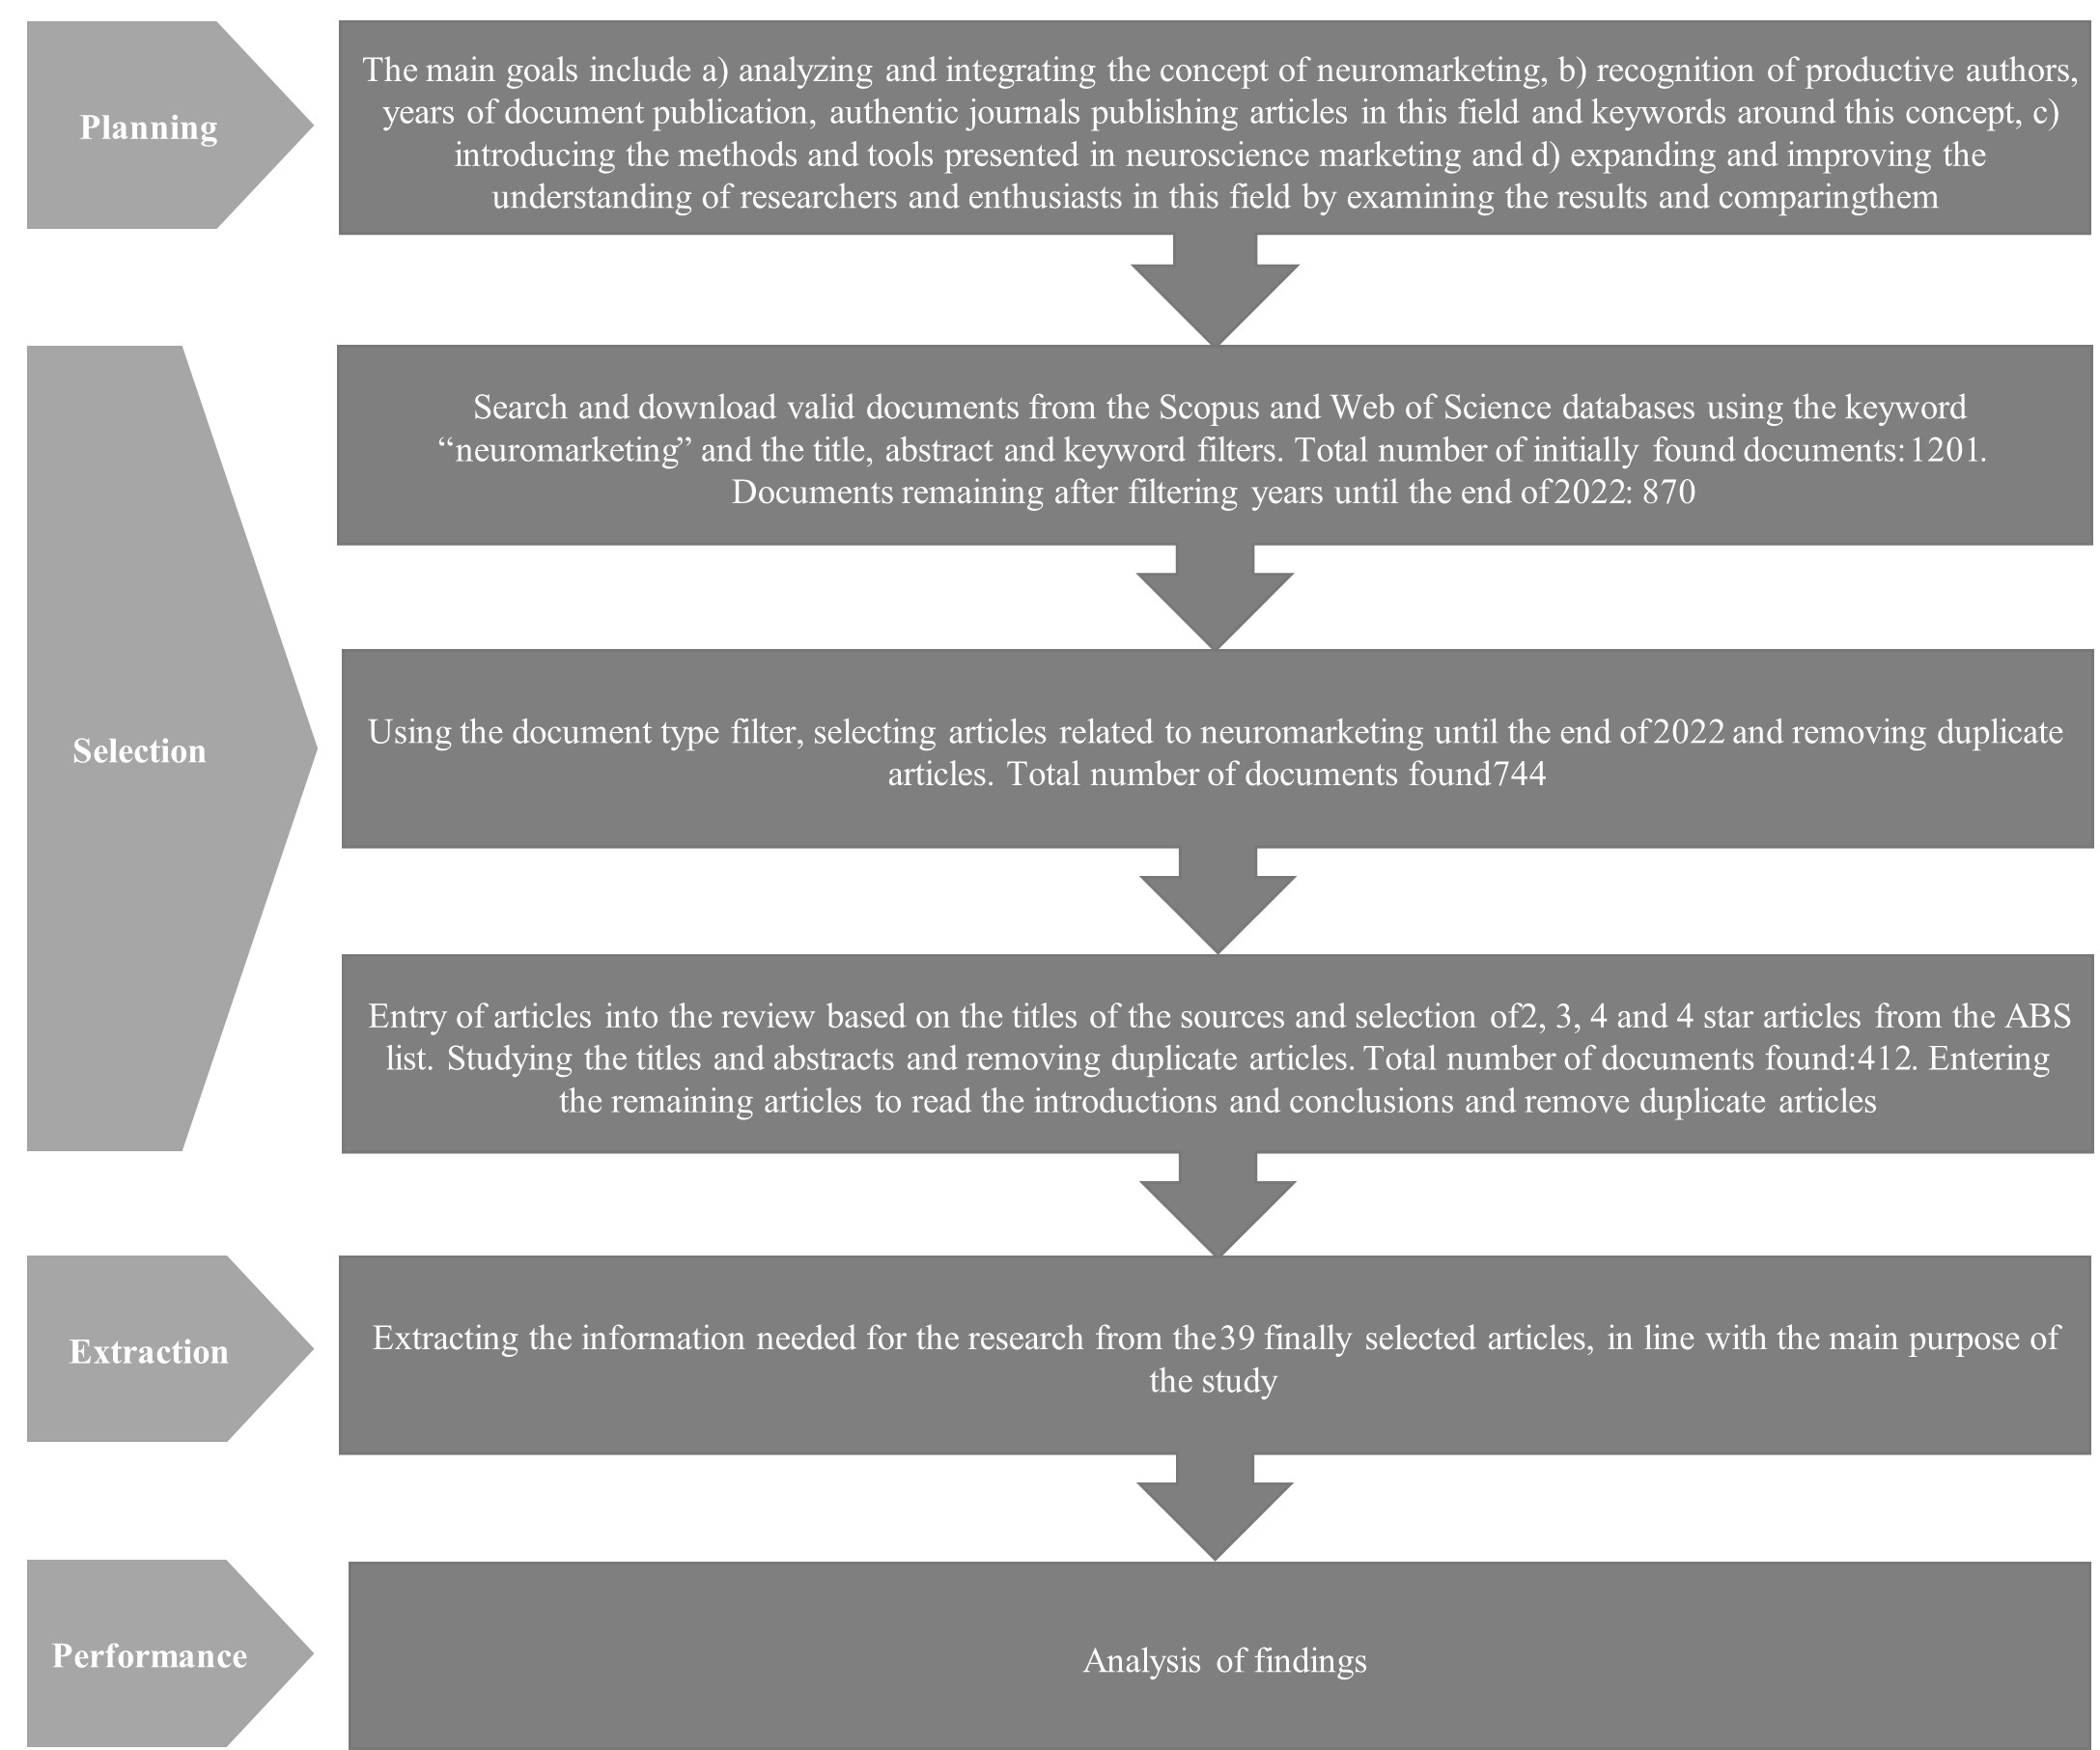
Unlike traditional marketing methods, neuromarketing has shown new insights and higher prediction accuracy. This research uses the bibliometric method to analyze the objectives like the analysis and integration of the green concept of neuromarketing, recognition of the useful authors, the years of publication of documents, authoritative journals that publish articles in this field and keywords around the concept of neuromarketing. The tools presented in neuromarketing expand and improve the perception of the enthusiasts and researchers in this field, and it compares the results obtained from different approaches. From the methodological point of view, this research is qualitative and based on
The findings are presented in two phases. In the first phase, the performance analysis, the share of the annual production of neuromarketing documents, the percentage of the production of authoritative quarterly journals of this field, the share of the output of related subject areas, the share of the countries' published articles and the share of the documents by productive authors were identified and studied. Also, knowledge maps were drawn in the second phase, and 17 clusters are found, including 109 items and 131 keywords. The theoretical contribution of this article consists of the field of green neuromarketing, which is categorized into four clusters with themes of sustainability and green consumption. The results of this study were obtained based on the framework of theory, context, method, antecedents, decisions, and outcomes. All the keywords related to neuromarketing were categorized from the analysis of the previous articles and its features were studied in the proposed model.
Citation: Negin Sangari, Payvand Mirzaeian Khamseh, Shib Sankar Sana. Green concept of neuromarketing based on a systematic review using the bibliometric method[J]. Green Finance, 2023, 5(3): 392-430. doi: 10.3934/GF.2023016
Unlike traditional marketing methods, neuromarketing has shown new insights and higher prediction accuracy. This research uses the bibliometric method to analyze the objectives like the analysis and integration of the green concept of neuromarketing, recognition of the useful authors, the years of publication of documents, authoritative journals that publish articles in this field and keywords around the concept of neuromarketing. The tools presented in neuromarketing expand and improve the perception of the enthusiasts and researchers in this field, and it compares the results obtained from different approaches. From the methodological point of view, this research is qualitative and based on
The findings are presented in two phases. In the first phase, the performance analysis, the share of the annual production of neuromarketing documents, the percentage of the production of authoritative quarterly journals of this field, the share of the output of related subject areas, the share of the countries' published articles and the share of the documents by productive authors were identified and studied. Also, knowledge maps were drawn in the second phase, and 17 clusters are found, including 109 items and 131 keywords. The theoretical contribution of this article consists of the field of green neuromarketing, which is categorized into four clusters with themes of sustainability and green consumption. The results of this study were obtained based on the framework of theory, context, method, antecedents, decisions, and outcomes. All the keywords related to neuromarketing were categorized from the analysis of the previous articles and its features were studied in the proposed model.

| [1] |
Adebayo TS (2023) Trade‐off between environmental sustainability and economic growth through coal consumption and natural resources exploitation in China: New policy insights from wavelet local multiple correlation. Geol J 58: 1384–1400. https://doi.org/10.1002/gj.4664 doi: 10.1002/gj.4664

|
| [2] |
Adil S, Lacoste-Badie S, Droulers O (2018) Face presence and gaze direction in print advertisements: how they influence consumer responses—an eye-tracking study. J Advertising Res 58: 443–455. https://doi.org/10.2501/JAR-2018-004 doi: 10.2501/JAR-2018-004
|
| [3] |
Akhter S, Pauyo T, Khan M (2019) What is the difference between a systematic review and a meta-analysis? Basic methods handbook for clinical orthopaedic research: a practical guide and case-based research approach, 331–342. https://doi.org/10.1007/978-3-662-58254-1_37 doi: 10.1007/978-3-662-58254-1_37
|
| [4] |
Aly E, Elsawah S, Ryan MJ (2022) A review and catalogue to the use of models in enabling the achievement of sustainable development goals (SDG). J Clean Prod 340: 130803. https://doi.org/10.1016/j.jclepro.2022.130803 doi: 10.1016/j.jclepro.2022.130803
|
| [5] |
Bakalash T, Riemer H (2013) Exploring ad-elicited emotional arousal and memory for the ad using fMRI. J Advert 42: 275–291. https://doi.org/10.1080/00913367.2013.768065 doi: 10.1080/00913367.2013.768065
|
| [6] |
Baldo D, Viswanathan VS, Timpone, RJ, et al. (2022) The heart, brain, and body of marketing: complementary roles of neurophysiological measures in tracking emotions, memory, and ad effectiveness. Psyc Mark 39: 1979–1991. https://doi.org/10.1002/mar.21697 doi: 10.1002/mar.21697
|
| [7] |
Bandari R, Moallemi EA, Lester RE, et al. (2022) Prioritising Sustainable Development Goals, characterising interactions, and identifying solutions for local sustainability. Env Sci Pol 127: 325–336. https://doi.org/10.1016/j.envsci.2021.09.016 doi: 10.1016/j.envsci.2021.09.016
|
| [8] |
Bergamaschi M, Randerson K (2016) The futures of family businesses and the development of corporate social responsibility. Futures 75: 54–65. https://doi.org/10.1016/j.futures.2015.10.006 doi: 10.1016/j.futures.2015.10.006
|
| [9] |
Berkman ET, Falk EB (2013) Beyond brain mapping: Using neural measures to predict real-world outcomes. Curr Direc Psych Sci 22: 45–50. https://doi.org/10.1177/0963721412469394 doi: 10.1177/0963721412469394
|
| [10] |
Biglari S, Beiglary S, Arthanari T (2022) Achieving sustainable development goals: Fact or Fiction?. J Clean Prod 332: 130032. https://doi.org/10.1016/j.jclepro.2021.130032 doi: 10.1016/j.jclepro.2021.130032
|
| [11] |
Cahn BR, Delorme A, Polich J (2013) Occipital gamma activation during vipassana meditation. Cogn Proces 14: 393–406. https://doi.org/10.1007/s10339-009-0352-1 doi: 10.1007/s10339-009-0352-1
|
| [12] |
Cakir MP, Çakar T, Girisken Y, et al. (2018) An investigation of the neural correlates of purchase behavior through fNIRS. Eur J Mark 52: 224–243. https://doi.org/10.1108/EJM-12-2016-0864 doi: 10.1108/EJM-12-2016-0864
|
| [13] |
Carroll AB (2016) Carroll's pyramid of CSR: Taking another look. Int J Corp Soc Res 1: 1–8. https://doi.org/10.1186/s40991-016-0004-6 doi: 10.1186/s40991-016-0004-6
|
| [14] |
Chang L, Tsao DY, Liu T (2021) Distributed representation of visual objects by single neurons in macaque visual cortex. Nat Commun 12: 1–13. https://doi.org/10.1523/JNEUROSCI.1958-14.2015 doi: 10.1038/s41467-020-20314-w
|
| [15] |
Chen JE, Glover GH (2021) Advances in BOLD fMRI methodology. Tren Cogn Sci 25: 511–527. https://doi.org/10.1016/j.tics.2017.09.010 doi: 10.1016/j.tics.2017.09.010
|
| [16] |
Cheng Y, Yang CY, Lin CP, et al. (2008) The perception of pain in others suppresses somatosensory oscillations: a magnetoencephalography study. Neuroimage 40: 1833–1840. https://doi.org/10.1016/j.neuroimage.2008.01.064 doi: 10.1016/j.neuroimage.2008.01.064
|
| [17] |
Ćirović M, Dimitriadis N, Janić M, et al. (2022) More than words: Rethinking sustainability communications through neuroscientific methods. J Cons Behav. https://doi.org/10.1002/cb.2125 doi: 10.1002/cb.2125
|
| [18] |
Clark KR, Leslie KR, Garcia-Garcia M, et al. (2018) How advertisers can keep mobile users engaged and reduce video-ad blocking: Best practices for video-ad placement and delivery based on consumer neuroscience measures. J Adv Res 58: 311–325. https://doi.org/10.2501/JAR-2018-036 doi: 10.2501/JAR-2018-036
|
| [19] |
Daugherty T, Hoffman E, Kennedy K, et al. (2018) Measuring consumer neural activation to differentiate cognitive processing of advertising: Revisiting Krugman. Eur J Mark 52: 182–198. https://doi.org/10.1108/EJM-10-2017-0657 doi: 10.1108/EJM-10-2017-0657
|
| [20] | de Oliveira JHC, Giraldi JDME (2017) What is neuromarketing? A proposal for a broader and more accurate definition. Glob Bus Manage Res 9: 19–29. Available from: http://gbmrjournal.com/pdf/vol.%209%20no.%202/V9N2-2.pdf |
| [21] | de Oliveira L, Prado JW (2021) Emotion and advertising effectiveness: A facial analysis study. Int J Adv 40: 455–472. Available from: http://www.gbmrjournal.com/pdf/vol.%209%20no.%202/V9N2-2.pdf |
| [22] |
De Vries EL, Fennis BM, Bijmolt TH, et al. (2018) Friends with benefits: Behavioral and fMRI studies on the effect of friendship reminders on self-control for compulsive and non-compulsive buyers. Int J Res Mark 35: 336–358. https://doi.org/10.1016/j.ijresmar.2017.12.004 doi: 10.1016/j.ijresmar.2017.12.004
|
| [23] |
Donthu N, Kumar S, Pandey N, et al. (2021) Mapping the electronic word-of-mouth (eWOM) research: A systematic review and bibliometric analysis. J Bus Res 135: 758–773. https://doi.org/10.1016/j.jbusres.2021.07.015 doi: 10.1016/j.jbusres.2021.07.015
|
| [24] |
Farooq O, Rupp DE, Farooq M (2017) The multiple pathways through which internal and external corporate social responsibility influence organizational identification and multifoci outcomes: The moderating role of cultural and social orientations. Acad Manage J 60: 954–985. https://doi.org/10.5465/amj.2014.0849 doi: 10.5465/amj.2014.0849
|
| [25] | Figner B, Murphy RO, Siegel P (2019) Measuring electrodermal activity and its applications in judgment and decision-making research, In: A Handbook of Process Tracing Methods, Routledge, 161–183. https://doi.org/10.4324/9781315160559-12 |
| [26] |
Foroudi P, Akarsu TN, Marvi R, et al. (2021) Intellectual evolution of social innovation: A bibliometric analysis and avenues for future research trends. Ind Mark Manage 93: 446–465. https://doi.org/10.1016/j.indmarman.2020.03.026 doi: 10.1016/j.indmarman.2020.03.026
|
| [27] |
Fortunato VCR, Giraldi JDME, de Oliveira JHC (2014) A review of studies on neuromarketing: Practical results, techniques, contributions and limitations. J Manage Res 6: 201–220. https://doi.org/10.5296/jmr.v6i2.5446 doi: 10.5296/jmr.v6i2.5446
|
| [28] |
Frederick DP (2022) Recent Trends in Neuro marketing–An Exploratory Study. Int J Case Stud Bus IT Edu. (IJCSBE), 6: 38–60. https://doi.org/10.47992/IJCSBE.2581.6942.0148 doi: 10.47992/IJCSBE.2581.6942.0148
|
| [29] |
Garczarek-Bąk U, Szymkowiak A, Gaczek P, et al. (2021) A comparative analysis of neuromarketing methods for brand purchasing predictions among young adults. J Brand Manage 28: 171–185. https://doi.org/10.1057/s41262-020-00221-7 doi: 10.1057/s41262-020-00221-7
|
| [30] | Gazzaniga MS, Ivry RB, Mangun GR (2021) Cognitive neuroscience: The Biology of the Mind (5th ed.), W. W. Norton & Company. Available from: https://www.amazon.com/Cognitive-Neuroscience-Biology-Mind-Fifth/dp/0393603172 |
| [31] |
Ghaffar A, Islam T (2023) Factors leading to sustainable consumption behavior: an empirical investigation among millennial consumers. Kyber. https://doi.org/10.1108/K-12-2022-1675 doi: 10.1108/K-12-2022-1675
|
| [32] |
Gómez-Carmona D, Marín-Dueñas PP, Tenorio RC, et al. (2022) Environmental concern as a moderator of information processing: A fMRI study. J Clean Prod 369: 133306. https://doi.org/10.1016/j.jclepro.2022.133306 doi: 10.1016/j.jclepro.2022.133306
|
| [33] |
Gountas J, Gountas S, Ciorciari J, et al. (2019) Looking beyond traditional measures of advertising impact: Using neuroscientific methods to evaluate social marketing messages. J Bus Res105: 121–135. https://doi.org/10.1016/j.jbusres.2019.07.011 doi: 10.1016/j.jbusres.2019.07.011
|
| [34] |
Hakim A, Klorfeld S, Sela T, et al. (2021) Machines learn neuromarketing: Improving preference prediction from self-reports using multiple EEG measures and machine learning. Int J Res Mark 38: 770–791. https://doi.org/10.1016/j.ijresmar.2020.10.005 doi: 10.1016/j.ijresmar.2020.10.005
|
| [35] |
Hakimi N, Shahbakhti M, Sappia S, et al. (2022) Estimation of respiratory rate from functional near-infrared spectroscopy (fNIRS): A new perspective on respiratory interference. Bios 12: 1170. https://doi.org/10.3390/bios12121170 doi: 10.3390/bios12121170
|
| [36] | Halkiopoulos C, Antonopoulou H, Gkintoni E, et al. (2022) Neuromarketing as an indicator of cognitive consumer behavior in decision-making process of tourism destination—An overview, In: Transcending Borders in Tourism Through Innovation and Cultural Heritage: 8th International Conference, IACuDiT, Hydra, Greece, 2021, Cham: Springer International Publishing, 679–697. https://doi.org/10.1007/978-3-030-92491-1_41 |
| [37] |
Hamelin N, Thaichon P, Abraham C, et al. (2020) Story telling, the scale of persuasion and retention: A neuromarketing approach. J Retail Cons Serv 55: 102099. https://doi.org/10.1016/j.jretconser.2020.102099 doi: 10.1016/j.jretconser.2020.102099
|
| [38] |
Holmqvist K, Örbom SL, Hooge IT, et al. (2023) Eye tracking: empirical foundations for a minimal reporting guideline. Behav Res Method 55: 364–416. https://doi.org/10.3758/s13428-021-01762-8 doi: 10.3758/s13428-021-01762-8
|
| [39] |
Hsu M (2017) Neuromarketing: inside the mind of the consumer. Calif Manage Rev 59: 5–22. https://doi.org/10.1177/0008125617720208 doi: 10.1177/0008125617720208
|
| [40] |
Hsu MYT, Cheng JMS (2018) fMRI neuromarketing and consumer learning theory: word-of-mouth effectiveness after product harm crisis. Eur J Mark 52: 199–223. https://doi.org/10.1108/EJM-12-2016-0866 doi: 10.1108/EJM-12-2016-0866
|
| [41] |
Iden J, Methlie LB, Christensen GE (2017) The Nature of Strategic Foresight Research: A Systematic Literature Review. Technol Forecast Social Change 116: 87–97. https://doi.org/10.1016/j.techfore.2006.10.001 doi: 10.1016/j.techfore.2016.11.002
|
| [42] |
Jai TM, Fang D, Bao FS, et al. (2021) Seeing it is like touching it: Unraveling the effective product presentations on online apparel purchase decisions and brain activity (An fMRI Study). J Int Mark 53: 66–79. https://doi.org/10.1016/j.intmar.2020.04.005 doi: 10.1016/j.intmar.2020.04.005
|
| [43] |
Kansra P, Oberoi S, Gupta SL, et al. (2022) Factors limiting the application of consumer neuroscience: A systematic review. J Cons Behav. https://doi.org/10.1002/cb.2131 doi: 10.1002/cb.2131
|
| [44] | Khashei V, Harandi AO (2015) Explaining strategic control model in weight industry: discourse exploration using grounded theory strategy. J Strat Manage Stud 6: 81–80. |
| [45] |
Keles HO, Karakulak EZ, Hanoglu L, et al. (2022) Screening for Alzheimer's disease using prefrontal resting-state functional near-infrared spectroscopy. Front Hum Neur 16: 1061668. https://doi.org/10.3389/fnhum.2022.1061668 doi: 10.3389/fnhum.2022.1061668
|
| [46] |
Kirschstein T, Köhling R (2009) What is the source of the EEG? Clin. EEG Neur 40: 146–149. https://doi.org/10.1177/155005940904000305 doi: 10.1177/155005940904000305
|
| [47] |
Knutson B, Genevsky A (2018) Neuroforecasting aggregate choice. Curr Direct Psych Sci 27: 110–115. https://doi.org/10.1177/0963721417737877 doi: 10.1177/0963721417737877
|
| [48] |
Kolar T, Batagelj Z, Omeragić I, et al. (2021) How moment-to-moment EEG measures enhance ad effectiveness evaluation: Peak emotions during branding moments as key indicators. J Adv Res 61: 365–381. https://doi.org/10.2501/JAR-2021-014 doi: 10.2501/JAR-2021-014
|
| [49] |
Krampe C, Strelow E, Haas A, et al. (2018) The application of mobile fNIRS to "shopper neuroscience"–first insights from a merchandising communication study. Eur J Mark 52: 244–259. https://doi.org/10.1108/EJM-12-2016-0727 doi: 10.1108/EJM-12-2016-0727
|
| [50] |
Kumar B, Sharma A, Vatavwala S, et al. (2020) Digital mediation in business-to-business marketing: A bibliometric analysis. Ind Mark Manage 85: 126–140. https://doi.org/10.1016/j.indmarman.2019.10.002 doi: 10.1016/j.indmarman.2019.10.002
|
| [51] |
Le TT (2023) The association of corporate social responsibility and sustainable consumption and production patterns: The mediating role of green supply chain management. J Clean Prod 414: 137435. https://doi.org/10.1016/j.jclepro.2023.137435 doi: 10.1016/j.jclepro.2023.137435
|
| [52] |
Lee EJ, Kwon G, Shin HJ, et al. (2014) The spell of green: Can frontal EEG activations identify green consumers? J Bus Eth 122: 511–521. https://doi.org/10.1007/s10551-013-1775-2 doi: 10.1007/s10551-013-1775-2
|
| [53] |
Lee N, Brandes L, Chamberlain L, et al. (2017).This is your brain on neuromarketing: Reflections on a decade of research. J Mark Manage 33: 878–892. https://doi.org/10.1080/0267257X.2017.1327249 doi: 10.1080/0267257X.2017.1327249
|
| [54] |
Lee N, Broderick AJ, Chamberlain L (2007) What is 'neuromarketing'? A discussion and agenda for future research. Int J Psych 63: 199–204. https://doi.org/10.1016/j.ijpsycho.2006.03.007 doi: 10.1016/j.ijpsycho.2006.03.007
|
| [55] |
Lee N, Chamberlain L, Brandes L (2018) Welcome to the jungle! The neuromarketing literature through the eyes of a newcomer. Eur J Mark 52: 4–38. https://doi.org/10.1108/EJM-02-2017-0122 doi: 10.1108/EJM-02-2017-0122
|
| [56] |
Levallois C, Smidts A, Wouters P (2021) The emergence of neuromarketing investigated through online public communications (2002–2008). Bus Hist 63: 443–466. https://doi.org/10.1080/00076791.2019.1579194 doi: 10.1080/00076791.2019.1579194
|
| [57] | Li SZ, Jain AK, Huang T, et al. (2005) Face recognition applications. Hand Face Recog, 371–390. |
| [58] |
Lim WM (2018) Demystifying neuromarketing. J Bus Res 91: 205–220. https://doi.org/10.1016/j.jbusres.2018.05.036 doi: 10.1016/j.jbusres.2018.05.036
|
| [59] |
Lim WM, Yap SF, Makkar M (2021) Home sharing in marketing and tourism at a tipping point: What do we know, how do we know, and where should we be heading? J Bus Res 122: 534–566. https://doi.org/10.1016/j.jbusres.2020.08.051 doi: 10.1016/j.jbusres.2020.08.051
|
| [60] |
Liu Y, Zhao R, Xiong X, et al. (2023) A Bibliometric analysis of consumer neuroscience towards sustainable consumption. Behav Sci 13: 298–315. https://doi.org/10.3390/bs13040298 doi: 10.3390/bs13040298
|
| [61] |
Luna-Nevarez C (2021) Neuromarketing, ethics, and regulation: An exploratory analysis of consumer opinions and sentiment on blogs and social media. J Cons Pol 44: 559–583. https://doi.org/10.1007/s10603-021-09496-y doi: 10.1007/s10603-021-09496-y
|
| [62] |
Mariani MM, Al-Sultan K, De Massis A (2023). Corporate social responsibility in family firms: A systematic literature review. J Small Bus Manage 61: 1192–1246. https://doi.org/10.1080/00472778.2021.1955122 doi: 10.1080/00472778.2021.1955122
|
| [63] |
Marzouk OA, Mahrous AA (2020) Sustainable consumption behavior of energy and water-efficient products in a resource-constrained environment. J Glob Mark 33: 335–353. https://doi.org/10.1080/08911762.2019.1709005 doi: 10.1080/08911762.2019.1709005
|
| [64] |
McDonald MA, Tayebi M, McGeown JP, et al. (2022) A window into eye movement dysfunction following mTBI: a scoping review of magnetic resonance imaging and eye tracking findings. Brain Behav 12: e2714. https://doi.org/10.1002/brb3.2714 doi: 10.1002/brb3.2714
|
| [65] |
Meyerding SG, Mehlhose CM (2020) Can neuromarketing add value to the traditional marketing research? An exemplary experiment with functional near-infrared spectroscopy (fNIRS). J Bus Res 107: 172–185. https://doi.org/10.1016/j.jbusres.2018.10.052 doi: 10.1016/j.jbusres.2018.10.052
|
| [66] |
Mishra S, Malhotra G, Chatterjee R, et al. (2021) Impact of self-expressiveness and environmental commitment on sustainable consumption behavior: The moderating role of fashion consciousness. J Strat Mark, 1–23. https://doi.org/10.1080/0965254X.2021.1892162 doi: 10.1080/0965254X.2021.1892162
|
| [67] |
Motoki K, Sugiura M, Kawashima R (2019). Common neural value representations of hedonic and utilitarian products in the ventral stratum: An fMRI study. Sci Rep 9: 1–10. https://doi.org/10.1038/s41598-019-52159-9 doi: 10.1038/s41598-018-37186-2
|
| [68] |
Motoki K, Suzuki S, Kawashima R, et al. (2020) A combination of self-reported data and social-related neural measures forecasts viral marketing success on social media. J Interact Mark 52: 99–117. https://doi.org/10.1016/j.intmar.2020.06.003 doi: 10.1016/j.intmar.2020.06.003
|
| [69] |
Murphy ER, Illes J, Reiner PB (2008) Neuroethics of neuromarketing. J Cons Behav An Int Res Rev 7: 293–302. https://doi.org/10.1002/cb.252 doi: 10.1002/cb.252
|
| [70] |
Nasir O, Javed RT, Gupta S, et al. (2023) Artificial intelligence and sustainable development goals nexus via four vantage points. Techn Soc 72: 102171. https://doi.org/10.1016/j.techsoc.2022.102171 doi: 10.1016/j.techsoc.2022.102171
|
| [71] |
Negrete-Cardoso M, Rosano-Ortega G, Álvarez-Aros EL, et al. (2022) Circular economy strategy and waste management: A bibliometric analysis in its contribution to sustainable development, toward a post-COVID-19 era. Env Sci Poll Res 29: 61729–61746. https://doi.org/10.1007/s11356-022-18703-3 doi: 10.1007/s11356-022-18703-3
|
| [72] |
Nemorin S (2017) Neuromarketing and the "poor in world" consumer: how the animalization of thinking underpins contemporary market research discourses. Cons Mark Cult 20: 59–80. https://doi.org/10.1080/10253866.2016.1160897 doi: 10.1080/10253866.2016.1160897
|
| [73] | Nilashi M, Samad S, Ahmadi N, et al. (2020). Neuromarketing: a review of research and implications for marketing. J Soft Comp Dec Supp Sys 7: 23–31. |
| [74] |
Oliveira PM, Guerreiro J, Rita P (2022) Neuroscience research in consumer behavior: A review and future research agenda. Int J Cons Stud 46: 2041–2067. https://doi.org/10.1111/ijcs.12800 doi: 10.1111/ijcs.12800
|
| [75] |
Pagan NM, Pagan KM, Teixeira AA, et al. (2020) Application of neuroscience in the area of sustainability: Mapping the territory. Glob J Flex Sys Manage 21: 61–77. https://doi.org/10.1007/s40171-020-00243-9 doi: 10.1007/s40171-020-00243-9
|
| [76] |
Paul J, Benito GRG (2018) A review of research on outward foreign direct investment from emerging countries, including China: what do we know, how do we know and where should we be heading? Asia Pac Bus Rev 24: 90–115. https://doi.org/10.1080/13602381.2017.1357316 doi: 10.1080/13602381.2017.1357316
|
| [77] |
Paul J, Parthasarathy S, Gupta P (2017) Exporting challenges of SMEs: A review and future research agenda. J World Bus 52: 327–342. https://doi.org/10.1016/j.jwb.2017.01.003 doi: 10.1016/j.jwb.2017.01.003
|
| [78] |
Pérez-Martínez J, Hernandez-Gil F, San Miguel G, et al. (2023) Analysing associations between digitalization and the accomplishment of the Sustainable Development Goals. Sci Total Env 857: 159700. https://doi.org/10.1016/j.scitotenv.2022.159700 doi: 10.1016/j.scitotenv.2022.159700
|
| [79] |
Piracci G, Casini L, Contini C, et al. (2023) Identifying key attributes in sustainable food choices: An analysis using the food values framework. J Clean Prod 416: 137924. https://doi.org/10.1016/j.jclepro.2023.137924 doi: 10.1016/j.jclepro.2023.137924
|
| [80] |
Plassmann H, Venkatraman V, Huettel S, et al. (2015) Consumer neuroscience: applications, challenges, and possible solutions. J Mark Res 52: 427–435.https://doi.org/10.1509/jmr.14.0048 doi: 10.1509/jmr.14.0048
|
| [81] |
Powers A, Fani N, Murphy L, et al. (2019) Attention bias toward threatening faces in women with PTSD: Eye tracking correlates by symptom cluster. Eur J Psy 10: 1568133. https://doi.org/10.1080/20008198.2019.1568133 doi: 10.1080/20008198.2019.1568133
|
| [82] |
Qananwah Q, Alqudah AM, Alodat MD, et al. (2022) Detecting cognitive features of videos using EEG signal. Comp J 65: 105–123. https://doi.org/10.1093/comjnl/bxaa180 doi: 10.1093/comjnl/bxaa180
|
| [83] |
Qasim MS, Bari DS, Martinsen ØG (2022) Influence of ambient temperature on tonic and phasic electrodermal activity components. Phys Meas 43: 065001. https://doi.org/10.1088/1361-6579/ac72f4 doi: 10.1088/1361-6579/ac72f4
|
| [84] |
Qazi A, Simsekler MCE, Al-Mhdawi MKS (2023) Exploring network-based dependencies between country-level sustainability and business risks. J Clean Prod 418: 138161. https://doi.org/10.1016/j.jclepro.2023.138161 doi: 10.1016/j.jclepro.2023.138161
|
| [85] |
Ramsøy TZ (2019) Building a foundation for neuromarketing and consumer neuroscience research: How researchers can apply academic rigor to the neuroscientific study of advertising effects. J Adv Res 59: 281–294.https://doi.org/10.2501/JAR-2019-034 doi: 10.2501/JAR-2019-034
|
| [86] |
Rana IA, Khaled S, Jamshed A, Nawaz A (2022) Social protection in disaster risk reduction and climate change adaptation: A bibliometric and thematic review. J Integ Env Sci 19: 65–83. https://doi.org/10.1080/1943815X.2022.2108458 doi: 10.1080/1943815X.2022.2108458
|
| [87] |
Rawnaque FS, Rahman K M, Anwar SF, et al. (2020). Technological advancements and opportunities in neuromarketing: a systematic review. Brain Inf 7: 1–19.https://doi.org/10.1186/s40708-020-00109-x doi: 10.1186/s40708-020-0102-9
|
| [88] |
Reilly RG, Peelle JE (2021) The left inferior frontal gyrus is sensitive to individual differences in reading comprehension ability: An eye-tracking study. PLoS One 16: e0245897. https://doi.org/10.1371/journal.pone.0245897 doi: 10.1371/journal.pone.0245897
|
| [89] |
Savelli E, Gregory‐Smith D, Murmura F, et al. (2022) How to communicate typical–local foods to improve food tourism attractiveness. Psy. Mark 39: 1350–1369. https://doi.org/10.1002/mar.21668 doi: 10.1002/mar.21668
|
| [90] |
Shen F, Morris JD (2016) Decoding neural responses to emotion in television commercials: an integrative study of self-reporting and fMRI measures. J Adv Res 56: 193–204. https://doi.org/10.2501/JAR-2016-016 doi: 10.2501/JAR-2016-016
|
| [91] |
Singh J, Goyal G, Gill R (2020) Use of neurometrics to choose optimal advertisement method for omnichannel business. Ent Inf Sys 14: 243–265. https://doi.org/10.1080/17517575.2019.1640392 doi: 10.1080/17517575.2019.1640392
|
| [92] |
Silva M (2015) A systematic review of Foresight in Project Management literature. Proc Comp Sci 64: 792–799. https://doi.org/10.1016/j.procs.2015.08.630 doi: 10.1016/j.procs.2015.08.630
|
| [93] |
Smidts A, Hsu M, Sanfey AG, et al. (2014) Advancing consumer neuroscience. Mark Lett 25: 257–267. https://doi.org/10.1007/s11002-014-9306-1 doi: 10.1007/s11002-014-9306-1
|
| [94] |
Solnais C, Andreu-Perez J, Sánchez-Fernández J, et al. (2013) The contribution of neuroscience to consumer research: A conceptual framework and empirical review. J Econ Psy 36: 68–81. https://doi.org/10.1016/j.joep.2013.02.011 doi: 10.1016/j.joep.2013.02.011
|
| [95] |
Stanton SJ, Sinnott-Armstrong W, Huettel SA (2017) Neuromarketing: Ethical implications of its use and potential misuse. J Bus Eth 144: 799–811. https://doi.org/10.1007/s10551-016-3059-0 doi: 10.1007/s10551-016-3059-0
|
| [96] |
Stillman P, Lee H, Deng X, et al. (2020) Examining consumers' sensory experiences with color: A consumer neuroscience approach. Psy Mark 37: 995–1007. https://doi.org/10.1002/mar.21360 doi: 10.1002/mar.21360
|
| [97] |
Varan D, Lang A, Barwise P, et al. (2015) How reliable are neuromarketers' measures of advertising effectiveness? Data from ongoing research holds no common truth among vendors. J Adv Res 55: 176–191. https://doi.org/10.2501/JAR-55-2-176-191 doi: 10.2501/JAR-55-2-176-191
|
| [98] | Vyas S, Seal A (2022) A deep convolution neural networks framework for analyzing electroencephalography signals in neuromarketing, In: Proceedings of International Conference on Frontiers in Computing and Systems: COMSYS 2021. Singapore: Springer Nature Singapore, 119–127. https://doi.org/10.1007/978-981-19-0105-8_12 |
| [99] |
Wajid A, Raziq MM, Ahmed QM, et al. (2021) Observing viewers' self-reported and neurophysiological responses to message appeal in social media advertisements. J Retail Cons Serv 59: 102373. https://doi.org/10.1016/j.jretconser.2020.102373 doi: 10.1016/j.jretconser.2020.102373
|
| [100] |
Wei Q, Lv D, Lin Y, et al. (2023) Influence of utilitarian and hedonic attributes on willingness to pay green product premiums and neural mechanisms in China: An ERP study. Sustainability 15: 2403. https://doi.org/10.3390/su15032403 doi: 10.3390/su15032403
|
| [101] | WTO (2023) Available from: https://www.wto.org/english/forums_e/public_forum23_e/public_forum23_e.htm |
| [102] |
Xu Z, Wang X, Wang X, et al. (2021) A comprehensive bibliometric analysis of entrepreneurship and crisis literature published from 1984 to 2020. J Bus Res 135: 304–318. https://doi.org/10.1016/j.jbusres.2021.06.051 doi: 10.1016/j.jbusres.2021.06.051
|
| [103] |
Yuan J, Zhang Y, Zhao Y, et al. (2023) The emotion-regulation benefits of implicit reappraisal in clinical depression: Behavioral and electrophysiological evidence. Neur Bull 39: 973–983. https://doi.org/10.1007/s12264-022-00973-z doi: 10.1007/s12264-022-00973-z
|
| [104] |
Zhang Y, Bian Y, Wu H, et al. (2023) Intuition or rationality: Impact of critical thinking dispositions on the cognitive processing of creative information. Thin Skills Create 48: 101278. https://doi.org/10.1016/j.tsc.2023.101278 doi: 10.1016/j.tsc.2023.101278
|
| [105] |
Zhao M (2022) The impact of cognitive conflict on product-service system value cocreation: An event-related potential perspective. J Clean Prod 331: 129987. https://doi.org/10.1016/j.jclepro.2021.129987 doi: 10.1016/j.jclepro.2021.129987
|
| [106] |
Zhu Z, Jin Y, Su Y, et al. (2022). Evaluation of the neuromarketing research trend: 2010–2021. Front Psyc 13: 872468. https://doi.org/10.3389/fpsyg.2022.872468 doi: 10.3389/fpsyg.2022.872468
|


Figures(28)

Negin Sangari, Payvand Mirzaeian Khamseh, Shib Sankar Sana. Green concept of neuromarketing based on a systematic review using the bibliometric method[J]. Green Finance, 2023, 5(3): 392-430. doi: 10.3934/GF.2023016


 DownLoad: