Citation: Ryan Anthony J. de Belen, Huyen Nguyen, Daniel Filonik, Dennis Del Favero, Tomasz Bednarz. A systematic review of the current state of collaborative mixed reality technologies: 2013–2018[J]. AIMS Electronics and Electrical Engineering, 2019, 3(2): 181-223. doi: 10.3934/ElectrEng.2019.2.181

| [1] | Dey A, Billinghurst M, Lindeman RW, et al. (2018) A Systematic Review of 10 Years of Augmented Reality Usability Studies: 2005 to 2014. Frontiers in Robotics and AI 5. |
| [2] |
Bai Z, Blackwell AF (2012) Analytic review of usability evaluation in ISMAR. Interact Comput 24: 450–460. doi: 10.1016/j.intcom.2012.07.004

|
| [3] | Dünser A, Grasset R, Billinghurst M (2008) A survey of evaluation techniques used in augmented reality studies. Human Interface Technology Laboratory New Zealand. |
| [4] | Swan JE, Gabbard JL (2005) Survey of user-based experimentation in augmented reality. In: Proceedings of 1st International Conference on Virtual Reality 22: 1–9. |
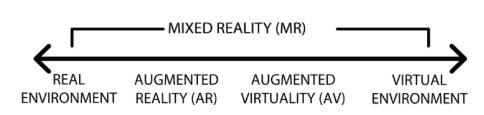
| [5] | Milgram P, Kishino F (1994) A taxonomy of mixed reality visual displays. IEICE Transactions on Information and Systems 77: 1321–1329. |
| [6] | Azuma RT (1997) A survey of augmented reality. Presence: Teleoperators & Virtual Environments 6: 355–385. |
| [7] |
Milgram P, Takemura H, Utsumi A, et al. (1995) Augmented reality: A class of displays on the reality-virtuality continuum. Telemanipulator and Telepresence Technologies 2351: 282–293. International Society for Optics and Photonics. doi: 10.1117/12.197321
|
| [8] | Irizarry J, Gheisari M, Williams G, et al. (2013) InfoSPOT: A mobile Augmented Reality method for accessing building information through a situation awareness approach. Automat Constr 33: 11–23. |
| [9] |
Ibáñez MB, Di Serio Á, Villarán D, et al. (2014) Experimenting with electromagnetism using augmented reality: Impact on flow student experience and educational effectiveness. Comput Educ 71: 1–13. doi: 10.1016/j.compedu.2013.09.004
|
| [10] |
Henderson S, Feiner S (2011) Exploring the benefits of augmented reality documentation for maintenance and repair. IEEE transactions on visualization and computer graphics 17: 1355–1368. doi: 10.1109/TVCG.2010.245
|
| [11] | Dow S, Mehta M, Harmon E, et al. (2007) Presence and engagement in an interactive drama. In: Proceedings of the SIGCHI Conference on Human Factors in Computing Systems, pp. 1475–1484, ACM. |
| [12] | Billinghurst M, Kato H (1999) Collaborative mixed reality. In: Proceedings of the First International Symposium on Mixed Reality, pp. 261–284, Berlin: Springer Verlag. |
| [13] | Wang X, Dunston PS (2006) Groupware concepts for augmented reality mediated human-to-human collaboration. In: Proceedings of the 23rd Joint International Conference on Computing and Decision Making in Civil and Building Engineering, pp. 1836–1842. |
| [14] | Brockmann T, Krüger N, Stieglitz S, et al. (2013) A Framework for Collaborative Augmented Reality Applications. In 19th Americas Conference on Information Systems (AMCIS). |
| [15] | Renevier P, Nigay L (2001) Mobile collaborative augmented reality: the augmented stroll. In: IFIP International Conference on Engineering for Human-Computer Interaction, pp. 299–316, Springer, Berlin, Heidelberg. |
| [16] |
Arias E, Eden H, Fischer G, et al. (2000) Transcending the individual human mind-creating shared understanding through collaborative design. ACM Transactions on Computer-Human Interaction 7: 84–113. doi: 10.1145/344949.345015
|
| [17] | Kim S, Billinghurst M, Lee GA (2018) The Effect of Collaboration Styles and View Independence on Video-Mediated Remote Collaboration. Computer Supported Cooperative Work (CSCW) 27: 569–607. |
| [18] | Cabral M, Roque G, Nagamura M, et al. (2016) Batmen-Hybrid collaborative object manipulation using mobile devices. In: 2016 IEEE Symposium on3D User Interfaces (3DUI), pp. 275–276. |
| [19] | Reilly D, Salimian M, MacKay B, et al. (2014) SecSpace: prototyping usable privacy and security for mixed reality collaborative environments. In: Proceedings of the 2014 ACM SIGCHI symposium on Engineering interactive computing systems, pp. 273–282. |
| [20] | Lin T-H, Liu C-H, Tsai M-H, et al. (2014) Using augmented reality in a multiscreen environment for construction discussion. J Comput Civil Eng 29: 04014088. |
| [21] |
Hollenbeck JR, Ilgen DR, Sego DJ, et al. (1995) Multilevel theory of team decision making: Decision performance in teams incorporating distributed expertise. Journal of Applied Psychology 80: 292–316. doi: 10.1037/0021-9010.80.2.292
|
| [22] |
Lightle JP, Kagel JH, Arkes HR (2009) Information exchange in group decision making: The hidden profile problem reconsidered. Manage Sci 55: 568–581. doi: 10.1287/mnsc.1080.0975
|
| [23] | Gül LF, Uzun C, Halıcı SM (2017) Studying Co-design. In: International Conference on Computer-Aided Architectural Design Futures, pp. 212–230. |
| [24] |
Al-Hammad A, Assaf S, Al-Shihah M (1997) The effect of faulty design on building maintenance. Journal of Quality in Maintenance Engineering 3: 29–39. doi: 10.1108/13552519710161526
|
| [25] | Casarin J, Pacqueriaud N, Bechmann D (2018) UMI3D: A Unity3D Toolbox to Support CSCW Systems Properties in Generic 3D User Interfaces. Proceedings of the ACM on Human-Computer Interaction 2: 29. |
| [26] | Coppens A, Mens T (2018) Towards Collaborative Immersive Environments for Parametric Modelling. In: International Conference on Cooperative Design, Visualization and Engineering, pp. 304–307, Springer. |
| [27] | Cortés-Dávalos A, Mendoza S (2016) Layout planning for academic exhibits using Augmented Reality. In: 2016 13th International Conference on Electrical Engineering, Computing Science and Automatic Control (CCE), pp. 1–6, IEEE. |
| [28] | Croft BL, Lucero C, Neurnberger D, et al. (2018) Command and Control Collaboration Sand Table (C2-CST). In: International Conference on Virtual, Augmented and Mixed Reality, pp. 249–259, Springer. |
| [29] |
Dong S, Behzadan AH, Chen F, et al. (2013) Collaborative visualization of engineering processes using tabletop augmented reality. Adv Eng Softw 55: 45–55. doi: 10.1016/j.advengsoft.2012.09.001
|
| [30] | Elvezio C, Ling F, Liu J-S, et al. (2018) Collaborative exploration of urban data in virtual and augmented reality. In: ACM SIGGRAPH 2018 Virtual, Augmented, and Mixed Reality, p. 10, ACM. |
| [31] | Etzold J, Grimm P, Schweitzer J, et al. (2014) kARbon: a collaborative MR web application for communicationsupport in construction scenarios. In: Proceedings of the companion publication of the 17th ACM conference on Computer supported cooperative work & social computing, pp. 9–12, ACM. |
| [32] | Flotyński J, Sobociński P (2018) Semantic 4-dimensionai modeling of VR content in a heterogeneous collaborative environment. In: Proceedings of the 23rd International ACM Conference on 3D Web Technology, p. 11, ACM. |
| [33] | Ibayashi H, Sugiura Y, Sakamoto D, et al. (2015) Dollhouse vr: a multi-view, multi-user collaborative design workspace with vr technology. SIGGRAPH Asia 2015 Emerging Technologies, p. 8, ACM. |
| [34] | Leon M, Doolan DC, Laing R, et al. (2015) Development of a Computational Design Application for Interactive Surfaces. In: 2015 19th International Conference on Information Visualisation, pp. 506–511, IEEE. |
| [35] |
Li WK, Nee AYC, Ong SK (2018) Mobile augmented reality visualization and collaboration techniques for on-site finite element structural analysis. International Journal of Modeling, Simulation, and Scientific Computing 9: 1840001. doi: 10.1142/S1793962318400019
|
| [36] | Nittala AS, Li N, Cartwright S, et al. (2015) PLANWELL: spatial user interface for collaborative petroleum well-planning. In: SIGGRAPH Asia 2015 Mobile Graphics and Interactive Applications, p. 19, ACM. |
| [37] | Phan T, Hönig W, Ayanian N (2018) Mixed Reality Collaboration Between Human-Agent Teams. In: 2018 IEEE Conference on Virtual Reality and 3D User Interfaces (VR), pp. 659–660. |
| [38] | Rajeb SB, Leclercq P (2013) Using spatial augmented reality in synchronous collaborative design. In: International Conference on Cooperative Design, Visualization and Engineering, pp. 1–10, Springer. |
| [39] | Ro H, Kim I, Byun J, et al. (2018) PAMI: Projection Augmented Meeting Interface for Video Conferencing. In: 2018 ACM Multimedia Conference on Multimedia Conference, pp. 1274–1277, ACM. |
| [40] | Schattel D, Tönnis M, Klinker G, et al. (2014) On-site augmented collaborative architecture visualization. In: 2014 IEEE International Symposium on Mixed and Augmented Reality (ISMAR), pp. 369–370. |
| [41] | Shin JG, Ng G, Saakes D (2018) Couples Designing their Living Room Together: a Study with Collaborative Handheld Augmented Reality. In: Proceedings of the 9th Augmented Human International Conference, p. 3, acm. |
| [42] |
Singh AR, Delhi VSK (2018) User behaviour in AR-BIM-based site layout planning. International Journal of Product Lifecycle Management 11: 221–244. doi: 10.1504/IJPLM.2018.094715
|
| [43] | Trout TT, Russell S, Harrison A, et al. (2018) Collaborative mixed reality (MxR) and networked decision making. In: Next-Generation Analyst VI 10653: 106530N. International Society for Optics and Photonics. |
| [44] | Alhumaidan H, Lo KPY, Selby A (2017) Co-designing with children a collaborative augmented reality book based on a primary school textbook. International Journal of Child-Computer Interaction 15: 24–36. |
| [45] | Alhumaidan H, Lo KPY, Selby A (2015) Co-design of augmented reality book for collaborative learning experience in primary education. In: 2015 SAI Intelligent Systems Conference (IntelliSys), pp. 427–430, IEEE. |
| [46] | Benavides X, Amores J, Maes P (2015) Invisibilia: revealing invisible data using augmented reality and internet connected devices. In: Adjunct Proceedings of the 2015 ACM International Joint Conference on Pervasive and Ubiquitous Computing and Proceedings of the 2015 ACM International Symposium on Wearable Computers, pp. 341–344, ACM. |
| [47] |
Blanco-Fernández Y, López-Nores M, Pazos-Arias JJ, et al. (2014) REENACT: A step forward in immersive learning about Human History by augmented reality, role playing and social networking. Expert Syst Appl 41: 4811–4828. doi: 10.1016/j.eswa.2014.02.018
|
| [48] | Boyce MW, Rowan CP, Baity DL, et al. (2017) Using Assessment to Provide Application in Human Factors Engineering to USMA Cadets. In: International Conference on Augmented Cognition, pp. 411–422, Springer. |
| [49] |
Bressler DM, Bodzin AM (2013) A mixed methods assessment of students' flow experiences during a mobile augmented reality science game. Journal of Computer Assisted Learning 29: 505–517. doi: 10.1111/jcal.12008
|
| [50] | Chen M, Fan C, Wu D (2016) Designing Effective Materials and Activities for Mobile Augmented Learning. In: International Conference on Blended Learning, pp. 85–93, Springer. |
| [51] | Daiber F, Kosmalla F, Krüger A (2013) BouldAR: using augmented reality to support collaborative boulder training. In: CHI' 13 Extended Abstracts on Human Factors in Computing Systems, pp. 949–954, ACM. |
| [52] | Desai K, Belmonte UHH, Jin R, et al. (2017) Experiences with Multi-Modal Collaborative Virtual Laboratory (MMCVL). In: 2017 IEEE Third International Conference on Multimedia Big Data (BigMM), pp. 376–383, IEEE. |
| [53] | Fleck S, Simon G (2013) An augmented reality environment for astronomy learning in elementary grades: An exploratory study. In: Proceedings of the 25th Conference on I'Interaction Homme-Machine, p. 14, ACM. |
| [54] | Gazcón N, Castro S (2015) ARBS: An Interactive and Collaborative System for Augmented Reality Books. In: International Conference on Augmented and Virtual Reality, pp. 89–108, Springer. |
| [55] | Gelsomini F, Kanev K, Hung P, et al. (2017) BYOD Collaborative Kanji Learning in Tangible Augmented Reality Settings. In: International Conference on Global Research and Education, pp. 315–325, Springer. |
| [56] | Gironacci IM, Mc-Call R, Tamisier T (2017) Collaborative Storytelling Using Gamification and Augmented Reality. In: International Conference on Cooperative Design, Visualization and Engineering, pp. 90–93, Springer. |
| [57] | Goyal S, Vijay RS, Monga C, et al. (2016) Code Bits: An Inexpensive Tangible Computational Thinking Toolkit For K-12 Curriculum. In: Proceedings of the TEI'16: Tenth International Conference on Tangible, Embedded, and Embodied Interaction, pp. 441–447, ACM. |
| [58] | Greenwald SW (2015) Responsive Facilitation of Experiential Learning Through Access to Attentional State. In: Adjunct Proceedings of the 28th Annual ACM Symposium on User Interface Software & Technology, pp. 1–4, ACM. |
| [59] |
Han J, Jo M, Hyun E, et al. (2015) Examining young children's perception toward augmented reality-infused dramatic play. Educational Technology Research and Development 63: 455–474. doi: 10.1007/s11423-015-9374-9
|
| [60] |
Iftene A, Trandabăț D (2018) Enhancing the Attractiveness of Learning through Augmented Reality. Procedia Computer Science 126: 166–175. doi: 10.1016/j.procs.2018.07.220
|
| [61] | Jyun-Fong G, Ju-Ling S (2013) The Instructional Application of Augmented Reality in Local History Pervasive Game. pp. 387. |
| [62] | Kang S, Norooz L, Oguamanam V, et al. (2016) SharedPhys: Live Physiological Sensing, Whole-Body Interaction, and Large-Screen Visualizations to Support Shared Inquiry Experiences. In: Proceedings of the The 15th International Conference on Interaction Design and Children, pp. 275–287, ACM. |
| [63] | Kazanidis I, Palaigeorgiou G, Papadopoulou Α, et al. (2018) Augmented Interactive Video: Enhancing Video Interactivity for the School Classroom. Journal of Engineering Science and Technology Review 11. |
| [64] | Keifert D, Lee C, Dahn M, et al. (2017) Agency, Embodiment, & Affect During Play in a Mixed-Reality Learning Environment. In: Proceedings of the 2017 Conference on Interaction Design and Children, pp. 268–277, ACM. |
| [65] |
Kim H-J, Kim B-H (2018) Implementation of young children English education system by AR type based on P2P network service model. Peer-to-Peer Networking and Applications 11: 1252–1264. doi: 10.1007/s12083-017-0612-2
|
| [66] | Krstulovic R, Boticki I, Ogata H (2017) Analyzing heterogeneous learning logs using the iterative convergence method. In: 2017 IEEE 6th International Conference on Teaching, Assessment, and Learning for Engineering, pp. 482–485. |
| [67] | Le TN, Le YT, Tran MT (2014) Applying Saliency-Based Region of Interest Detection in Developing a Collaborative Active Learning System with Augmented Reality. In: International Conference on Virtual, Augmented and Mixed Reality, pp. 51–62, Springer. |
| [68] | MacIntyre B, Zhang D, Jones R, et al. (2016) Using projection ar to add design studio pedagogy to a cs classroom. In: 2016 IEEE Virtual Reality (VR), pp. 227–228. |
| [69] | Malinverni L, Valero C, Schaper MM, et al. (2018) A conceptual framework to compare two paradigms of augmented and mixed reality experiences. In: Proceedings of the 17th ACM Conference on Interaction Design and Children, pp. 7–18, ACM. |
| [70] | Maskott GK, Maskott MB, Vrysis L (2015) Serious+: A technology assisted learning space based on gaming. In: 2015 International Conference on Interactive Mobile Communication Technologies and Learning (IMCL), pp. 430–432, IEEE. |
| [71] | Pareto L (2012) Mathematical literacy for everyone using arithmetic games. In: Proceedings of the 9th International Conference on Disability, Virtual Reality and Associated Technologies 9: 87–96. Reading, UK: University of Readings. |
| [72] | Peters E, Heijligers B, de Kievith J, et al. (2016) Design for collaboration in mixed reality: Technical challenges and solutions. In: 2016 8th International Conference on Games and Virtual Worlds for Serious Applications (VS-GAMES), pp. 1–7, IEEE. |
| [73] | Punjabi DM, Tung LP, Lin BSP (2013) CrowdSMILE: a crowdsourcing-based social and mobile integrated system for learning by exploration. In: 2013 IEEE 10th International Conference on Ubiquitous Intelligence and Computing and 2013 IEEE 10th International Conference on Autonomic and Trusted Computing, pp. 521–526. |
| [74] | Rodríguez-Vizzuett L, Pérez-Medina JL, Muñoz-Arteaga J, et al. (2015) Towards the Definition of a Framework for the Management of Interactive Collaborative Learning Applications for Preschoolers. In: Proceedings of the XVI International Conference on Human Computer Interaction, p. 11, ACM. |
| [75] | Sanabria JC, Arámburo-Lizárraga J (2017) Enhancing 21st Century Skills with AR: Using the Gradual Immersion Method to develop Collaborative Creativity. Eurasia Journal of Mathematics, Science and Technology Education 13: 487–501. |
| [76] |
Shaer O, Valdes C, Liu S, et al. (2014) Designing reality-based interfaces for experiential bio-design. Pers Ubiquit Comput 18: 1515–1532. doi: 10.1007/s00779-013-0752-1
|
| [77] | Shirazi A, Behzadan AH (2015) Content Delivery Using Augmented Reality to Enhance Students' Performance in a Building Design and Assembly Project. Advances in Engineering Education 4. |
| [78] | Shirazi A, Behzadan AH (2013) Technology-enhanced learning in construction education using mobile context-aware augmented reality visual simulation. In: 2013 Winter Simulations Conference (WSC), pp. 3074–3085, IEEE. |
| [79] | Sun H, Liu Y, Zhang Z, et al. (2018) Employing Different Viewpoints for Remote Guidance in a Collaborative Augmented Environment. In: Proceedings of the Sixth International Symposium of Chinese CHI, pp. 64–70, ACM. |
| [80] | Sun H, Zhang Z, Liu Y, et al. (2016) OptoBridge: assisting skill acquisition in the remote experimental collaboration. In: Proceedings of the 28th Australian Conference on Computer-Human Interaction, pp. 195–199, ACM. |
| [81] | Thompson B, Leavy L, Lambeth A, et al. (2016) Participatory Design of STEM Education AR Experiences for Heterogeneous Student Groups: Exploring Dimensions of Tangibility, Simulation, and Interaction. In: 2016 IEEE International Symposium on Mixed and Augmented Reality (ISMAR-Adjunct), pp. 53–58. |
| [82] | Wiehr F, Kosmalla F, Daiber F, et al. (2016) betaCube: Enhancing Training for Climbing by a Self-Calibrating Camera-Projection Unit. In: Proceedings of the 2016 CHI Conference Extended Abstracts on Human Factors in Computing Systems, pp. 1998–2004, ACM. |
| [83] | Yangguang L, Yue L, Xiaodong W (2014) Multiplayer collaborative training system based on Mobile AR innovative interaction technology. In: 2014 International Conference on Virtual Reality and Visualization, pp. 81–85, IEEE. |
| [84] | Yoon SA, Wang J, Elinich K (2014) Augmented reality and learning in science museums. Digital Systems for Open Access to Formal and Informal Learning, pp. 293–305, Springer. |
| [85] |
Zubir F, Suryani I, Ghazali N (2018) Integration of Augmented Reality into College Yearbook. In: MATEC Web of Conferences 150: 05031. EDP Sciences. doi: 10.1051/matecconf/201815005031
|
| [86] | Dascalu MI, Moldoveanu A, Shudayfat EA (2014) Mixed reality to support new learning paradigms. In: 2014 8th International Conference on System Theory, Control and Computing (ICSTCC), pp. 692–697, IEEE. |
| [87] | Boonbrahm P, Kaewrat C, Boonbrahm S (2016) Interactive Augmented Reality: A New Approach for Collaborative Learning. In: International Conference on Learning and Collaboration Technologies, pp. 115–124, Springer. |
| [88] | LaViola Jr JJ, Kruijff E, McMahan RP, et al. (2017) 3D user interfaces: theory and practice. Addison-Wesley Professional. |
| [89] | Kim S, Lee GA, Sakata N (2013) Comparing pointing and drawing for remote collaboration. In: 2013 IEEE International Symposium on Mixed and Augmented Reality (ISMAR), pp. 1–6, IEEE. |
| [90] | Akahoshi S, Matsushita M (2018) Magical Projector: Virtual Object Sharing Method among Multiple Users in a Mixed Reality Space. In: 2018 Nicograph International (NicoInt), pp. 70–73, IEEE. |
| [91] | Baillard C, Fradet M, Alleaume V, et al. (2017) Multi-device mixed reality TV: a collaborative experience with joint use of a tablet and a headset. In: Proceedings of the 23rd ACM Symposium on Virtual Reality Software and Technology, p. 67, ACM. |
| [92] | Baldauf M, Fröhlich P (2013) The augmented video wall: multi-user AR interaction with public displays. In: CHI'13 Extended Abstracts on Human Factors in Computing Systems, pp. 3015–3018, ACM. |
| [93] | Ballagas R, Dugan TE, Revelle G, et al. (2013) Electric agents: fostering sibling joint media engagement through interactive television and augmented reality. In: Proceedings of the 2013 conference on Computer supported cooperative work, pp. 225–236, ACM. |
| [94] | Beimler R, Bruder G, Steinicke F (2013) Smurvebox: A smart multi-user real-time virtual environment for generating character animations. In: Proceedings of the Virtual Reality International Conference: Laval Virtual, p. 1, ACM. |
| [95] | Bollam P, Gothwal E, Tejaswi V G, et al. (2015) Mobile collaborative augmented reality with real-time AR/VR switching. In: ACM SIGGRAPH 2015 Posters, p. 25, ACM. |
| [96] | Bourdin P, Sanahuja JMT, Moya CC, et al. (2013) Persuading people in a remote destination to sing by beaming there. In: Proceedings of the 19th ACM Symposium on Virtual Reality Software and Technology, pp. 123–132, ACM. |
| [97] | Brondi R, Avveduto G, Alem L, et al. (2015) Evaluating the effects of competition vs collaboration on user engagement in an immersive game using natural interaction. In: Proceedings of the 21st ACM Symposium on Virtual Reality Software and Technology, p. 191, ACM. |
| [98] | Ch'ng E, Harrison D, Moore S (2017) Shift-life interactive art: Mixed-reality artificial ecosystem simulation. Presence: Teleoperators & Virtual Environments 26: 157–181. |
| [99] |
Courchesne L, Durand E, Roy B (2014) Posture platform and the drawing room: virtual teleportation in cyberspace. Leonardo 47: 367–374. doi: 10.1162/LEON_a_00842
|
| [100] | Dal Corso A, Olsen M, Steenstrup KH, et al. (2015) VirtualTable: a projection augmented reality game. In: SIGGRAPH Asia 2015 Posters, p. 40, ACM. |
| [101] | Datcu D, Lukosch S, Lukosch H (2016) A Collaborative Game to Study Presence and Situational Awareness in a Physical and an Augmented Reality Environment. J Univers Comput Sci 22: 247–270. |
| [102] | Datcu D, Lukosch SG, Lukosch HK (2014) A collaborative game to study the perception of presence during virtual co-location. In: Proceedings of the companion publication of the 17th ACM conference on Computer supported cooperative work & social computing, pp. 5–8, ACM. |
| [103] | Figueroa P, Hernández JT, Merienne F, et al. (2018) Heterogeneous, distributed mixed reality Applications. A concept. In: 2018 IEEE Conference on Virtual Reality and 3D User Interfaces (VR), pp. 549–550. |
| [104] | Fischbach M, Lugrin J-L, Brandt M, et al. (2018) Follow the White Robot-A Role-Playing Game with a Robot Game Master. In: Proceedings of the 17th International Conference on Autonomous Agents and MultiAgent Systems, pp. 1812–1814. |
| [105] | Fischbach M, Striepe H, Latoschik ME, et al. (2016) A low-cost, variable, interactive surface for mixed-reality tabletop games. In: Proceedings of the 22nd ACM Conference on Virtual Reality Software and Technology, pp. 297–298, ACM. |
| [106] | Günther S, Müller F, Schmitz M, et al. (2018) CheckMate: Exploring a Tangible Augmented Reality Interface for Remote Interaction. In: Extended Abstracts of the 2018 CHI Conference on Human Factors in Computing Systems, p. LBW570, ACM. |
| [107] | Huo K, Wang T, Paredes L, et al. (2018) SynchronizAR: Instant Synchronization for Spontaneous and Spatial Collaborations in Augmented Reality. In: Proceedings of the 31st Annual ACM Symposium on User Interface Software and Technology, pp. 19–30, ACM. |
| [108] | Karakottas A, Papachristou A, Doumanoqlou A, et al. (2018) Augmented VR. In: 2018 IEEE Conference on Virtual Reality and 3D User Interfaces (VR), pp. 18–22, IEEE. |
| [109] | Lantin M, Overstall SL, Zhao H (2018) I am afraid: voice as sonic sculpture. In: ACM SIGGRAPH 2018 Posters, pp. 1–2, ACM. |
| [110] | Loviska M, Krause O, Engelbrecht HA, et al. (2016) Immersed gaming in Minecraft. In: Proceedings of the 7th International Conference on Multimedia Systems, p. 32, ACM. |
| [111] | Mackamul EB, Esteves A (2018) A Look at the Effects of Handheld and Projected Augmented-reality on a Collaborative Task. In: Proceedings of the Symposium on Spatial User Interaction, pp. 74–78, ACM. |
| [112] |
Margolis T, Cornish T (2013) Vroom: designing an augmented environment for remote collaboration in digital cinema production. In: The Engineering Reality of Virtual Reality 2013 8649: 86490F. International Society for Optics and Photonics. doi: 10.1117/12.2008587
|
| [113] | McGill M, Williamson JH, Brewster SA (2016) Examining the role of smart TVs and VR HMDs in synchronous at-a-distance media consumption. ACM T Comput-Hum Int 23: 33. |
| [114] | Mechtley B, Stein J, Roberts C, et al. (2017) Rich State Transitions in a Media Choreography Framework Using an Idealized Model of Cloud Dynamics. In: Proceedings of the onThematic Workshops of ACM Multimedia 2017, pp. 477–484, ACM. |
| [115] | Pillias C, Robert-Bouchard R, Levieux G (2014) Designing tangible video games: lessons learned from the sifteo cubes. In: Proceedings of the SIGCHI Conference on Human Factors in Computing Systems, pp. 3163–3166, ACM. |
| [116] | Podkosova I, Kaufmann H (2018) Co-presence and proxemics in shared walkable virtual environments with mixed collocation. In: Proceedings of the 24th ACM Symposium on Virtual Reality Software and Technology, pp. 21, ACM. |
| [117] | Prins MJ, Gunkel SN, Stokking HM, et al. (2018) TogetherVR: A framework for photorealistic shared media experiences in 360-degree VR. SMPTE Motion Imag J 127: 39–44. |
| [118] | Rostami A, Bexell E, Stanisic S (2018) The Shared Individual. In: Proceedings of the Twelfth International Conference on Tangible, Embedded, and Embodied Interaction, pp. 511–516, ACM. |
| [119] | Sato T, Hwang DH, Koike H (2018) MlioLight: Projector-camera Based Multi-layered Image Overlay System for Multiple Flashlights Interaction. In: Proceedings of the 2018 ACM International Conference on Interactive Surfaces and Spaces, pp. 263–271, ACM. |
| [120] | Spielmann S, Schuster A, Götz K, et al. (2016) VPET: a toolset for collaborative virtual filmmaking. In: SIGGRAPH ASIA 2016 Technical Briefs, p. 29, ACM. |
| [121] | Trottnow J, Götz K, Seibert S, et al. (2015) Intuitive virtual production tools for set and light editing. In: Proceedings of the 12th European Conference on Visual Media Production, p. 6, ACM. |
| [122] | Valverde I, Cochrane T (2017) Senses Places: soma-tech mixed-reality participatory performance installation/environment. In: Proceedings of the 8th International Conference on Digital Arts, pp. 195–197, ACM. |
| [123] | Van Troyer A (2013) Enhancing site-specific theatre experience with remote partners in sleep no more. In: Proceedings of the 2013 ACM International workshop on Immersive media experiences, pp. 17–20, ACM. |
| [124] | Vermeer J, Alaka S, de Bruin N, et al. (2018) League of lasers: a superhuman sport using motion tracking. In: Proceedings of the First Superhuman Sports Design Challenge on First International Symposium on Amplifying Capabilities and Competing in Mixed Realities, p. 8, ACM. |
| [125] | Wegner K, Seele S, Buhler H, et al. (2017) Comparison of Two Inventory Design Concepts in a Collaborative Virtual Reality Serious Game. In: Extended Abstracts Publication of the Annual Symposium on Computer-Human Interaction in Play, pp. 323–329, ACM. |
| [126] | Zhou Q, Hagemann G, Fels S, et al. (2018) Coglobe: a co-located multi-person FTVR experience. In: ACM SIGGRAPH 2018 Emerging Technologies, p. 5, ACM. |
| [127] | Zimmerer C, Fischbach M, Latoschik ME (2014) Fusion of Mixed-Reality Tabletop and Location-Based Applications for Pervasive Games. In: Proceedings of the Ninth ACM International Conference on Interactive Tabletops and Surfaces, pp. 427–430, ACM. |
| [128] | Speicher M, Hall BD, Yu A, et al. (2018) XD-AR: Challenges and Opportunities in Cross-Device Augmented Reality Application Development. Proceedings of the ACM on Human-Computer Interaction 2: 7. |
| [129] | Gauglitz S, Nuernberger B, Turk M, et al. (2014) World-stabilized annotations and virtual scene navigation for remote collaboration. In: Proceedings of the 27th Annual ACM symposium on User interface software and technology, pp. 449–459, ACM. |
| [130] |
Abramovici M, Wolf M, Adwernat S, et al. (2017) Context-aware Maintenance Support for Augmented Reality Assistance and Synchronous Multi-user Collaboration. Procedia CIRP 59: 18–22. doi: 10.1016/j.procir.2016.09.042
|
| [131] | Aschenbrenner D, Li M, Dukalski R, et al. (2018) Collaborative Production Line Planning with Augmented Fabrication. In: 2018 IEEE Conference on Virtual Reality and 3D User Interfaces (VR), pp. 509–510, IEEE. |
| [132] | Bednarz T, James C, Widzyk-Capehart E, et al. (2015) Distributed collaborative immersive virtual reality framework for the mining industry. Machine Vision and Mechatronics in Practice, pp. 39–48, Springer. |
| [133] | Capodieci A, Mainetti L, Alem L (2015) An innovative approach to digital engineering services delivery: An application in maintenance. In: 2015 11th International Conference on Innovations in Information Technology (IIT), pp. 342–349, IEEE. |
| [134] |
Choi SH, Kim M, Lee JY (2018) Situation-dependent remote AR collaborations: Image-based collaboration using a 3D perspective map and live video-based collaboration with a synchronized VR mode. Comput Ind 101: 51–66. doi: 10.1016/j.compind.2018.06.006
|
| [135] | Clergeaud D, Roo JS, Hachet M, et al. (2017) Towards seamless interaction between physical and virtual locations for asymmetric collaboration. In: Proceedings of the 23rd ACM Symposium on Virtual Reality Software and Technology, pp. 1–4, ACM. |
| [136] | Datcu D, Cidota M, Lukosch SG, et al. (2014) Virtual co-location to support remote assistance for inflight maintenance in ground training for space missions. In: Proceedings of the 15th International Conference on Computer Systems and Technologies, pp. 134–141, ACM. |
| [137] | Domova V, Vartiainen E, Englund M (2014) Designing a remote video collaboration system for industrial settings. In: Proceedings of the Ninth ACM International Conference on Interactive Tabletops and Surfaces, pp. 229–238, ACM. |
| [138] | Elvezio C, Sukan M, Oda O, et al. (2017) Remote collaboration in AR and VR using virtual replicas. In: ACM SIGGRAPH 2017 VR Village, p. 13, ACM. |
| [139] | Funk M, Kritzler M, Michahelles F (2017) HoloCollab: A Shared Virtual Platform for Physical Assembly Training using Spatially-Aware Head-Mounted Displays. In: Proceedings of the Seventh International Conference on the Internet of Things, p. 19, ACM. |
| [140] |
Galambos P, Csapó ÁB, Zentay PZ, et al. (2015) Design, programming and orchestration of heterogeneous manufacturing systems through VR-powered remote collaboration. Robotics and Computer-Integrated Manufacturing 33: 68–77. doi: 10.1016/j.rcim.2014.08.012
|
| [141] | Galambos P, Baranyi PZ, Rudas IJ (2014) Merged physical and virtual reality in collaborative virtual workspaces: The VirCA approach. In: IECON 2014 – 40th Annual Conference of the IEEE Industrial Electronics Society, pp. 2585–2590, IEEE. |
| [142] | Gupta RK, Ucler C, Bernard A (2018) Extension of the Virtual Customer Inspection for Distant Collaboration in NPD. In: 2018 IEEE International Conference on Engineering, Technology and Innovation, pp. 1–7. |
| [143] |
Gurevich P, Lanir J, Cohen B (2015) Design and implementation of teleadvisor: a projection-based augmented reality system for remote collaboration. Computer Supported Cooperative Work (CSCW) 24: 527–562. doi: 10.1007/s10606-015-9232-7
|
| [144] | Günther S, Kratz SG, Avrahami D, et al. (2018) Exploring Audio, Visual, and Tactile Cues for Synchronous Remote Assistance. In: Proceedings of the 11th Pervasive Technologies Related to Assistive Environments Conference, pp. 339–344, ACM. |
| [145] | Morosi F, Carli I, Caruso G, et al. (2018) Analysis of Co-Design Scenarios and Activities for the Development of A Spatial-Augmented Reality Design Platform. In: DS 92: Proceedings of the DESIGN 2018 15th International Design Conference, pp. 381–392. |
| [146] | Plopski A, Fuvattanasilp V, Poldi J, et al. (2018) Efficient In-Situ Creation of Augmented Reality Tutorials. In: 2018 Workshop on Metrology for Industry 4.0 and IoT, pp. 7–11, IEEE. |
| [147] | Seo D-W, Lee S-M, Park K-S, et al. (2015) INTEGRATED ENGINEERING PRODUCT DESIGN SIMULATION PLATFORM FOR COLLABORATIVE SIMULATION UNDER THE USER EXPERIENCE OF SME USERS. simulation 1: 2. |
| [148] | Zenati N, Hamidia M, Bellarbi A, et al. (2015) E-maintenance for photovoltaic power system in Algeria. In: 2015 IEEE International Conference on Industrial Technology, pp. 2594–2599. |
| [149] | Zenati N, Benbelkacem S, Belhocine M, et al. (2013) A new AR interaction for collaborative E-maintenance system. IFAC Proceedings Volumes 46: 619–624. |
| [150] | Zenati-Henda N, Bellarbi A, Benbelkacem S, et al. (2014) Augmented reality system based on hand gestures for remote maintenance. In: 2014 International Conference on Multimedia Computing and Systems (ICMCS), pp. 5–8, IEEE. |
| [151] | Huang W, Billinghurst M, Alem L, et al. (2018) HandsInTouch: sharing gestures in remote collaboration. In: Proceedings of the 30th Australian Conference on Computer-Human Interaction, pp. 396–400, ACM. |
| [152] |
Davis MC, Can DD, Pindrik J, et al. (2016) Virtual interactive presence in global surgical education: international collaboration through augmented reality. World neurosurgery 86: 103–111. doi: 10.1016/j.wneu.2015.08.053
|
| [153] | Alharthi SA, Sharma HN, Sunka S, et al. (2018) Designing Future Disaster Response Team Wearables from a Grounding in Practice. In: Proceedings of the Technology, Mind, and Society, p. 1, ACM. |
| [154] | Carbone M, Freschi C, Mascioli S, et al. (2016) A wearable augmented reality platform for telemedicine. In: International Conference on Augmented Reality, Virtual Reality and Computer Graphics, pp. 92–100, Springer. |
| [155] | Elvezio C, Ling F, Liu J-S, et al. (2018) Collaborative Virtual Reality for Low-Latency Interaction. In: The 31st Annual ACM Symposium on User Interface Software and Technology Adjunct Proceedings, pp. 179–181, ACM. |
| [156] | Gillis J, Calyam P, Apperson O, et al. (2016) Panacea's Cloud: Augmented reality for mass casualty disaster incident triage and co-ordination. In: 2016 13th IEEE Annual Consumer Communications & Networking Conference (CCNC), pp. 264–265, IEEE. |
| [157] | Kurillo G, Yang AY, Shia V, et al. (2016) New emergency medicine paradigm via augmented telemedicine. In: 8th International Conference on Virtual, Augmented and Mixed Reality, VAMR 2016 and Held as Part of 18th International Conference on Human-Computer Interaction, HCI International 2016, pp. 502–511, Springer. |
| [158] | Nunes M, Nedel LP, Roesler V (2013) Motivating people to perform better in exergames: Collaboration vs. competition in virtual environments. In: 2013 IEEE Virtual Reality (VR), pp. 115–116, IEEE. |
| [159] | Nunes IL, Lucas R, Simões-Marques M, et al. (2017) Augmented Reality in Support of Disaster Response. In: International Conference on Applied Human Factors and Ergonomics, pp. 155–167, Springer. |
| [160] |
Popescu D, Lăptoiu D, Marinescu R, et al. (2017) Advanced Engineering in Orthopedic Surgery Applications. Key Engineering Materials 752: 99–104. doi: 10.4028/www.scientific.net/KEM.752.99
|
| [161] | Shluzas LA, Aldaz G, Leifer L (2016) Design Thinking Health: Telepresence for Remote Teams with Mobile Augmented Reality. In: Design Thinking Research, pp. 53–66, Springer. |
| [162] |
Sirilak S, Muneesawang P (2018) A New Procedure for Advancing Telemedicine Using the HoloLens. IEEE Access 6: 60224–60233. doi: 10.1109/ACCESS.2018.2875558
|
| [163] | Vassell M, Apperson O, Calyam P, et al. (2016) Intelligent Dashboard for augmented reality based incident command response co-ordination. In: 2016 13th IEEE Annual Consumer Communications & Networking Conference (CCNC), pp. 976–979, IEEE. |
| [164] | Bach B, Sicat R, Beyer J, et al. (2018) The Hologram in My Hand: How Effective is Interactive Exploration of 3D Visualizations in Immersive Tangible Augmented Reality? IEEE Transactions on Visualization & Computer Graphics 24: 457–467. |
| [165] | Daher S (2017) Optical see-through vs. spatial augmented reality simulators for medical applications. In: 2017 IEEE Virtual Reality (VR), pp. 417–418. |
| [166] | Camps-Ortueta I, Rodríguez-Muñoz JM, Gómez-Martín PP, et al. (2017) Combining augmented reality with real maps to promote social interaction in treasure hunts. CoSECivi, pp. 131–143. |
| [167] | Chen H, Lee AS, Swift M, et al. (2015) 3D collaboration method over HoloLens™ and Skype™ end points. In: Proceedings of the 3rd International Workshop on Immersive Media Experiences, pp. 27–30, ACM. |
| [168] | Gleason C, Fiannaca AJ, Kneisel M, et al. (2018) FootNotes: Geo-referenced Audio Annotations for Nonvisual Exploration. Proceedings of the ACM on Interactive, Mobile, Wearable and Ubiquitous Technologies 2: 109. |
| [169] | Huang W, Kaminski B, Luo J, et al. (2015) SMART: design and evaluation of a collaborative museum visiting application. In: 12th International Conference, CDVE 2015 – Cooperative Design, Visualization, and Engineering 12th International Conference 9320: 57–64. |
| [170] | Kallioniemi P, Heimonen T, Turunen M, et al. (2015) Collaborative navigation in virtual worlds: how gender and game experience influence user behavior. In: Proceedings of the 21st ACM Symposium on Virtual Reality Software and Technology, pp. 173–182, ACM. |
| [171] | Li N, Nittala AS, Sharlin E, et al. (2014) Shvil: collaborative augmented reality land navigation. In: CHI'14 Extended Abstracts on Human Factors in Computing Systems, pp. 1291–1296, ACM. |
| [172] | Nuernberger B, Lien K-C, Grinta L, et al. (2016) Multi-view gesture annotations in image-based 3D reconstructed scenes. In: Proceedings of the 22nd ACM Conference on Virtual Reality Software and Technology, pp. 129–138, ACM. |
| [173] | Kallioniemi P, Hakulinen J, Keskinen T, et al. (2013) Evaluating landmark attraction model in collaborative wayfinding in virtual learning environments. In: Proceedings of the 12th International Conference on Mobile and Ubiquitous Multimedia, pp. 1–10, ACM. |
| [174] |
Bork F, Schnelzer C, Eck U, et al. (2018) Towards Efficient Visual Guidance in Limited Field-of-View Head-Mounted Displays. IEEE transactions on visualization and computer graphics 24: 2983–2992. doi: 10.1109/TVCG.2018.2868584
|
| [175] | Sodhi RS, Jones BR, Forsyth D, et al. (2013) BeThere: 3D mobile collaboration with spatial input. In: Proceedings of the SIGCHI Conference on Human Factors in Computing Systems, pp. 179–188, ACM. |
| [176] | Lien K-C, Nuernberger B, Turk M, et al. (2015) [POSTER] 2D-3D Co-segmentation for AR-based Remote Collaboration. In: 2015 IEEE International Symposium on Mixed and Augmented Reality, pp. 184–185, IEEE. |
| [177] | Nuernberger B, Lien K-C, Höllerer T, et al. (2016) Anchoring 2D gesture annotations in augmented reality. In: 2016 IEEE Virtual Reality (VR), pp. 247–248, IEEE. |
| [178] | Nuernberger B, Lien K-C, Höllerer T, et al. (2016) Interpreting 2d gesture annotations in 3d augmented reality. In: 2016 IEEE Symposium on 3D User Interfaces (3DUI), pp. 149–158. |
| [179] |
Kovachev D, Nicolaescu P, Klamma R (2014) Mobile real-time collaboration for semantic multimedia. Mobile Networks and Applications 19: 635–648. doi: 10.1007/s11036-013-0453-z
|
| [180] | You S, Thompson CK (2017) Mobile collaborative mixed reality for supporting scientific inquiry and visualization of earth science data. In: 2017 IEEE Virtual Reality (VR), pp. 241–242. |
| [181] | Wiehr F, Daiber F, Kosmalla F, et al. (2017) ARTopos: augmented reality terrain map visualization for collaborative route planning. In: Proceedings of the 2017 ACM International Joint Conference on Pervasive and Ubiquitous Computing and Proceedings of the 2017 ACM International Symposium on Wearable Computers, pp. 1047–1050, ACM. |
| [182] | Müller J, Rädle R, Reiterer H (2017) Remote Collaboration With Mixed Reality Displays: How Shared Virtual Landmarks Facilitate Spatial Referencing. In: Proceedings of the 2017 CHI Conference on Human Factors in Computing Systems, pp. 6481–6486, ACM. |
| [183] | Park S, Kim J (2018) Augmented Memory: Site-Specific Social Media with AR. In: Proceedings of the 9th Augmented Human International Conference, p. 41, ACM. |
| [184] | Ryskeldiev B, Igarashi T, Zhang J, et al. (2018) Spotility: Crowdsourced Telepresence for Social and Collaborative Experiences in Mobile Mixed Reality. In: Companion of the 2018 ACM Conference on Computer Supported Cooperative Work and Social Computing, pp. 373–376, ACM. |
| [185] | Grandi JG, Berndt I, Debarba HG, et al. (2017) Collaborative manipulation of 3D virtual objects in augmented reality scenarios using mobile devices. In: 2017 IEEE Symposium on 3D User Interfaces (3DUI), pp. 264–265, IEEE. |
| [186] | Cortés-Dávalos A, Mendoza S (2016) AR-based Modeling of 3D Objects in Multi-user Mobile Environments. In: CYTED-RITOS International Workshop on Groupware, pp. 21–36, Springer. |
| [187] | Cortés-Dávalos A, Mendoza S (2016) Augmented Reality-Based Groupware for Editing 3D Surfaces on Mobile Devices. In: 2016 International Conference on Collaboration Technologies and Systems (CTS), pp. 319–326, IEEE. |
| [188] | Zhang W, Han B, Hui P, et al. (2018) CARS: Collaborative Augmented Reality for Socialization. In: Proceedings of the 19th International Workshop on Mobile computing Systems & Applications, pp. 25–30, ACM. |
| [189] | Cortés-Dávalos A, Mendoza S (2016) Collaborative Web Authoring of 3D Surfaces Using Augmented Reality on Mobile Devices. In: 2016 IEEE/WIC/ACM International Conference on Web Intelligence (WI), pp. 640–643, IEEE. |
| [190] | Pani M, Poiesi F (2018) Distributed Data Exchange with Leap Motion. International Conference on Augmented Reality, Virtual Reality, and Computer Graphics, pp. 655–667, Springer. |
| [191] | Grandi JG, Debarba HG, Bemdt I, et al. (2018) Design and Assessment of a Collaborative 3D Interaction Technique for Handheld Augmented Reality. In: 2018 IEEE Conference on Virtual Reality and 3D User Interfaces (VR), pp. 49–56. |
| [192] | Müller J, Rädle R, Reiterer H (2016) Virtual Objects as Spatial Cues in Collaborative Mixed Reality Environments: How They Shape Communication Behavior and User Task Load. In: Proceedings of the 2016 CHI Conference on Human Factors in Computing Systems, pp. 1245–1249, ACM. |
| [193] | Müller J, Butscher S, Feyer SP, et al. (2017) Studying collaborative object positioning in distributed augmented realities. In: Proceedings of the 16th International Conference on Mobile and Ubiquitous Multimedia, pp. 123–132, ACM. |
| [194] | Francese R, Passero I, Zarraonandia T (2012) An augmented reality application to gather participant feedback during a meeting. In: Information systems: crossroads for organization, management, accounting and engineering, pp. 173–180. |
| [195] | Datcu D, Lukosch SG, Lukosch HK (2016) Handheld Augmented Reality for Distributed Collaborative Crime Scene Investigation. In: Proceedings of the 19th International Conference on Supporting Group Work, pp. 267–276, ACM. |
| [196] | Pece F, Steptoe W, Wanner F, et al. (2013) Panoinserts: mobile spatial teleconferencing. In: Proceedings of the SIGCHI Conference on Human Factors in Computing Systems, pp. 1319–1328, ACM. |
| [197] | Cai M, Masuko S, Tanaka J (2018) Gesture-based Mobile Communication System Providing Side-by-side Shopping Feeling. In: Proceedings of the 23rd International Conference on Intelligent User Interfaces Companion, p. 2, ACM. |
| [198] | Chang YS, Nuernberger B, Luan B, et al. (2017) Gesture-based augmented reality annotation. In: 2017 IEEE Virtual Reality (VR), pp. 469–470, IEEE. |
| [199] | Le Chénéchal M, Duval T, Gouranton V, et al. (2016) Vishnu: virtual immersive support for helping users an interaction paradigm for collaborative remote guiding in mixed reality. In: 2016 IEEE Third VR International Workshop on Collaborative virtual Environments (3DCVE), pp. 9–12. |
| [200] | Piumsomboon T, Lee Y, Lee GA, et al. (2017) Empathic Mixed Reality: Sharing What You Feel and Interacting with What You See. In: 2017 International Symposium on Ubiquitous Virtual Reality (ISUVR), pp. 38–41, IEEE. |
| [201] | Piumsomboon T, Lee Y, Lee G, et al. (2017) CoVAR: a collaborative virtual and augmented reality system for remote collaboration. In: SIGGRAPH Asia 2017 Emerging Technologies, p. 3, ACM. |
| [202] | Lee Y, Masai K, Kunze KS, et al. (2016) A Remote Collaboration System with Empathy Glasses. In: 2016 IEEE International Symposium on Mixed and Augmented Reality (ISMAR-Adjunct), pp. 342–343, IEEE. |
| [203] | Piumsomboon T, Dey A, Ens B, et al. (2017) [POSTER] CoVAR: Mixed-Platform Remote Collaborative Augmented and Virtual Realities System with Shared Collaboration Cues. In: 2017 IEEE International Symposium on Mixed and Augmented Reality (ISMAR-Adjunct), pp. 218–219, IEEE. |
| [204] | Piumsomboon T, Day A, Ens B, et al. (2017) Exploring enhancements for remote mixed reality collaboration. In: SIGGRAPH Asia 2017 Mobile Graphics & Interactive Applications, p. 16, ACM. |
| [205] | Amores J, Benavides X, Maes P (2015) Showme: A remote collaboration system that supports immersive gestural communication. In: Proceedings of the 33rd Annual ACM Conference Extended Abstracts on Human Factors in Computing Systems, pp. 1343–1348, ACM. |
| [206] | Yu J, Noh S, Jang Y, et al. (2015) A hand-based collaboration framework in egocentric coexistence reality. In: 2015 12th International Conference on Ubiquitous Robots and Ambient Intelligence (URAI), pp. 545–548, IEEE. |
| [207] | Piumsomboon T, Lee GA, Hart JD, et al. (2018) Mini-Me: An Adaptive Avatar for Mixed Reality Remote Collaboration. In: Proceedings of the 2018 CHI Conference on Human Factors in Computing Systems, p. 46, ACM. |
| [208] | Piumsomboon T, Lee GA, Billinghurst M (2018) Snow Dome: A Multi-Scale Interaction in Mixed Reality Remote Collaboration. In: Extended Abstracts of the 2018 CHI Conference on Human Factors in Computing Systems, p. D115, ACM. |
| [209] | Cidota M, Lukosch S, Datcu D, et al. (2016) Workspace awareness in collaborative AR using HMDS: a user study comparing audio and visual notifications. In: Proceedings of the 7th Augmented Human International Conference 2016, p. 3, ACM. |
| [210] | Jo D, Kim K-H, Kim GJ (2016) Effects of avatar and background representation forms to co-presence in mixed reality (MR) tele-conference systems. In: SIGGRAPH Asia 2016 Virtual Reality meets Physical Reality: Modelling and Simulating Virtual Humans and Environments, p. 12, ACM. |
| [211] | Yu J, Jeon J-u, Park G, et al. (2016) A Unified Framework for Remote Collaboration Using Interactive AR Authoring and Hands Tracking. In: International Conference on Distributed, Ambient, and Pervasive Interactions, pp. 132–141, Springer. |
| [212] | Nassani A, Lee G, Billinghurst M, et al. (2017) [POSTER] The Social AR Continuum: Concept and User Study. In: 2017 IEEE International Symposium on Mixed and Augmented Reality (ISMAR-Adjunct), pp. 7–8. |
| [213] | Gao L, Bai H, Lee G, et al. (2016) An oriented point-cloud view for MR remote collaboration. SIGGRAPH ASIA 2016 Mobile Graphics and Interactive Applications, p. 8, ACM. |
| [214] | Lee GA, Teo T, Kim S, et al. (2017) Mixed reality collaboration through sharing a live panorama. SIGGRAPH Asia 2017 Mobile Graphics & Interactive Applications, p. 14, ACM. |
| [215] | Gao L, Bai H, Lindeman R, et al. (2017) Static local environment capturing and sharing for MR remote collaboration. SIGGRAPH Asia 2017 Mobile Graphics & Interactive Applications, p. 17, ACM. |
| [216] | Lee GA, Teo T, Kim S, et al. (2017) Sharedsphere: MR collaboration through shared live panorama. SIGGRAPH Asia 2017 Emerging Technologies, pp. 1–2, ACM. |
| [217] | Rühmann LM, Prilla M, Brown G (2018) Cooperative Mixed Reality: An Analysis Tool. In: Proceedings of the 2018 ACM Conference on Supporting Groupwork, pp. 107–111, ACM. |
| [218] |
Lee H, Ha T, Noh S, et al. (2013) Context-of-Interest Driven Trans-Space Convergence for Spatial Co-presence. In: Proceedings of the First International Conference on Distributed, Ambient, and Pervasive Interactions 8028: 388–395. doi: 10.1007/978-3-642-39351-8_42
|
| [219] | Yang P, Kitahara I, Ohta Y. (2015) [POSTER] Remote Mixed Reality System Supporting Interactions with Virtualized Objects. In: 2015 IEEE International Symposium on Mixed and Augmented Reality, pp. 64–67, IEEE. |
| [220] | Benbelkacem S, Zenati-Henda N, Belghit H, et al. (2015) Extended web services for remote collaborative manipulation in distributed augmented reality. In: 2015 3rd International Conference on Control, Engineering & Information Technology (CEIT), pp. 1–5, IEEE. |
| [221] |
Pan Y, Sinclair D, Mitchell K (2018) Empowerment and embodiment for collaborative mixed reality systems. Comput Animat Virt W 29: e1838. doi: 10.1002/cav.1838
|
| [222] | Drochtert D, Geiger C (2015) Collaborative magic lens graph exploration. In: SIGGRAPH Asia 2015 Mobile Graphics and Interactive Applications, p. 25, ACM. |
| [223] | Lee J-Y, Kwon J-H, Nam S-H, et al. (2016) Coexistent Space: Collaborative Interaction in Shared 3D Space. In: Proceedings of the 2016 Symposium on Spatial User Interaction, pp. 175–175, ACM. |
| [224] | Müller F, Günther S, Nejad AH, et al. (2017) Cloudbits: supporting conversations through augmented zero-query search visualization. In: Proceedings of the 5th Symposium on Spatial User Interaction, pp. 30–38, ACM. |
| [225] | Lehment NH, Tiefenbacher P, Rigoll G (2014) Don't Walk into Walls: Creating and Visualizing Consensus Realities for Next Generation Videoconferencing. In: Proceedings, Part I, of the 6th International Conference on Virtual, Augmented and Mixed Reality. Designing and Developing Virtual and Augmented Environments 8525: 170–180. |
| [226] | Roth D, Lugrin J-L, Galakhov D, et al. (2016) Avatar realism and social interaction quality in virtual reality. In: 2016 IEEE Virtual Reality (VR), pp. 277–278, IEEE. |
| [227] |
Kasahara S, Nagai S, Rekimoto J (2017) JackIn Head: Immersive visual telepresence system with omnidirectional wearable camera. IEEE transactions on visualization and computer graphics 23: 1222–1234. doi: 10.1109/TVCG.2016.2642947
|
| [228] | Luongo C, Leoncini P (2018) An UE4 Plugin to Develop CVE Applications Leveraging Participant's Full Body Tracking Data. International Conference on Augmented Reality, Virtual Reality, and Computer Graphics, pp. 610–622. |
| [229] |
Piumsomboon T, Lee GA, Ens B, et al. (2018) Superman vs Giant: A Study on Spatial Perception for a Multi-Scale Mixed Reality Flying Telepresence Interface. IEEE Transactions on Visualization and Computer Graphics 24: 2974–2982. doi: 10.1109/TVCG.2018.2868594
|
| [230] | Kasahara S, Rekimoto J (2015) JackIn head: immersive visual telepresence system with omnidirectional wearable camera for remote collaboration. In: Proceedings of the 21st ACM Symposium on Virtual Reality Software and Technology, pp. 217–225, ACM. |
| [231] | Adams H, Thompson C, Thomas D, et al. (2015) The effect of interpersonal familiarity on cooperation in a virtual environment. In: Proceedings of the ACM SIGGRAPH Symposium on Applied Perception, pp. 138–138, ACM. |
| [232] | Ryskeldiev B, Cohen M, Herder J (2017) Applying rotational tracking and photospherical imagery to immersive mobile telepresence and live video streaming groupware. In: SIGGRAPH Asia 2017 Mobile Graphics & Interactive Applications, p. 5. |
| [233] | Mai C, Bartsch SA, Rieger L (2018) Evaluating Shared Surfaces for Co-Located Mixed-Presence Collaboration. In: Proceedings of the 17th International Conference on Mobile and Ubiquitous Multimedia, pp. 1–5, ACM. |
| [234] | Congdon BJ, Wang T, Steed A (2018) Merging environments for shared spaces in mixed reality. In: Proceedings of the 24th ACM Symposium on Virtual Reality Software and Technology, p. 11. |
| [235] | Gao L, Bai H, He W, et al. (2018) Real-time visual representations for mobile mixed reality remote collaboration. SIGGRAPH Asia 2018 Virtual & Augmented Reality, p. 15. |
| [236] | Lee G, Kim S, Lee Y, et al. (2017) [POSTER] Mutually Shared Gaze in Augmented Video Conference. In: 2017 IEEE International Symposium on Mixed and Augmented Reality (ISMAR-Adjunct), pp. 79–80, IEEE. |
| [237] | Tiefenbacher P, Gehrlich T, Rigoll G (2015) Impact of annotation dimensionality under variable task complexity in remote guidance. In: 2015 IEEE Symposium on 3D User Interfaces (3DUI), pp. 189–190, IEEE. |
| [238] |
Adcock M, Gunn C (2015) Using Projected Light for Mobile Remote Guidance. Computer Supported Cooperative Work (CSCW) 24: 591–611. doi: 10.1007/s10606-015-9237-2
|
| [239] | Kim S, Lee GA, Ha S, et al. (2015) Automatically freezing live video for annotation during remote collaboration. In: Proceedings of the 33rd Annual ACM Conference Extended Abstracts on Human Factors in Computing Systems, pp. 1669–1674, ACM. |
| [240] |
Tait M, Billinghurst M (2015) The effect of view independence in a collaborative AR system. Computer Supported Cooperative Work (CSCW) 24: 563–589. doi: 10.1007/s10606-015-9231-8
|
| [241] | Adcock M, Anderson S, Thomas B (2013) RemoteFusion: real time depth camera fusion for remote collaboration on physical tasks. In: Proceedings of the 12th ACM SIGGRAPH International Conference on Virtual-Reality Continuum and Its Applications in Industry, pp. 235–242, ACM. |
| [242] | Kim S, Lee GA, Sakata N, et al. (2013) Study of augmented gesture communication cues and view sharing in remote collaboration. In: 2013 IEEE International Symposium on Mixed and Augmented Reality, pp. 261–262, IEEE. |
| [243] | Sakata N, Takano Y, Nishida S (2014) Remote Collaboration with Spatial AR Support. In: International Conference on Human-Computer Interaction, pp. 148–157, Springer. |
| [244] | Tiefenbacher P, Gehrlich T, Rigoll G, et al. (2014) Supporting remote guidance through 3D annotations. In: Proceedings of the 2nd ACM Symposium on Spatial User Interaction, pp. 141–141, ACM. |
| [245] | Tait M, Billinghurst M (2014) View independence in remote collaboration using AR. ISMAR, pp. 309–310. |
| [246] | Gauglitz S, Nuernberger B, Turk M, et al. (2014) In touch with the remote world: Remote collaboration with augmented reality drawings and virtual navigation. In: Proceedings of the 20th ACM Symposium on Virtual Reality Software and Technology, pp. 197–205, ACM. |
| [247] |
Lukosch S, Lukosch H, Datcu D, et al. (2015) Providing information on the spot: Using augmented reality for situational awareness in the security domain. Computer Supported Cooperative Work (CSCW) 24: 613–664. doi: 10.1007/s10606-015-9235-4
|
| [248] | Lukosch SG, Lukosch HK, Datcu D, et al. (2015) On the spot information in augmented reality for teams in the security domain. In: Proceedings of the 33rd Annual ACM Conference Extended Abstracts on Human Factors in Computing Systems, pp. 983–988, ACM. |
| [249] | Yamada S, Chandrasiri NP (2018) Evaluation of Hand Gesture Annotation in Remote Collaboration Using Augmented Reality. In: 2018 IEEE Conference on Virtual Reality and 3D User Interfaces (VR), pp. 727–728. |
| [250] |
Anton D, Kurillo G, Bajcsy R (2018) User experience and interaction performance in 2D/3D telecollaboration. Future Gener Comp Sy 82: 77–88. doi: 10.1016/j.future.2017.12.055
|
| [251] | Tait M, Tsai T, Sakata N, et al. (2013) A projected augmented reality system for remote collaboration. In: 2013 IEEE International Symposium on Mixed and Augmented Reality (ISMAR), pp. 1–6, IEEE. |
| [252] | Irlitti A, Itzstein GSV, Smith RT, et al. (2014) Performance improvement using data tags for handheld spatial augmented reality. In: Proceedings of the 20th ACM Symposium on Virtual Reality Software and Technology, pp. 161–165, ACM. |
| [253] |
Iwai D, Matsukage R, Aoyama S, et al. (2018) Geometrically Consistent Projection-Based Tabletop Sharing for Remote Collaboration. IEEE Access 6: 6293–6302. doi: 10.1109/ACCESS.2017.2781699
|
| [254] | Pejsa T, Kantor J, Benko H, et al. (2016) Room2room: Enabling life-size telepresence in a projected augmented reality environment. In: Proceedings of the 19th ACM Conference on Conference on Computer-Supported Cooperative Work & Social Computing, pp. 1716–1725, ACM. |
| [255] | Schwede C, Hermann T (2015) HoloR: Interactive mixed-reality rooms. In: 2015 6th IEEE International Conference on Cognitive Infocommunications (CogInfoCom), pp. 517–522, IEEE. |
| [256] | Salimian MH, Reilly DF, Brooks S, et al. (2016) Physical-Digital Privacy Interfaces for Mixed Reality Collaboration: An Exploratory Study. In: Proceedings of the 2016 ACM International Conference on Interactive Surfaces and Spaces, pp. 261–270, ACM. |
| [257] | Weiley V, Adcock M (2013) Drawing in the lamposcope. In: Proceedings of the 9th ACM Conference on Creativity & Cognition, pp. 382–383, ACM. |
| [258] | Irlitti A, Itzstein GSV, Alem L, et al. (2013) Tangible interaction techniques to support asynchronous collaboration. In: 2013 IEEE International Symposium on Mixed and Augmented Reality (ISMAR), pp. 1–6, IEEE. |
| [259] | Kratky A (2015) Transparent touch–interacting with a multi-layered touch-sensitive display system. In: International Conference on Universal Access in Human-Computer Interaction, pp. 114–126, Springer. |
| [260] | Moniri MM, Valcarcel FAE, Merkel D, et al. (2016) Hybrid team interaction in the mixed reality continuum. In: Proceedings of the 22nd ACM Conference on Virtual Reality Software and Technology, pp. 335–336, ACM. |
| [261] | Seo D, Yoo B, Ko H (2018) Webizing collaborative interaction space for cross reality with various human interface devices. In: Proceedings of the 23rd International ACM Conference on 3D Web Technology, pp. 1–8, ACM. |
| [262] | Randhawa JS (2016) Stickie: Mobile Device Supported Spatial Collaborations. In: Proceedings of the 2016 Symposium on Spatial User Interaction, pp. 163–163, ACM. |
| [263] | Tabrizian P, Petrasova A, Harmon B, et al. (2016) Immersive tangible geospatial modeling. In: Proceedings of the 24th ACM SIGSPATIAL International Conference on Advances in Geographic Information Systems, p. 88, ACM. |
| [264] | Ren D, Lee B, Höllerer T (2018) XRCreator: interactive construction of immersive data-driven stories. In: Proceedings of the 24th ACM Symposium on Virtual Reality Software and Technology, p. 136, ACM. |
| [265] | Minagawa J, Choi W, Li L, et al. (2016) Development of collaborative workspace system using hand gesture. In: 2016 IEEE 5th Global Conference on Consumer Electronics, pp. 1–2, IEEE. |
| [266] | Tanaya M, Yang K, Christensen T, et al. (2017) A Framework for analyzing AR/VR Collaborations: An initial result. In: 2017 IEEE International Conference on Computational Intelligence and Virtual Environments for Measurement Systems and Applications (CIVEMSA), pp. 111–116, IEEE. |
| [267] | Butscher S, Hubenschmid S, Müller J, et al. (2018) Clusters, Trends, and Outliers: How Immersive Technologies Can Facilitate the Collaborative Analysis of Multidimensional Data. In: Proceedings of the 2018 CHI Conference on Human Factors in Computing Systems, p. 90, ACM. |
| [268] | Machuca MDB, Chinthammit W, Yang Y, et al. (2014) 3D mobile interactions for public displays. In: SIGGRAPH Asia 2014 Mobile Graphics and Interactive Applications, p. 17, ACM. |
| [269] | Ríos AP, Callaghan V, Gardner M, et al. (2014) Interactions within Distributed Mixed Reality Collaborative Environments. In: IE'14 Proceedings of the 2014 International Conference on Intelligent Environments, pp. 382–383. |
| [270] | Ueda Y, Iwazaki K, Shibasaki M, et al. (2014) HaptoMIRAGE: mid-air autostereoscopic display for seamless interaction with mixed reality environments. In: ACM SIGGRAPH 2014 Emerging Technologies, p. 10, ACM. |
| [271] |
Wang X, Love PED, Kim MJ, et al. (2014) Mutual awareness in collaborative design: An Augmented Reality integrated telepresence system. Computers in Industry 65: 314–324. doi: 10.1016/j.compind.2013.11.012
|
| [272] | Komiyama R, Miyaki T, Rekimoto J (2017) JackIn space: designing a seamless transition between first and third person view for effective telepresence collaborations. In: Proceedings of the 8th Augmented Human International Conference, p. 14, ACM. |
| [273] | Oyekoya O, Stone R, Steptoe W, et al. (2013) Supporting interoperability and presence awareness in collaborative mixed reality environments. In: Proceedings of the 19th ACM Symposium on Virtual Reality Software and Technology, pp. 165–174, ACM. |
| [274] | Reilly DF, Echenique A, Wu A, et al. (2015) Mapping out Work in a Mixed Reality Project Room. In: Proceedings of the 33rd Annual ACM Conference on Human Factors in Computing Systems, pp. 887–896, ACM. |
| [275] | Dean J, Apperley M, Rogers B (2014) Refining personal and social presence in virtual meetings. In: Proceedings of the Fifteenth Australasian User Interface Conference 150: 67–75. Australian Computer Society, Inc. |
| [276] | Robert K, Zhu D, Huang W, et al. (2013) MobileHelper: remote guiding using smart mobile devices, hand gestures and augmented reality. In: SIGGRAPH Asia 2013 Symposium on Mobile Graphics and Interactive Applications, p. 39, ACM. |
| [277] | Billinghurst M, Nassani A, Reichherzer C (2014) Social panoramas: using wearable computers to share experiences. In: SIGGRAPH Asia 2014 Mobile Graphics and Interactive Applications, p. 25, ACM. |
| [278] | Kim S, Lee G, Sakata N, et al. (2014) Improving co-presence with augmented visual communication cues for sharing experience through video conference. In: 2014 IEEE International Symposium on Mixed and Augmented Reality (ISMAR), pp. 83–92, IEEE. |
| [279] | Cha Y, Nam S, Yi MY, et al. (2018) Augmented Collaboration in Shared Space Design with Shared Attention and Manipulation. In: The 31st Annual ACM Symposium on User Interface Software and Technology Adjunct Proceedings, pp. 13–15, ACM. |
| [280] | Grandi JG (2017) Design of collaborative 3D user interfaces for virtual and augmented reality. In: 2017 IEEE Virtual Reality (VR), pp. 419–420, IEEE. |
| [281] | Koskela T, Mazouzi M, Alavesa P, et al. (2018) AVATAREX: Telexistence System based on Virtual Avatars. In: Proceedings of the 9th Augmented Human International Conference, p. 13, ACM. |
| [282] | Heiser J, Tversky B, Silverman M (2004) Sketches for and from collaboration. Visual and spatial reasoning in design III 3: 69–78. |
| [283] | Fakourfar O, Ta K, Tang R, et al. (2016) Stabilized annotations for mobile remote assistance. In: Proceedings of the 2016 CHI Conference on Human Factors in Computing Systems, pp. 1548–1560, ACM. |
| [284] |
Schmidt K (2002) The problem with 'awareness': Introductory remarks on 'awareness in CSCW'. Computer Supported Cooperative Work (CSCW) 11: 285–298. doi: 10.1023/A:1021272909573
|
| [285] |
Olson GM, Olson JS (2000) Distance matters. Human–computer interaction 15: 139–178. doi: 10.1207/S15327051HCI1523_4
|
| [286] | Ishii H, Kobayashi M, Arita K (1994) Iterative design of seamless collaboration media. Communications of the ACM 37: 83–97. |
| [287] |
Ishii H, Kobayashi M, Grudin J (1993) Integration of interpersonal space and shared workspace: ClearBoard design and experiments. ACM Transactions on Information Systems 11: 349–375. doi: 10.1145/159764.159762
|
Figures(2) / Tables(7)

Ryan Anthony J. de Belen, Huyen Nguyen, Daniel Filonik, Dennis Del Favero, Tomasz Bednarz. A systematic review of the current state of collaborative mixed reality technologies: 2013–2018[J]. AIMS Electronics and Electrical Engineering, 2019, 3(2): 181-223. doi: 10.3934/ElectrEng.2019.2.181


 DownLoad: