


Citation: Emanuele Amodio, Luca Cavalieri d’Oro, Elisabetta Chiarazzo, Carlo Picco, Maurizio Migliori, Isabella Trezzi, Silvano Lopez, Oliviero Rinaldi, Massimo Giupponi. Emergency department performances during overcrowding: the experience of the health protection agency of Brianza[J]. AIMS Public Health, 2018, 5(3): 217-224. doi: 10.3934/publichealth.2018.3.217
| [1] | Anne W Taylor, Bridgette M Bewick, Qing Ling, Valentina V Kirzhanova, Paulo Alterwain, Eleonora Dal Grande, Graeme Tucker, Alfred B Makanjuola . Clusters of alcohol abstainers and drinkers incorporating motives against drinking: a random survey of 18 to 34 year olds in four cities in four different continents. AIMS Public Health, 2019, 6(1): 15-33. doi: 10.3934/publichealth.2019.1.15 |
| [2] | Kassidy C Colton, Stephanie A Godleski, Joseph S Baschnagel, Rebecca J Houston, Shine M DeHarder . Alcohol use during the COVID-19 pandemic: gender, parenthood, intimate partner violence, and stress. AIMS Public Health, 2023, 10(2): 360-377. doi: 10.3934/publichealth.2023027 |
| [3] | Eduardo Sánchez-Sánchez, Nuria Trujillo-Garrido, Jara Díaz-Jimenez, Alejandro García-García, Miguel A Rosety, Manuel Bandez, Manuel Rosety-Rodriguez, Francisco J Ordonez, Ignacio Rosety, Antonio J Diaz . Attitudes and consumption habits of energy drinks among adolescents and young adults in a Spanish population. AIMS Public Health, 2025, 12(1): 16-32. doi: 10.3934/publichealth.2025002 |
| [4] | Behrad Pourmohammadi, Moahammad Ali Jalilvand . Prevalence of alcohol consumption and related factors among students of higher education centers in one of the northeastern cities of Iran. AIMS Public Health, 2019, 6(4): 523-533. doi: 10.3934/publichealth.2019.4.523 |
| [5] | Anne W Taylor, Zumin Shi, Eleonora Dal Grande, Creina Stockley . The Relationship between Alcohol Consumption and other Risk Factors Assessed Using An Ongoing Population-based Surveillance System. AIMS Public Health, 2016, 3(4): 985-1002. doi: 10.3934/publichealth.2016.4.985 |
| [6] | Jorge de Andrés-Sánchez, Francesc Valls-Fonayet, Anna Sánchez-Aragón, Inma Pastor-Gosálbez, Angel Belzunegui-Eraso . Explanatory factors of polydrug use in mid-late teens and the relevance of information sources: Correlational and configurational assessment in Tarragona (Spain). AIMS Public Health, 2024, 11(3): 773-802. doi: 10.3934/publichealth.2024039 |
| [7] | Maha Hamad Mohammed Ali, Osman Babiker Osman, Mohamed AE. M. Ibrahim, Waled Amen Mohammed Ahmed . The effect of AIDS peer health education on knowledge, attitudes, and practices of secondary school students in Khartoum, Sudan. AIMS Public Health, 2015, 2(4): 718-726. doi: 10.3934/publichealth.2015.4.718 |
| [8] | Sharon L. Casapulla, Gloria Aidoo-Frimpong, Tania B. Basta, Mario J. Grijalva . Zika virus knowledge and attitudes in Ecuador. AIMS Public Health, 2018, 5(1): 49-63. doi: 10.3934/publichealth.2018.1.49 |
| [9] | Duong Minh Duc, Le Thi Vui, Hoang Ngoc Son, Hoang Van Minh . Smoking Initiation and Cessation among Youths in Vietnam: A Longitudinal Study Using the Chi Linh Demographic—Epidemiological Surveillance System (CHILILAB DESS). AIMS Public Health, 2017, 4(1): 1-18. doi: 10.3934/publichealth.2017.1.1 |
| [10] | Walid El Ansari, Khalid A Khalil, Derrick Ssewanyana, Christiane Stock . Behavioral risk factor clusters among university students at nine universities in Libya. AIMS Public Health, 2018, 5(3): 296-311. doi: 10.3934/publichealth.2018.3.296 |
Brewer’s spent grain (BSG) is generated from a series of unit operations where malt is processed into wort [1] and accounts for about 85% of the total byproducts of the brewing industry [2]. BSG is an attractive agro-industrial byproduct due to its availability around the year at no or at a very low cost. BSG is produced in large quantities that accounts approximately to 31% of the original weight of processed malt [2]. It has been established that 0.197 kg of BSG is generated for each kg of manufactured beer [3]. The global production of beer from barley in 2011 was 184.89 million tonnes and the principal manufacturing countries were China (25.9%), USA (12.2%) and Brazil (7.1%) [4]. This data suggests that the amount of BSG that was generated in 2011 was in excess of 36 million tonnes. Colombia produces 2.26 million tonnes of beer per annum [4] and thus generates about 445,000 tonnes of BSG per year.
BSG is a lignocellulosic material containing approximately 25% holocellulose, 4% extractable compounds and 15% lignin that can be processed into value-added compounds such as: alpha amylase, activated carbon, lactic acid, xylitol and ethanol [5,6,7,8,9]. The feasibility of producing each of these value added products in a standalone manufacturing plant configuration is likely to be adversely impacted by challenges pertaining to the pretreatment of BSG, energy consumption and low production yield. The application of a biorefinery concept for the production of value-added products from BSG can, in potential, lead to a total production cost that is lower than the sum of costs associated with the standalone plants. The biorefinery approach calls for fractionating the BSG biomass into different sub-products consisting of biomolecules, bioenergy, biofuels and biomaterials, etc. The integrative approach for processing a single raw material into different value-added products in a biorefinery has been shown to allow enhancing the economic viability of the process [10,11].
Biomaterials are among the most important products that can be obtained from lignocellulosic biomass. For example, the mechanical properties of polyhydroxybutyrate (PHB) are similar to those of common plastics but its production cost, using conventional approaches, has been prohibitive; however, utilization of agro-industrial wastes, such as BSG, as a potential raw material presents an attractive route for manufacturing PHB [12]. Similarly, xylitol, that can be prepared from the hemicellulose fraction of biomass is a natural alternative sweetener with sweetening power similar to that of sucrose, has found many food and pharmaceutical applications [6]. Ethanol is yet another highly sought after compound that can be produced from lignocellulosic biomass. These three components thus present an attractive approach for utilization of BSG.
The objective of the research was to investigate the application of the biorefinery approach for production of xylitol, ethanol and polyhydroxybutyrate (PHB) from BSG. The techno-economic and environmental aspects of two biorefinery scenarios, with and without heat integration, were studied by utilizing computer-aided process engineering tools. The simulation approach was carried out using information and relevant data that are in the public domain.
A biorefinery approach and scheme for processing BSG into xylitol, ethanol and PHB was developed. Techno-economic procedure for assessing the biorefinery was developed and used to evaluate the impact of heat integration (Scenario 1) on the total production cost in comparison to a process configuration without heat integration (Scenario 2). An environmental assessment comparing scenarios 1 and 2 was developed and carried out as well.
The methodology that is outlined above was carried out in three steps, using different computational tools. The first step, consisting of process simulation, was aimed at obtaining the energy and mass balances of the process, using Aspen Plus V.8.0 (AspenTech, Cambridge, MA). The physicochemical properties of all the compounds and materials that were included in the simulation were obtained from the National Institute of Standards of Technology [13]. The Unifac Dortmund model was used for calculating the properties of all the relevant compounds. The second step of the research consisted of the economic analysis and was carried out using Aspen Process Economic Analyzer (AspenTech, Cambridge, MA). A heat integration strategy, based on composite curves, generated according to Pinch methodology [14], was applied, using the Aspen Energy Analyzer (AspenTech, Cambridge, MA). The final step of the study focused on the environmental analysis and was carried out using the Waste Algorithm Reduction (WAR) that had been developed by the U.S. Environmental Protection Agency (EPA).
The feedstock for the biorefinery consisted of 50 t/h of BSG. The chemical composition of BSG (Table 1) was based on what has been previously reported [2].
| Component | Proportion (%, w/w) |
| Cellulose | 9.32 |
| Hemicellulose | 15.79 |
| Lignin | 15.43 |
| Ash | 2.6 |
| Protein | 8.47 |
| Extractives | 3.99 |
| Water | 44.4 |
 DownLoad: CSV
The scheme for processing BSG into xylitol, ethanol and PHB, in a biorefinery, is depicted in Figure 1. The designed biorefinery consists of seven plants: three for the production of the final value-added products (xylitol, ethanol and PHB), a plant for pretreating the BSG biomass (Pretreatment), a plant for producing glucose (glucose plant), a plant for generation of energy (gasification plant) and a plant for water treatment. The objectives, assumptions, conditions and methods used for the principal units in the simulation are summarized in Table 2.
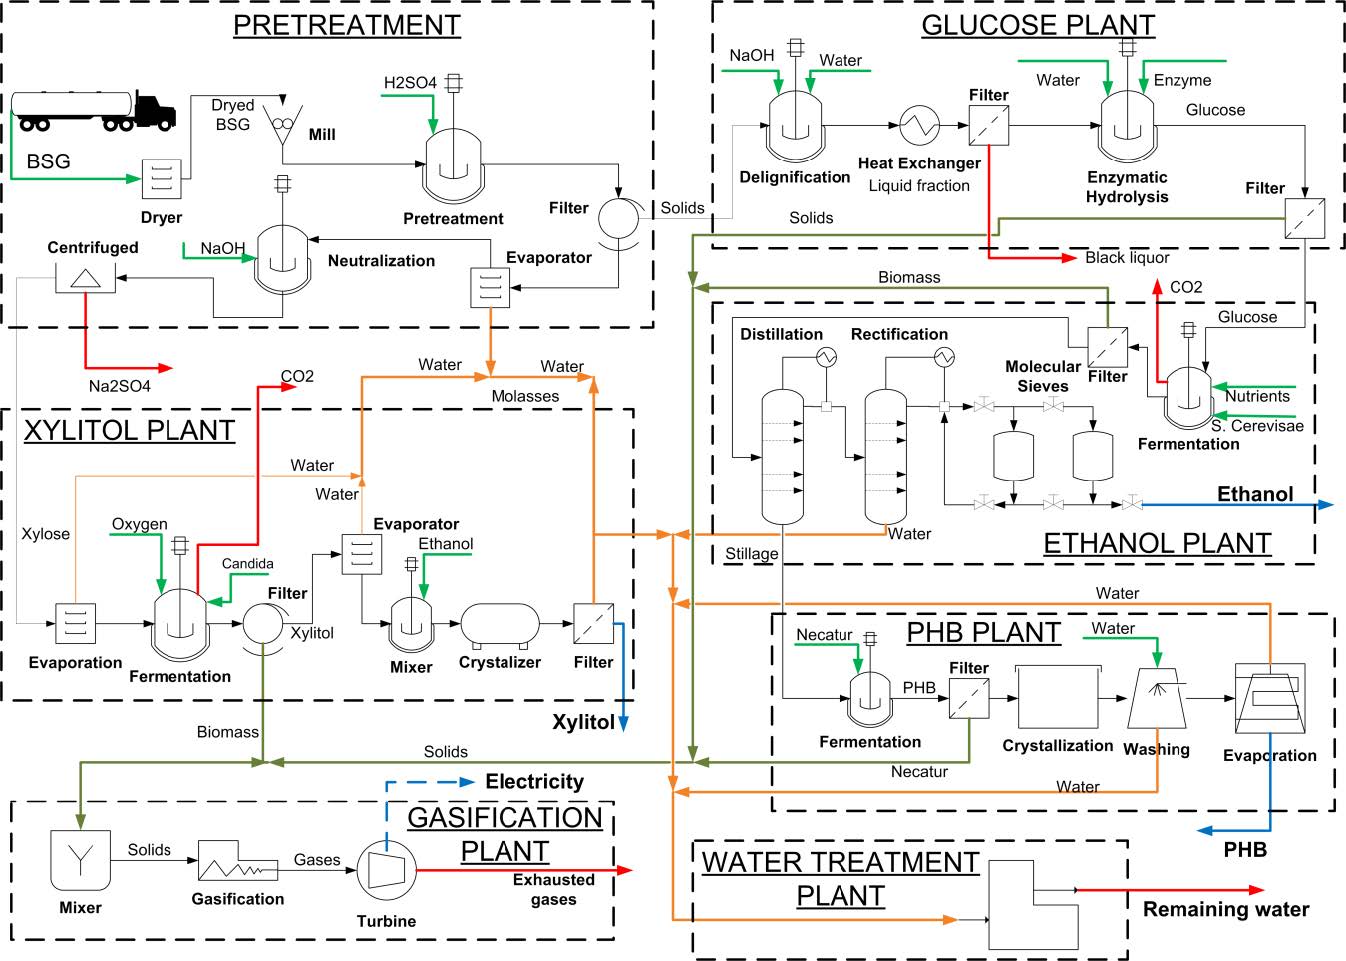 Figure 1. A schematic diagram of a biorefinery for production of xylitol, ethanol and PHB from BSG.
| Unit | Purpose | Conditions and unit specifications | Method | Assumptions |
| PRETREATMENT PLANT | ||||
| Dryer | Drying to 10% moisture | 80 °C, 1 bar | NRTL * | No |
| Atmospheric dryer | ||||
| Mill | Size reduction to 0.45 mm | 1 bar, Jaw mill | N.A. | N.A. |
| Acid hydrolysis | Enhancing the efficiency of recovering cellulose and xylose | 120 °C, 1 bar, (1.25% w/v of H2SO4) | NRTL | Low production of glucose, HMF and acids (Levunilic and formic) |
| Agitated tank enclosed | ||||
| Cellulose + water = Glucose (Conversion = 1%) | ||||
| Hemicellulose + water = xylose (Conversion = 93%) | ||||
| Glucose = HMF + 3 water (Conversion = 1%) | ||||
| HMF + 2 water = L.A + F.A. (Conversion = 1%) | ||||
| Xylose = 3 water + Furfural (Conversion=20%) | ||||
| Neutralization | Neutralization of acid | 120 °C, 1 bar | NRTL | N.A. |
| GLUCOSE PLANT | ||||
| Delignification | Removing lignin | 120 °C, (2% w/v) | NRTL | N.A. |
| Enzymatic hydrolysis | Glucose production | 45 °C, 1 bar, 7% (wt) enzyme/substrate of 45 | User model (Yields from literature) | Yield of 0.6 g/g from [8] |
| Agitated tank enclosed | ||||
| XYLITOL PLANT | ||||
| Evaporation | Removing part of the water (Concentration of xylose) | 121 °C, 1 bar (until 70 gr/L) | NRTL-HOC | N.A. |
| Standard tube vertical evaporator, one effect | ||||
| Fermentation | Production of Xylitol | 30 °C. Candida guilliermondii | User model (Yields from literature) | [15] |
| Crystallizer | Xylitol crystallization | 40 °C, Ethanol at 95.3% | NRTL | N.A. |
| ETHANOL PLANT | ||||
| Fermentation | Ethanol production | 30 °C, Zymomonas mobilis | User model (Yields from literature) | [16] |
| Distillation columns | Ethanol separation | Distillation: 18 trays, 2.5 reflux ratio, total condenser | NRTL-HOC | N.A. |
| Rectification: 12 trays, 1.8 reflux ratio, total condenser | ||||
| PHB PLANT | ||||
| Fermentation | PHB production | 30 °C. Cupriavidus necatur | User model (Yields from literature) | Use of glucose content in the stillage |
| Crystallization | Solid PHB formation | 30 °C, 1 bar. | NRTL | N.A. |
| Evaporation | PHB concentration | 80 °C, 1 bar. | NRTL | N.A. |
| GASIFICATION PLANT | ||||
| Gasifier | Syngas generation | 900 °C, 60 bar | NRTL-HOC | N.A. |
| Turbine | Electricity generation | 1 bar, 70% efficiency | NRTL-HOC | N.A. |
| WATER TREATMENT PLANT | ||||
| Filter | Removing particles from water | 15 °C, 1 bar | NRTL-HOC | N.A. |
| * NRTL corresponds to Non-Random Two Liquids model for activity coefficients calculation | ||||
DownLoad: CSVThe BSG is first dried to a moisture content of 10% and the dried mass is milled to a mean particle size of 0.45 mm, thus preparing it for acid hydrolysis. The treated BSG is then subjected to acid hydrolysis for 17 minutes, using a sulfuric acid solution (1.25%, w/v), at a 1-to-8 solid-to-liquid ratio and 120 °C [16]. The acid hydrolysis is aimed at preparing the BSG for further treatment by obtaining a xylose-rich mass and exposing its cellulose fraction.
This plant processes the cellulose and lignin-rich solid phase that leaves the pretreatment plant. The mass is first subjected to a soda pulping process where it is treated with a 2% (w/v) soda solution in order to adjust its pH to 12, using a solid-to-liquid ratio of 1-to-20 at 120 °C for 90 min, [17]. The reaction mixture is then separated into black liquor and a cellulose-containing stream. The latter is routed to the glucose production step where it is subjected to enzymatic hydrolysis using Trichoderma reesei cellulase (Celluclast 1.5L, Novozymes, Copenhagen Denmark) at an enzyme/substrate ratio of 45 FPU/g (FPU, Filter Paper Unit). The enzymatic reaction is carried out in a pH 4.8 citrate buffer solution at 45 °C, at a stirring rate of 100 rpm and at a solid-to-liquid ratio of 1-to-8, for 96 hours [18]. Finally, the glucose-rich hydrolysate (liquid phase, containing about 4.5% glucose) is separated from the remaining BSG solids mass (consisting mostly of lignin) and is transferred to the ethanol plant. The separated solid phase is routed to the gasification plant for generation of electricity.
Xylose-rich hydrolysate (23 g/L) from the pretreatment plant is used to produce xylitol. The hydrolysate is concentrated to a xylose concentration of 70 g/L by means of a flash evaporator at 121 °C and 1 bar of pressure and is then fermented, using Candida guilliermondii yeast at 30 °C and 200 rpm [9] to a yield of 0.78 g/g of xylose and 98.7% of conversion of xylose. The CO2 that is generated by the fermentation is separated and the liquid stream is filtered to recover the cell biomass. Finally, the xylitol-containing liquid stream (0.58 g/L) is concentrated at 1 bar of pressure using a flash evaporator (at 40 °C). The xylitol is crystallized out of the concentrate, after ethanol (at 95.3%, w/w) has been added in order to lower solubility of xylitol and enhance the process efficiency [19]. The recovered cell biomass is routed for utilization in the gasification plant and the recovered water is directed to the water treatment plant.
Ethanol is produced from the glucose-rich stream leaving the glucose plant. The glucose is fermented to ethanol, using Zymomonas mobilis, at 30 °C for 30 hours [20]. It has been stablished that at these conditions, about 60% of the glucose content is converted into ethanol [20], therefore, the remaining 40% of glucose is used for PHB production. Following distillation and rectification steps, where the ethanol concentration is increased to 96%, the ethanol is dehydrated by means of molecular sieves. The stillage that is obtained in the process is sent to the water treatment plant and the recovered cell biomass is routed to the gasification plant.
PHB is produced from the glucose that remains after the completion of the ethanol production (40% of the original glucose content prior to the fermentation) by a fermentation process, using Cupriavidus necatur (Ralstonia eutropha), at 30 °C, as previously described [21]. PHB content of 7.5 g/L is obtained at a 90% conversion of the glucose content. PHB is an intracellular compound and therefore, following the fermentation the downstream process includes a heat-induced cell lysis step. Then, the PHB-containing stream is separated by filtration and the PHB is crystallized (30 °C and 1 bar) [14]. The PHB crystals are then recovered by centrifugation and washed to remove impurities. The remaining biomass is recovered and routed to the gasification plant and the recovered water is sent to the water treatment plant.
Gasification is a thermo-chemical conversion technology to produce heat and power of high quality. Gasification allows obtaining a syngas containing both, H2 and CO that can be used for other applications in the biorefinery context [29]. The designed biorefinery included a gas turbine gasification scheme. Gasification temperatures ranges from 875 to 1275 K and, depending on the composition of the biomass, a mixture of gases consisting of CO, CO2, H2O, H2 and CH4, among other constituents, can be obtained [22,23]. This technology is thus used to produce electricity from the combined biomasses (cell biomass and lignin) that are recovered throughout the afore-detailed processes. Gasification is carried out at 900 °C and 60 bars of pressure and the generated gases are used by a turbine to produce electricity.
This plant receives all of the residual water from the constituent plants of the biorefinery. The objective of this plant is to improve the quality of water leaving the biorefinery as well as to generate water at quality that allows its utilization in the mass integration operations of the biorefinery [24]. In this plant, the heavy matter content is separated by filtration. The end result is water effluent of higher quality.
The economic analysis was developed based on the mass and energy balances obtained from the process simulation. The total production cost was calculated for xylitol, ethanol and PHB, considering cost of: raw material, utilities, operating labor, maintenance, operating charges, plant overhead as well as general and administrative costs [15]. This analysis was carried out using costs and other parameters that are relevant to the Colombian context, such as 25% tax and 17% interest rates, respectively. The economic analysis was carried out according to the costs that are depicted in Table 3.
| Item | Price | Unit |
| BSG a | 21 | USD/t |
| Water b | 1.25 | USD/m3 |
| Sulfuric acid c | 0.094 | USD/kg |
| Sodium hydroxide c | 0.098 | USD/kg |
| Enzyme d | 10 | USD/kg |
| Operator labor cost b | 2.14 | USD/h |
| Supervisor labor cost b | 4.19 | USD/h |
| Electricity cost b | 0.1 | USD/kWh |
| *Fuel e | 7.28 | USD/MMBTU |
| Ethanol at 99.5% f | 0.94 | USD/L |
| * MMBTU means one million BTU aCalculated for transportation over a distance of 140 km with a truck of three axes. bTypical price in Colombia. c Taken from ICIS Prices [25] d Prices based on Alibaba International Prices [26] eEstimated cost of Gas for the years 2015-2035 [27] fNational price in Colombia [28] | ||
DownLoad: CSVThe environmental analysis was carried out using WAR that evaluates eight environmental impact categories: human toxicity potential by ingestion (HTPI), human toxicity potential by dermal and inhalation exposure (HTPE), terrestrial toxicity potential (TTP), aquatic toxicity potential (ATP), global warming potential (GWP), ozone depletion potential (ODP), photochemical oxidation potential (PCOP) and acidification potential (AP). The Potential Environmental Impact (PEI) of the process was calculated per kilogram of products. Natural gas was used as fuel to meet the heat requirements in the biorefinery.
Table 4 depicts the streams and target compounds composition for all plants in the biorefinery. According to these results, the target products from each plant are obtained in the expected yields described in the process simulation description section. Some of the waste streams that are obtained, for example, CO2, sulphate (Na2SO4), molasses (protein-rich stream) and residual water have a potential to be used for some other applications. For instance, the molasses obtained from the xylitol plant can be used as animal feed, making use of its protein content [24]. The gases produced (CO2) in the entire biorefinery can be captured and used as substrate for microalgae growth [29] and the residual water can be treated for enhancing its quality.
| Plant | Outlet streams | Target product and composition | |
| Stream | Flow (kg/h) | ||
| Pretreatment plant | Xylose | 103,011 | Xylose at 6.8% |
| Residual water | 78,047 | Water at 99.6% | |
| Solid to pulping | 15,849 | Solid containing 32% of cellulose | |
| Sulphate | 3584.8 | Na2SO4 at 99% | |
| Pulping plant | Cellulose | 8133.5 | Solid containing 68% of cellulose |
| Liquor | 309,216 | Residual water, diluted lignin and NaOH at 95.4, 2.5 and 2.1%, respectively. | |
| Xylitol plant | Xylitol | 5186.3 | Xylitol at 97.8% |
| Residual CO2 | 890.5 | Stream containing CO2 at 100% | |
| Residual biomass | 950.3 | Residual biomass (Candida guilliermondii yeast) | |
| Residual water | 91,199.5 | Residual water at 99.8% | |
| Molasses | 4780.9 | Residual stream containing 86.6% of protein, 2.4% of organic acids, 7.8% of xylitol and 3.1% of xylose | |
| Glucose plant | Glucose | 93,732.3 | Stream containing 4.5% of glucose |
| Solids | 4450.8 | Stream containing 11.9, 18, 23.6% of cellulose, hemicellulose and lignin, respectively | |
| Ethanol plant | Ethanol | 1636.6 | Ethanol at 99.95% |
| Remaining glucose | 87,869 | Remaining glucose at 1.9% | |
| Residual biomass | 1447.6 | Residual biomass (Zymomonas mobilis yeast) | |
| Residual CO2 | 88.97 | Stream containing CO2 at 100% | |
| Residual water | 3363.4 | Residual water at 98.4% | |
| PHB plant | PHB | 526.6 | PHB at 99% |
| Residual water | 86,173 | Residual water at 99.92% | |
| Residual biomass | 1173.1 | Residual biomass (Cupriavidus necatur yeast) | |
| Water plant | Treated water | 258,177 | Filtered water (99.94%) |
| Solids | 606.2 | Separated solids containing 38.7 and 61.2% of organic acids and protein respectively | |
| Gasification plant | Gases | 7668.1 | Gases containing 3.9, 23.7, 71.1 and 0.7% of CO2, methane, CO and nitrogen, respectively |
| Ash | 353.7 | Streams containing ash (100%) |
DownLoad: CSVThe production capacity and yields obtained from the simulation of the biorefinery to produce xylitol, ethanol and PHB are presented in Table 5. Ethanol was obtained at 99.5% (anhydrous ethanol) while xylitol and PHB were obtained at 97.8 and 99%, respectively. The purity of xylitol is governed by its solubility in ethanol that allows obtaining efficiency of up to 92%, as not all the xylitol can be crystallized [19]. It has to be noted that the above-stated yield could be reached because the use of alkaline treatment that released cellulose fibers through delignification (lignin removal) without degrading or removing the main cell wall polysaccharide constituents [17]. Yet additionally, the alkaline process was also effective in removing up to 54% of the hemicellulose from the pretreated material (BSG) [17].
| Product | Production rate | Processing yield | ||
| Value | Unit | Value | Unit | |
| Xylitol | 121.8 | t/day | 101.53 | kg Xylitol/t BSG |
| 974,400 | t/year | |||
| Ethanol | 39.26 | t/day | 32.73 | kg Ethanol/t BSG |
| 314,080 | t/year | |||
| PHB | 12.64 | t/day | 10.53 | kg PHB/t BSG |
| 101,120 | t/year |
DownLoad: CSVResults shown in Table 5 indicated that xylitol has a high production capacity in comparison to those of ethanol and PHB. This can be attributed to the relatively high holocellulose content of BSG that accounts for about 48.65% of its dry mass [2]. Additionally, 1996 kWh of electricity that is generated in the gasification plant can meet the electricity demand of the biorefinery (1238 kWh). Results of the analysis indicates that, the gasification plant can cover all energy requirements of the biorefinery and produce a surplus of 37.97% that can be either utilized in other processes or sold to the grid. This fact clearly demonstrates the potential use of biomass that can be recovered from biorefinery operations as a good source of electricity, as previously suggested [30].
The yield obtained for xylitol (101.5 kg xylitol/t of BSG) is in agreement with a yield of 103.8 kg of xylitol/t of BSG that has been reported earlier [24]. A yield of about 31.5 kg of PHB/t of banana processing was reported [31] and is higher than that obtained in the present study from BSG (10.53 kg of PHB/t of BSG). The latter could be attributed to the high starch content of banana [31]. The yield of ethanol production that was obtained in the present study (32.73 kg ethanol/t BSG) is lower than those reported for utilization of other agro-industrial wastes, such as sugarcane bagasse and rice husk that yield 58.38 and 177.5 kg of ethanol/t of agro-industrial waste, respectively [10]. The difference can be attributed to the relatively low cellulose content of BSG (9.32 %) in comparison to 34.8 and 26% in sugarcane bagasse and rice husk, respectively.
The distribution of the considered cost, for each one of the constituent plants, according to the economic analysis is presented in Table 6. The costs associated with pretreatment, glucose, gasification and water treatment plants were calculated for xylitol, ethanol and PHB plants and charged to them based on the chemical composition aspects and flow rates relevant to each of these plants as depicted in Table 7.
| Item | Xylitol plant | Ethanol plant | PHB plant | |||
| Share (%) | Cost (Million USD/year) | Share (%) | Cost (Million USD/year) | Share (%) | Cost (Million USD/year) | |
| General and administrative costs | 10.88 | 6.311 | 0.01 | 0.001 | 10.73 | 6.212 |
| Plant overhead | 0.23 | 0.134 | 0.12 | 0.219 | 0.23 | 0.132 |
| Operating charges | 0.02 | 0.010 | 0.01 | 0.016 | 0.02 | 0.010 |
| Maintenance costs | 0.39 | 0.228 | 0.20 | 0.371 | 0.39 | 0.224 |
| Operating labor costs | 0.07 | 0.041 | 0.04 | 0.067 | 0.07 | 0.040 |
| Total utilities costs | 55.37 | 32.140 | 86.04 | 160.040 | 59.71 | 34.581 |
| Total raw material costs | 30.90 | 17.940 | 12.49 | 23.227 | 26.74 | 15.485 |
| Depreciation expense | 2.14 | 1.242 | 1.09 | 2.021 | 2.11 | 1.223 |
| Total | 100 | 58.046 | 100 | 185.962 | 100 | 57.907 |
DownLoad: CSV| Plant | Plant that assume the cost | % Assumed | Reason |
| Pretreatment | Xylitol plant | 16 | For hemicellulose fraction used for xylose production and subsequent xylitol production |
| Ethanol plant | 26 | For cellulose and lignin fractions that are processed for the glucose plant and later for the ethanol plant | |
| Both, xylitol and ethanol plants | 58 | For the remaining fraction (ash, protein, extractives and moisture) | |
| Glucose | Ethanol plant | 60 | For the fraction of glucose used by ethanol plant |
| PHB plant | 40 | For the remaining fraction of glucose used by PHB plant | |
| Gasification | Xylitol plant | 30 | Because this plants consumes around 30% of the total energy requirements |
| Ethanol plant | 40 | Because this plant consumes around 40% of the total energy requirements | |
| PHB plant | 30 | Because this plants consumes around 30% of the total energy requirements | |
| Water treatment | Xylitol, ethanol and PHB plants | 100 | The cost of water treatment plant was assumed for the three plants in the same percentage because all of these generate residual water |
DownLoad: CSVResults indicated that cost of utilities consumption ranges from 55 to 86% of the overall production cost of the investigated products and is therefore the most significant impacting parameter. The latter highlights the need to consider heat integration as a strategy that is aimed at reducing the total production cost. This strategy is inherent to the Pinch methodology, which uses the composite curves diagram to integrate cold and hot streams in the biorefinery [14]. This approach is reflected in the two scenarios that were analyzed, one with and the other without heat integration (scenarios 1 and 2 respectively). Figure 2 shows the total production cost for both scenarios in comparison to market prices [12,26,28].
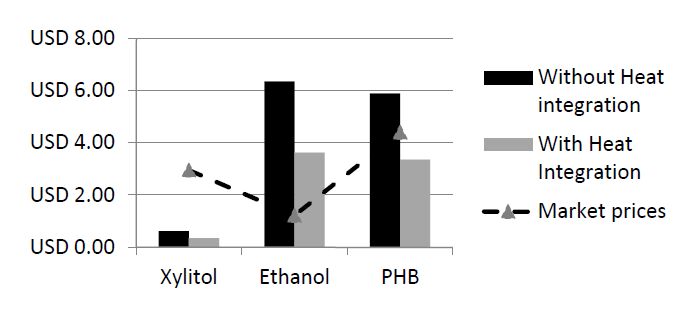 Figure 2. Total production cost (USD/kg) for each product of the biorefinery. Market prices taken from [12,26,28].
Results from Figure 2 indicated that, the fuel ethanol production plant is not economically viable, regardless of heat integration. The cost of fuel ethanol production in a process that includes heat integration is 3.62 USD/kg (2.39 USD/L) and is significantly higher than the typical sale price of this product 0.94 USD/L [28]. This result is in accord with the fact that large-scale commercial production of fuel bioethanol from lignocellulosic materials has not been implemented yet due to economic challenges [32]. However, it has to be noted that the ethanol production cost in scenario 2 is 43% lower than that without heat integration (scenario 1), thus indicating that heat integration has an important impact on the final production cost of fuel ethanol. The effect of heat integration on the overall cost of production reflects the large impact of the energy-consuming units operations, separation and purification on the production cost [33].
Total production cost for xylitol (0.35 USD/kg with heat integration) was lower than its market price 2.95 USD/kg [26], regardless of heat integration scenario. Similar to what was observed with the ethanol plant, the heat integration scenario resulted in 43% cost reduction. Similarly, the total production cost of PHB according to scenario 2 (3.36 USD/kg) was lower than the market price of this product 4.4 USD/kg [12]. However, production cost of PHB according to scenario 1 (5.89 USD/kg) was higher than the market price of PHB, thus rendering the process economically not feasible.
Other studies have demonstrated that an integration of a cogeneration system such as gasification can lower the utilities cost of a process [29]. It has been reported that generation of electricity in ethanol plant can lower the cost of ethanol production from lignocellulosic biomass [10]. It has been demonstrated that the cost of ethanol production from coffee cut-stems requires, due to the high utilities cost, a cogeneration system in order to meet the energy consumption in the process [10,20]. Overall, results of the analysis suggested that even with low cost of lignocellulosic material (BSG), ethanol production would require subsidies or an integrated cogeneration system in order to achieve an economic viability.
Table 8 shows the leaving Potential Environmental Impact (PEI) per kg of each product, for both heat-related scenarios. When heat integration was included (Scenario 1) it was possible to mitigate all environmental impact categories in comparison to scenario without heat integration (Scenario 2). Some environmental categories such as human toxicity potential by ingestion (HTPI), human toxicity potential by exposure (HTPE) and toxicity terrestrial potential (TTP) were affected by the generated solid and liquid wastes, such as Na2SO4 from neutralization in pretreatment plant and black liquor from the glucose plant. These categories were affected equally for both scenarios. This suggests that without mass integration in a biorefinery, the PEI cannot be reduced [14].
| Impact category | PEI/kg of product | |
| Scenario 1 | Scenario 2 | |
| HTPE | 1.26 × 10⁻² | 1.26 × 10⁻² |
| HTPE | 5.52 × 10⁻³ | 5.52 × 10⁻³ |
| TTP | 1.26 × 10⁻² | 1.26 × 10⁻² |
| ATP | 1.59 × 10⁻⁴ | 2.69 × 10⁻⁴ |
| GWP | 5.51 × 10⁻⁵ | 6.93 × 10⁻⁴ |
| ODP | 1.66 × 10⁻¹⁰ | 2.59 × 10⁻⁹ |
| PCOP | 1.30 × 10⁻⁵ | 1.35 × 10⁻⁵ |
| AP | 4.54 × 10⁻⁴ | 7.07 × 10⁻³ |
| TOTAL | 3.14 × 10⁻² | 8.88 × 10⁻² |
DownLoad: CSVResults indicated that the acidification potential (AP) category was affected significantly by the gases leaving the biorefinery. This is because the acidification potential (AP) is influenced mainly by the energy requirements which are related to external fuels [24]. However, the CO2 produced from fermentation processes in the ethanol, xylitol and PHB plants contribute significantly to the acidification potential (AP) category therefore, it is necessary to consider capturing and adequately using of this gas, for example by integrating the CO2 in a microalgae production process [29]. As a consequence of the heat integration, a minimization on the total PEI was accomplished and highlighted the value of heat integration approach in lowering the overall energy consumption in the biorefinery [14,24]. Although scenario 1 did not allow mitigating the total PEI completely, it was effective in lowering the total PEI. Results thus demonstrated the contribution of heat integration approach to a better environmental development.
Results indicated that heat integration strategy had both environmental and economic implications. It allowed (in the investigated configurations) significantly lowering the PEI, and contributed to a significant reduction (by 43%) of the total production cost for all proposed products.
Results from this study revealed that a heat integration strategy has to be applied for a biorefinery based on BSG to produce xylitol, ethanol and polyhydroxybutyrate. It has been demonstrated that possible reduction of 43% of the total production cost. Results demonstrated that both ethanol and xylitol are not economically feasible in standalone manner but when a biorefinery approach is applied; those compounds become attractive products from an economic point of view. The application of heat integration also provided opportunities to improve the environmental development of the biorefinery by reducing the external fuels.
All authors declare no conflicts of interest in this paper.
| [1] |
Van der Linden MC, van den Brand CL, van der Linden N, et al. (2014) Rate, characteristics, and factors associated with high emergency department utilization. Int J Emerg Med 7: 9. doi: 10.1186/1865-1380-7-9

|
| [2] | Jayaprakash N, O'Sullivan R, Bey T, et al. (2009) Crowding and delivery of healthcare in emergency departments: the European perspective. West J Emerg Med 10: 233–239. |
| [3] |
Hoot NR, Aronsky D (2008) Systematic review of emergency department crowding: causes, effects, and solutions. Ann Emerg Med 52: 126–136. doi: 10.1016/j.annemergmed.2008.03.014
|
| [4] |
Carret ML, Fassa AC, Domingues MR (2009) Inappropriate Use of Emergency Services: A Systematic Review of Prevalence and Associated Factors. Cadernos de Saúde Pública 25:7–28. doi: 10.1590/S0102-311X2009000100002
|
| [5] |
Hastings NS, Whitson HE, Sloane R, et al. (2014) Using the past to predict the future: latent class analysis of patterns of health service use among older emergency department patients. J Am Geriatr Soc 62: 711–715. doi: 10.1111/jgs.12746
|
| [6] | Italian National Institute of Statistics–ISTAT, 2016. Available from: http://demo.istat.it/pop2016/index.html (last access on March 10, 2018). |
| [7] |
Schneider SM, Gallery ME, Schafermayer R, et al. (2003) Emergency department crowding: A Point in Time. Ann Emerg Med 42: 167–172. doi: 10.1067/mem.2003.258
|
| [8] | R Core Team (2016) R: a language and environment for statistical computing. R Foundation for Statistical Computing, Vienna, Austria. |
| [9] |
Falagas ME, Karageorgopoulos DE, Moraitis LI, et al. (2009) Seasonality of mortality: the September phenomenon in Mediterranean countries. CMAJ 181: 484–486. doi: 10.1503/cmaj.090694
|
| [10] | National Institute of Heatlh. Influnet: epidemiological surveillance. Available from: https://old.iss.it/site/RMI/influnet/pagine/rapportoInflunet.aspx (accessed on February 1, 2018). |
| [11] |
Amodio E, Tramuto F, Costantino C, et al. (2014) Diagnosis of Influenza: Only a Problem of Coding? Med Princ Pract 23: 568–573. doi: 10.1159/000364780
|
| [12] | Amodio E, Anastasi G, Di Pasquale M, et al. (2010) Influenza vaccination among healthcare workers and absenteeism from work due to influenza-like illness in a teaching hospital in Palermo. Ital J Public Health 3: 311–318. |
| [13] |
Tramuto F, Maida CM, Napoli G, et al. (2016) Burden and viral aetiology of influenza-like illness and acute respiratory infection in intensive care units. Microbes Infect 18: 270–276. doi: 10.1016/j.micinf.2015.11.008
|
| [14] |
Muscatello DJ, Bein KJ, Dinh MM (2017) Emergency Department demand associated with seasonal influenza, 2010 through 2014, New South Wales, Australia. Western Pac Surveill Response J 8: 11–20. doi: 10.5365/wpsar.2017.8.2.002
|
| [15] |
Beysard N, Yersin B, Meylan P, et al. (2018) Impact of the 2014-2015 influenza season on the activity of an academic emergency department. Intern Emerg Med 13: 251–256. doi: 10.1007/s11739-017-1606-z
|
| [16] |
Legramante JM, Morciano L, Lucaroni F, et al. (2016) Frequent Use of Emergency Departments by the Elderly Population When Continuing Care Is Not Well Established. PLoS One 11: e0165939. doi: 10.1371/journal.pone.0165939
|
| [17] |
Pines JM, Bernstein SL (2015) Solving the worldwide emergency department crowding problem – what can we learn from an Israeli ED? Isr J Health Policy Res 4: 52. doi: 10.1186/s13584-015-0049-0
|
| [18] |
Quinn JV, Mahadevan SV, Eggers G, et al. (2007) Effects of implementing a rapid admission policy in the ED. Am J Emerg 25: 559–563. doi: 10.1016/j.ajem.2006.11.034
|
| [19] |
Fatovich DM, Nagree Y, Sprivulis P (2005) Access block causes emergency department overcrowding and ambulance diversion in Perth, Western Australia. Emerg Med J 22: 351–354. doi: 10.1136/emj.2004.018002
|
| [20] |
Patel PB, Combs MA, Vinson DR (2014) Reduction of admit wait times: the effect of a leadership-based program. Acad Emerg Med 21: 266–273. doi: 10.1111/acem.12327
|
| [21] |
Kelen GD, Scheulen JJ, Hill PM (2001) Effect of an emergency department (ED) managed acute care unit on ED overcrowding and emergency medical services diversion. Acad Emerg 8: 1095–1100. doi: 10.1111/j.1553-2712.2001.tb01122.x
|
| [22] |
Moloney ED, Smith D, Bennett K, et al. (2005) Impact of an acute medical admission unit onlength of hospital stay, and emergency department 'wait times'. QJM 98: 283–289. doi: 10.1093/qjmed/hci044
|
| [23] |
George G, Jell C, Todd BS (2006) Effect of population ageing on emergency department speed and efficiency: a historical perspective from a district general hospital in the UK. Emerg Med J 23: 379–383. doi: 10.1136/emj.2005.029793
|
| [24] |
Sun BC, Hsia RY, Weiss RE, et al. (2013) Effect of emergency department crowding on outcomes of admitted patients. Ann Emerg Med 61: 605–611. doi: 10.1016/j.annemergmed.2012.10.026
|
| [25] |
Geelhoed GC, de Klerk NH (2012) Emergency department overcrowding, mortality and the 4-hour rule in Western Australia. Med J Aust 196: 122–126. doi: 10.5694/mja11.11159
|
| [26] |
Singer AJ, Thode HC Jr, Viccellio P, et al. (2011) The association between length of emergency department boarding and mortality. Acad Emerg Med 18: 1324–1329. doi: 10.1111/j.1553-2712.2011.01236.x
|
| 1. | Siti Nur Athirah Aisyah Abu Bakar, Asma’ Ali, Abdul Rais Abdul Rahman, Abbe Maleyki Mhd Jalil, Noor Salihah Zakaria, Unraveling the Sugar Rush: A Cross-sectional Study of Knowledge, Attitudes, and Practices Related to Sugar- Sweetened Beverages Consumption among Malaysian Young Adults, 2024, 20, 1675-8544, 152, 10.47836/mjmhs.20.1.20 | |
| 2. | Soft Drink Consumption Patterns of Middle School Students in North Okkalarpa, 2021, 25, 23563664, 10.7454/msk.v25i1.1258 | |
| 3. | Laxmi Gautam, Milan Thapa, Poonam Pokhrel, Parash Mani Sapkota, Anjali Bhatt, Kiran Paudel, Cross-sectional study on behavioural determinants associated with sugary foods and beverages and their correlates with body mass index among adolescents in Nagarjun municipality, Nepal, 2024, 14, 2044-6055, e086755, 10.1136/bmjopen-2024-086755 |

Emanuele Amodio, Luca Cavalieri d’Oro, Elisabetta Chiarazzo, Carlo Picco, Maurizio Migliori, Isabella Trezzi, Silvano Lopez, Oliviero Rinaldi, Massimo Giupponi. Emergency department performances during overcrowding: the experience of the health protection agency of Brianza[J]. AIMS Public Health, 2018, 5(3): 217-224. doi: 10.3934/publichealth.2018.3.217

| Component | Proportion (%, w/w) |
| Cellulose | 9.32 |
| Hemicellulose | 15.79 |
| Lignin | 15.43 |
| Ash | 2.6 |
| Protein | 8.47 |
| Extractives | 3.99 |
| Water | 44.4 |
DownLoad: CSV| Unit | Purpose | Conditions and unit specifications | Method | Assumptions |
| PRETREATMENT PLANT | ||||
| Dryer | Drying to 10% moisture | 80 °C, 1 bar | NRTL * | No |
| Atmospheric dryer | ||||
| Mill | Size reduction to 0.45 mm | 1 bar, Jaw mill | N.A. | N.A. |
| Acid hydrolysis | Enhancing the efficiency of recovering cellulose and xylose | 120 °C, 1 bar, (1.25% w/v of H2SO4) | NRTL | Low production of glucose, HMF and acids (Levunilic and formic) |
| Agitated tank enclosed | ||||
| Cellulose + water = Glucose (Conversion = 1%) | ||||
| Hemicellulose + water = xylose (Conversion = 93%) | ||||
| Glucose = HMF + 3 water (Conversion = 1%) | ||||
| HMF + 2 water = L.A + F.A. (Conversion = 1%) | ||||
| Xylose = 3 water + Furfural (Conversion=20%) | ||||
| Neutralization | Neutralization of acid | 120 °C, 1 bar | NRTL | N.A. |
| GLUCOSE PLANT | ||||
| Delignification | Removing lignin | 120 °C, (2% w/v) | NRTL | N.A. |
| Enzymatic hydrolysis | Glucose production | 45 °C, 1 bar, 7% (wt) enzyme/substrate of 45 | User model (Yields from literature) | Yield of 0.6 g/g from [8] |
| Agitated tank enclosed | ||||
| XYLITOL PLANT | ||||
| Evaporation | Removing part of the water (Concentration of xylose) | 121 °C, 1 bar (until 70 gr/L) | NRTL-HOC | N.A. |
| Standard tube vertical evaporator, one effect | ||||
| Fermentation | Production of Xylitol | 30 °C. Candida guilliermondii | User model (Yields from literature) | [15] |
| Crystallizer | Xylitol crystallization | 40 °C, Ethanol at 95.3% | NRTL | N.A. |
| ETHANOL PLANT | ||||
| Fermentation | Ethanol production | 30 °C, Zymomonas mobilis | User model (Yields from literature) | [16] |
| Distillation columns | Ethanol separation | Distillation: 18 trays, 2.5 reflux ratio, total condenser | NRTL-HOC | N.A. |
| Rectification: 12 trays, 1.8 reflux ratio, total condenser | ||||
| PHB PLANT | ||||
| Fermentation | PHB production | 30 °C. Cupriavidus necatur | User model (Yields from literature) | Use of glucose content in the stillage |
| Crystallization | Solid PHB formation | 30 °C, 1 bar. | NRTL | N.A. |
| Evaporation | PHB concentration | 80 °C, 1 bar. | NRTL | N.A. |
| GASIFICATION PLANT | ||||
| Gasifier | Syngas generation | 900 °C, 60 bar | NRTL-HOC | N.A. |
| Turbine | Electricity generation | 1 bar, 70% efficiency | NRTL-HOC | N.A. |
| WATER TREATMENT PLANT | ||||
| Filter | Removing particles from water | 15 °C, 1 bar | NRTL-HOC | N.A. |
| * NRTL corresponds to Non-Random Two Liquids model for activity coefficients calculation | ||||
DownLoad: CSV| Item | Price | Unit |
| BSG a | 21 | USD/t |
| Water b | 1.25 | USD/m3 |
| Sulfuric acid c | 0.094 | USD/kg |
| Sodium hydroxide c | 0.098 | USD/kg |
| Enzyme d | 10 | USD/kg |
| Operator labor cost b | 2.14 | USD/h |
| Supervisor labor cost b | 4.19 | USD/h |
| Electricity cost b | 0.1 | USD/kWh |
| *Fuel e | 7.28 | USD/MMBTU |
| Ethanol at 99.5% f | 0.94 | USD/L |
| * MMBTU means one million BTU aCalculated for transportation over a distance of 140 km with a truck of three axes. bTypical price in Colombia. c Taken from ICIS Prices [25] d Prices based on Alibaba International Prices [26] eEstimated cost of Gas for the years 2015-2035 [27] fNational price in Colombia [28] | ||
DownLoad: CSV| Plant | Outlet streams | Target product and composition | |
| Stream | Flow (kg/h) | ||
| Pretreatment plant | Xylose | 103,011 | Xylose at 6.8% |
| Residual water | 78,047 | Water at 99.6% | |
| Solid to pulping | 15,849 | Solid containing 32% of cellulose | |
| Sulphate | 3584.8 | Na2SO4 at 99% | |
| Pulping plant | Cellulose | 8133.5 | Solid containing 68% of cellulose |
| Liquor | 309,216 | Residual water, diluted lignin and NaOH at 95.4, 2.5 and 2.1%, respectively. | |
| Xylitol plant | Xylitol | 5186.3 | Xylitol at 97.8% |
| Residual CO2 | 890.5 | Stream containing CO2 at 100% | |
| Residual biomass | 950.3 | Residual biomass (Candida guilliermondii yeast) | |
| Residual water | 91,199.5 | Residual water at 99.8% | |
| Molasses | 4780.9 | Residual stream containing 86.6% of protein, 2.4% of organic acids, 7.8% of xylitol and 3.1% of xylose | |
| Glucose plant | Glucose | 93,732.3 | Stream containing 4.5% of glucose |
| Solids | 4450.8 | Stream containing 11.9, 18, 23.6% of cellulose, hemicellulose and lignin, respectively | |
| Ethanol plant | Ethanol | 1636.6 | Ethanol at 99.95% |
| Remaining glucose | 87,869 | Remaining glucose at 1.9% | |
| Residual biomass | 1447.6 | Residual biomass (Zymomonas mobilis yeast) | |
| Residual CO2 | 88.97 | Stream containing CO2 at 100% | |
| Residual water | 3363.4 | Residual water at 98.4% | |
| PHB plant | PHB | 526.6 | PHB at 99% |
| Residual water | 86,173 | Residual water at 99.92% | |
| Residual biomass | 1173.1 | Residual biomass (Cupriavidus necatur yeast) | |
| Water plant | Treated water | 258,177 | Filtered water (99.94%) |
| Solids | 606.2 | Separated solids containing 38.7 and 61.2% of organic acids and protein respectively | |
| Gasification plant | Gases | 7668.1 | Gases containing 3.9, 23.7, 71.1 and 0.7% of CO2, methane, CO and nitrogen, respectively |
| Ash | 353.7 | Streams containing ash (100%) |
DownLoad: CSV| Product | Production rate | Processing yield | ||
| Value | Unit | Value | Unit | |
| Xylitol | 121.8 | t/day | 101.53 | kg Xylitol/t BSG |
| 974,400 | t/year | |||
| Ethanol | 39.26 | t/day | 32.73 | kg Ethanol/t BSG |
| 314,080 | t/year | |||
| PHB | 12.64 | t/day | 10.53 | kg PHB/t BSG |
| 101,120 | t/year |
DownLoad: CSV| Item | Xylitol plant | Ethanol plant | PHB plant | |||
| Share (%) | Cost (Million USD/year) | Share (%) | Cost (Million USD/year) | Share (%) | Cost (Million USD/year) | |
| General and administrative costs | 10.88 | 6.311 | 0.01 | 0.001 | 10.73 | 6.212 |
| Plant overhead | 0.23 | 0.134 | 0.12 | 0.219 | 0.23 | 0.132 |
| Operating charges | 0.02 | 0.010 | 0.01 | 0.016 | 0.02 | 0.010 |
| Maintenance costs | 0.39 | 0.228 | 0.20 | 0.371 | 0.39 | 0.224 |
| Operating labor costs | 0.07 | 0.041 | 0.04 | 0.067 | 0.07 | 0.040 |
| Total utilities costs | 55.37 | 32.140 | 86.04 | 160.040 | 59.71 | 34.581 |
| Total raw material costs | 30.90 | 17.940 | 12.49 | 23.227 | 26.74 | 15.485 |
| Depreciation expense | 2.14 | 1.242 | 1.09 | 2.021 | 2.11 | 1.223 |
| Total | 100 | 58.046 | 100 | 185.962 | 100 | 57.907 |
DownLoad: CSV| Plant | Plant that assume the cost | % Assumed | Reason |
| Pretreatment | Xylitol plant | 16 | For hemicellulose fraction used for xylose production and subsequent xylitol production |
| Ethanol plant | 26 | For cellulose and lignin fractions that are processed for the glucose plant and later for the ethanol plant | |
| Both, xylitol and ethanol plants | 58 | For the remaining fraction (ash, protein, extractives and moisture) | |
| Glucose | Ethanol plant | 60 | For the fraction of glucose used by ethanol plant |
| PHB plant | 40 | For the remaining fraction of glucose used by PHB plant | |
| Gasification | Xylitol plant | 30 | Because this plants consumes around 30% of the total energy requirements |
| Ethanol plant | 40 | Because this plant consumes around 40% of the total energy requirements | |
| PHB plant | 30 | Because this plants consumes around 30% of the total energy requirements | |
| Water treatment | Xylitol, ethanol and PHB plants | 100 | The cost of water treatment plant was assumed for the three plants in the same percentage because all of these generate residual water |
DownLoad: CSV| Impact category | PEI/kg of product | |
| Scenario 1 | Scenario 2 | |
| HTPE | 1.26 × 10⁻² | 1.26 × 10⁻² |
| HTPE | 5.52 × 10⁻³ | 5.52 × 10⁻³ |
| TTP | 1.26 × 10⁻² | 1.26 × 10⁻² |
| ATP | 1.59 × 10⁻⁴ | 2.69 × 10⁻⁴ |
| GWP | 5.51 × 10⁻⁵ | 6.93 × 10⁻⁴ |
| ODP | 1.66 × 10⁻¹⁰ | 2.59 × 10⁻⁹ |
| PCOP | 1.30 × 10⁻⁵ | 1.35 × 10⁻⁵ |
| AP | 4.54 × 10⁻⁴ | 7.07 × 10⁻³ |
| TOTAL | 3.14 × 10⁻² | 8.88 × 10⁻² |
DownLoad: CSV| Component | Proportion (%, w/w) |
| Cellulose | 9.32 |
| Hemicellulose | 15.79 |
| Lignin | 15.43 |
| Ash | 2.6 |
| Protein | 8.47 |
| Extractives | 3.99 |
| Water | 44.4 |
| Unit | Purpose | Conditions and unit specifications | Method | Assumptions |
| PRETREATMENT PLANT | ||||
| Dryer | Drying to 10% moisture | 80 °C, 1 bar | NRTL * | No |
| Atmospheric dryer | ||||
| Mill | Size reduction to 0.45 mm | 1 bar, Jaw mill | N.A. | N.A. |
| Acid hydrolysis | Enhancing the efficiency of recovering cellulose and xylose | 120 °C, 1 bar, (1.25% w/v of H2SO4) | NRTL | Low production of glucose, HMF and acids (Levunilic and formic) |
| Agitated tank enclosed | ||||
| Cellulose + water = Glucose (Conversion = 1%) | ||||
| Hemicellulose + water = xylose (Conversion = 93%) | ||||
| Glucose = HMF + 3 water (Conversion = 1%) | ||||
| HMF + 2 water = L.A + F.A. (Conversion = 1%) | ||||
| Xylose = 3 water + Furfural (Conversion=20%) | ||||
| Neutralization | Neutralization of acid | 120 °C, 1 bar | NRTL | N.A. |
| GLUCOSE PLANT | ||||
| Delignification | Removing lignin | 120 °C, (2% w/v) | NRTL | N.A. |
| Enzymatic hydrolysis | Glucose production | 45 °C, 1 bar, 7% (wt) enzyme/substrate of 45 | User model (Yields from literature) | Yield of 0.6 g/g from [8] |
| Agitated tank enclosed | ||||
| XYLITOL PLANT | ||||
| Evaporation | Removing part of the water (Concentration of xylose) | 121 °C, 1 bar (until 70 gr/L) | NRTL-HOC | N.A. |
| Standard tube vertical evaporator, one effect | ||||
| Fermentation | Production of Xylitol | 30 °C. Candida guilliermondii | User model (Yields from literature) | [15] |
| Crystallizer | Xylitol crystallization | 40 °C, Ethanol at 95.3% | NRTL | N.A. |
| ETHANOL PLANT | ||||
| Fermentation | Ethanol production | 30 °C, Zymomonas mobilis | User model (Yields from literature) | [16] |
| Distillation columns | Ethanol separation | Distillation: 18 trays, 2.5 reflux ratio, total condenser | NRTL-HOC | N.A. |
| Rectification: 12 trays, 1.8 reflux ratio, total condenser | ||||
| PHB PLANT | ||||
| Fermentation | PHB production | 30 °C. Cupriavidus necatur | User model (Yields from literature) | Use of glucose content in the stillage |
| Crystallization | Solid PHB formation | 30 °C, 1 bar. | NRTL | N.A. |
| Evaporation | PHB concentration | 80 °C, 1 bar. | NRTL | N.A. |
| GASIFICATION PLANT | ||||
| Gasifier | Syngas generation | 900 °C, 60 bar | NRTL-HOC | N.A. |
| Turbine | Electricity generation | 1 bar, 70% efficiency | NRTL-HOC | N.A. |
| WATER TREATMENT PLANT | ||||
| Filter | Removing particles from water | 15 °C, 1 bar | NRTL-HOC | N.A. |
| * NRTL corresponds to Non-Random Two Liquids model for activity coefficients calculation | ||||
| Item | Price | Unit |
| BSG a | 21 | USD/t |
| Water b | 1.25 | USD/m3 |
| Sulfuric acid c | 0.094 | USD/kg |
| Sodium hydroxide c | 0.098 | USD/kg |
| Enzyme d | 10 | USD/kg |
| Operator labor cost b | 2.14 | USD/h |
| Supervisor labor cost b | 4.19 | USD/h |
| Electricity cost b | 0.1 | USD/kWh |
| *Fuel e | 7.28 | USD/MMBTU |
| Ethanol at 99.5% f | 0.94 | USD/L |
| * MMBTU means one million BTU aCalculated for transportation over a distance of 140 km with a truck of three axes. bTypical price in Colombia. c Taken from ICIS Prices [25] d Prices based on Alibaba International Prices [26] eEstimated cost of Gas for the years 2015-2035 [27] fNational price in Colombia [28] | ||
| Plant | Outlet streams | Target product and composition | |
| Stream | Flow (kg/h) | ||
| Pretreatment plant | Xylose | 103,011 | Xylose at 6.8% |
| Residual water | 78,047 | Water at 99.6% | |
| Solid to pulping | 15,849 | Solid containing 32% of cellulose | |
| Sulphate | 3584.8 | Na2SO4 at 99% | |
| Pulping plant | Cellulose | 8133.5 | Solid containing 68% of cellulose |
| Liquor | 309,216 | Residual water, diluted lignin and NaOH at 95.4, 2.5 and 2.1%, respectively. | |
| Xylitol plant | Xylitol | 5186.3 | Xylitol at 97.8% |
| Residual CO2 | 890.5 | Stream containing CO2 at 100% | |
| Residual biomass | 950.3 | Residual biomass (Candida guilliermondii yeast) | |
| Residual water | 91,199.5 | Residual water at 99.8% | |
| Molasses | 4780.9 | Residual stream containing 86.6% of protein, 2.4% of organic acids, 7.8% of xylitol and 3.1% of xylose | |
| Glucose plant | Glucose | 93,732.3 | Stream containing 4.5% of glucose |
| Solids | 4450.8 | Stream containing 11.9, 18, 23.6% of cellulose, hemicellulose and lignin, respectively | |
| Ethanol plant | Ethanol | 1636.6 | Ethanol at 99.95% |
| Remaining glucose | 87,869 | Remaining glucose at 1.9% | |
| Residual biomass | 1447.6 | Residual biomass (Zymomonas mobilis yeast) | |
| Residual CO2 | 88.97 | Stream containing CO2 at 100% | |
| Residual water | 3363.4 | Residual water at 98.4% | |
| PHB plant | PHB | 526.6 | PHB at 99% |
| Residual water | 86,173 | Residual water at 99.92% | |
| Residual biomass | 1173.1 | Residual biomass (Cupriavidus necatur yeast) | |
| Water plant | Treated water | 258,177 | Filtered water (99.94%) |
| Solids | 606.2 | Separated solids containing 38.7 and 61.2% of organic acids and protein respectively | |
| Gasification plant | Gases | 7668.1 | Gases containing 3.9, 23.7, 71.1 and 0.7% of CO2, methane, CO and nitrogen, respectively |
| Ash | 353.7 | Streams containing ash (100%) |
| Product | Production rate | Processing yield | ||
| Value | Unit | Value | Unit | |
| Xylitol | 121.8 | t/day | 101.53 | kg Xylitol/t BSG |
| 974,400 | t/year | |||
| Ethanol | 39.26 | t/day | 32.73 | kg Ethanol/t BSG |
| 314,080 | t/year | |||
| PHB | 12.64 | t/day | 10.53 | kg PHB/t BSG |
| 101,120 | t/year |
| Item | Xylitol plant | Ethanol plant | PHB plant | |||
| Share (%) | Cost (Million USD/year) | Share (%) | Cost (Million USD/year) | Share (%) | Cost (Million USD/year) | |
| General and administrative costs | 10.88 | 6.311 | 0.01 | 0.001 | 10.73 | 6.212 |
| Plant overhead | 0.23 | 0.134 | 0.12 | 0.219 | 0.23 | 0.132 |
| Operating charges | 0.02 | 0.010 | 0.01 | 0.016 | 0.02 | 0.010 |
| Maintenance costs | 0.39 | 0.228 | 0.20 | 0.371 | 0.39 | 0.224 |
| Operating labor costs | 0.07 | 0.041 | 0.04 | 0.067 | 0.07 | 0.040 |
| Total utilities costs | 55.37 | 32.140 | 86.04 | 160.040 | 59.71 | 34.581 |
| Total raw material costs | 30.90 | 17.940 | 12.49 | 23.227 | 26.74 | 15.485 |
| Depreciation expense | 2.14 | 1.242 | 1.09 | 2.021 | 2.11 | 1.223 |
| Total | 100 | 58.046 | 100 | 185.962 | 100 | 57.907 |
| Plant | Plant that assume the cost | % Assumed | Reason |
| Pretreatment | Xylitol plant | 16 | For hemicellulose fraction used for xylose production and subsequent xylitol production |
| Ethanol plant | 26 | For cellulose and lignin fractions that are processed for the glucose plant and later for the ethanol plant | |
| Both, xylitol and ethanol plants | 58 | For the remaining fraction (ash, protein, extractives and moisture) | |
| Glucose | Ethanol plant | 60 | For the fraction of glucose used by ethanol plant |
| PHB plant | 40 | For the remaining fraction of glucose used by PHB plant | |
| Gasification | Xylitol plant | 30 | Because this plants consumes around 30% of the total energy requirements |
| Ethanol plant | 40 | Because this plant consumes around 40% of the total energy requirements | |
| PHB plant | 30 | Because this plants consumes around 30% of the total energy requirements | |
| Water treatment | Xylitol, ethanol and PHB plants | 100 | The cost of water treatment plant was assumed for the three plants in the same percentage because all of these generate residual water |
| Impact category | PEI/kg of product | |
| Scenario 1 | Scenario 2 | |
| HTPE | 1.26 × 10⁻² | 1.26 × 10⁻² |
| HTPE | 5.52 × 10⁻³ | 5.52 × 10⁻³ |
| TTP | 1.26 × 10⁻² | 1.26 × 10⁻² |
| ATP | 1.59 × 10⁻⁴ | 2.69 × 10⁻⁴ |
| GWP | 5.51 × 10⁻⁵ | 6.93 × 10⁻⁴ |
| ODP | 1.66 × 10⁻¹⁰ | 2.59 × 10⁻⁹ |
| PCOP | 1.30 × 10⁻⁵ | 1.35 × 10⁻⁵ |
| AP | 4.54 × 10⁻⁴ | 7.07 × 10⁻³ |
| TOTAL | 3.14 × 10⁻² | 8.88 × 10⁻² |
