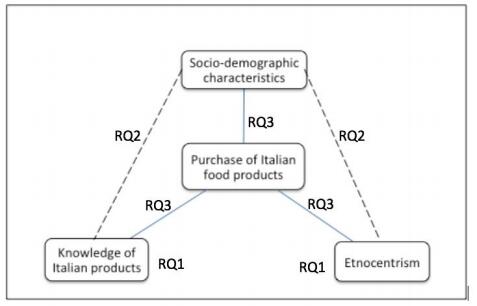
Figure 1.
Conceptual framework of the research.


Citation: Walid El Ansari, Khalid A Khalil, Derrick Ssewanyana, Christiane Stock. Behavioral risk factor clusters among university students at nine universities in Libya[J]. AIMS Public Health, 2018, 5(3): 296-311. doi: 10.3934/publichealth.2018.3.296
| [1] | Bentivoglio Deborah, Margherita Rotordam, Staffolani Giacomo, Chiaraluce Giulia, Finco Adele . Understanding consumption choices of innovative products: an outlook on the Italian functional food market. AIMS Agriculture and Food, 2021, 6(3): 818-837. doi: 10.3934/agrfood.2021050 |
| [2] | Francesco Sottile, Stefano Massaglia, Valentina Maria Merlino, Cristiana Peano, Giulia Mastromonaco, Ferdinando Fornara, Danielle Borra, Oriana Mosca . Consumption vs. non-consumption of plant-based beverages: A case study on factors influencing consumers' choices. AIMS Agriculture and Food, 2023, 8(3): 889-913. doi: 10.3934/agrfood.2023047 |
| [3] | Alessandro Scuderi, Claudio Bellia, Vera Teresa Foti, Luisa Sturiale, Giuseppe Timpanaro . Evaluation of consumers’ purchasing process for organic food products. AIMS Agriculture and Food, 2019, 4(2): 251-265. doi: 10.3934/agrfood.2019.2.251 |
| [4] | Martha Tampaki, Georgia Koutouzidou, Katerina Melfou, Athanasios Ragkos, Ioannis A. Giantsis . The contrasting mosaic of consumers' knowledge on local plant genetic resources sustainability vis a vis the unawareness for indigenous farm animal breeds. AIMS Agriculture and Food, 2024, 9(2): 645-665. doi: 10.3934/agrfood.2024035 |
| [5] | Valentina M. Merlino, Danielle Borra, Aurora Bargetto, Simone Blanc, Stefano Massaglia . Innovation towards sustainable fresh-cut salad production: Are Italian consumers receptive?. AIMS Agriculture and Food, 2020, 5(3): 365-386. doi: 10.3934/agrfood.2020.3.365 |
| [6] | Valentina Maria Merlino, Filippo Brun, Alice Versino, Simone Blanc . Milk packaging innovation: Consumer perception and willingness to pay. AIMS Agriculture and Food, 2020, 5(2): 307-326. doi: 10.3934/agrfood.2020.2.307 |
| [7] | Giuseppe Timpanaro, Paolo Guarnaccia, Silvia Zingale, Vera Teresa Foti, Alessandro Scuderi . The sustainability role in the purchasing choice of agri-food products in the United Arab Emirates and Italy. AIMS Agriculture and Food, 2022, 7(2): 212-240. doi: 10.3934/agrfood.2022014 |
| [8] | Daniele Asioli, Rungsaran Wongprawmas, Erika Pignatti, Maurizio Canavari . Can information affect sensory perceptions? Evidence from a survey on Italian organic food consumers. AIMS Agriculture and Food, 2018, 3(3): 327-344. doi: 10.3934/agrfood.2018.3.327 |
| [9] | Maurizio Canavari, Federico Gori, Selene Righi, Elena Viganò . Factors fostering and hindering farmers' intention to adopt organic agriculture in the Pesaro-Urbino province (Italy). AIMS Agriculture and Food, 2022, 7(1): 108-129. doi: 10.3934/agrfood.2022008 |
| [10] | Michelle Marais, Henry Jordaan, Willem Abraham Lombard, Yonas T. Bahta . Assessing the potential of a niche market for wool products in South Africa. AIMS Agriculture and Food, 2024, 9(1): 108-128. doi: 10.3934/agrfood.2024007 |
Nowadays, markets offer more and more products coming from different countries because of the strong development of global trade. However, the valorisation of traditional food products on a global dimension encounters several difficulties in terms of legal protection of product specificities on the international market and product acceptance by foreign consumers with different cultural perceptions, values and needs [1]. For example, "Made in Italy" products are well known and valued around the world [2].
Every year, more than one billion people purchase Italian food products, with most of them being loyal consumers. In 2014, Italian export reached 34.3 billion Euros with a growth rate of +2.7% compared to the previous year. However, "Made in Italy" is a country brand that suffers large losses due to imitations and counterfeit because of the strong popularity of Italian food products and their perceived (high) quality.
To reduce the losses for the Italian economy related to fake Italian food products, several initiatives have been adopted by Italian food companies. At the regulatory level, traditional products may be protected through the adoption of the EU quality logos which attest the specific tradition and quality of food products, such as the Protected Designation of Origin (PDO) and the Protected Geographical Indication (PGI) logos. At the national level, it is also possible to adopt collective quality certifications aimed at protecting the quality specificities of local food production. For example, in Italy it is possible to find labels such as "Qualità Alto Adige" or "Sapore di Campania", which signal to consumers the specific cultural and geographical characteristics of the products belonging to such regional food systems.
At the firm level, brand strategies can be adopted to stress the unique quality characteristics of the firm's traditional food products. For example, several private brand strategies have been developed in order to differentiate products that are produced using traditional ingredients, and/or traditional production or processing methods. Identity preservation and traceability is one of the strategies adopted by some food chains. Indeed, such strategies follow the food product through all stages of production, transformation until the retail-shelf allowing to make sure that the products actually have the features that are claimed [3,4,5,6]. At the retailer level an example of differentiation strategy is provided by Eataly, a company that uses the Italian origin of food and Italian culture as a key factor for the internationalization process of traditional food products. Eataly is the largest Italian food hall in the world and it includes in all its stores: A market, a variety of restaurants and corners dedicated to different food and beverage products, and a cooking school. Eataly has 13 stores in 10 foreign countries. The strategic goal of Eataly is to distribute Italian traditional products through an effective communication strategy based on the production methods and on the history of the people and companies that supply the traditional Italian products.
Consumer-related literature has mostly explored the drivers and barriers affecting consumer preferences towards traditional and typical products in order to evaluate the effectiveness of existing quality policies [7,8,9,10,11,12,13,14,15,16,17,18]. To this date, only few studies have explored the effectiveness of firm level strategies for such products from a consumer perspective. To fill this gap, the present research aims at identifying the factors affecting the preferences of international food consumers towards Italian food products, taking into consideration two sets of consumers: Those who shop at speciality retails, in this case Eataly, and those who shop at generalist retail stores. More precisely, the analysis concentrates on the possible barriers which can limit the acceptability of the products sold by this retailer on the international market.
More specifically, we aim at studying the levels of ethnocentrism and of product knowledge among international food consumer preferences, focusing on Munich in Germany where the German Eataly store is based. Germany is the biggest importer of Italian food and Italy represents one of the main suppliers of food products in the German market. In 2015, Italian exports increased by 6.3% and remained stable during 2016 with a growth rate of 5.3%.
In detail, we evaluate how ethnocentrism and product knowledge are affected by the socio-demographic characteristics of the respondents and if the effect is different among Eataly and non-Eataly customers. Moreover, we evaluate if ethnocentrism, product knowledge and socio-demographics have an effect on the purchase of authentic Italian products.
Food consumer purchase intensions are based on different parameters. Many scholars have focused on different variables like, for example, attitudes, subjective norms, habits, concern, trust and other individual characteristics [14,15,16,17,18,19,20,21]. More specifically, to understand the behaviour of consumers with regards to foreign products, many authors investigated its links with product knowledge, country of origin, and consumer ethnocentrism [22]. Chryssochoidis et al. [23] found that the product's country of origin stimulates different ethnocentric views and that consumer knowledge might have a role in affecting the evaluation of food product characteristics. Cilingir and Basfirinci [24] and Insch and Jackson [25] found that such variables affect consumer food choices. The focus of this work is to study the relevance of such variables on foreign-food purchasing-decisions (Figure 1). We also investigate the association between purchasing behaviour and socio-demographic variables, such as age and gender [26], education level [27] and income [28] as these have been shown to significantly affect consumer purchase of Italian food products.
Product knowledge is defined as "the amount of accurate information held in memory as well as self-perceptions of product knowledge" [29]. Consumers take purchasing decisions based on, among other things, their own knowledge about the product. The more they know about the product, the better are the chances that the consumer will purchase the product [30]. Nowadays, the market offers a huge variety of different food products and consumers depend more and more on their knowledge in evaluating and purchasing them. Such knowledge is generally acquired when a consumer purchases and consumes the product. As highlighted by Brucks [22], product knowledge is related to the consumer's food literacy and on his/her own memories. Lin and Zhen [31] found an association with customer awareness and understanding of the food product characteristics. Product knowledge is a multidirectional concept: Consumers derive different types of product knowledge from different types of product experiences [32]. It is also influenced by the frequency of purchase as it enhances the consumer usage experience [33]. Furthermore, different people have different levels of knowledge and this affects their information search [34] and their perception about product authenticity [35]. Product knowledge tend to lead to familiarity with the product [36].
Product knowledge has been classified in objective and subjective knowledge [32,37]. Objective knowledge is the knowledge that the individual actually holds, while the subjective one is what the consumer thinks he/she has.
Country of origin is an extrinsic attribute of food products, together with price, brand, packaging, and many others [38]. Consumers who have not had direct experiences with a product—and thus are unaware of its intrinsic characteristics—evaluate it through its extrinsic attributes. Literature highlights that country of origin is relevant to consumers that perceive it as a quality attribute [39]. This association influences the value perceived by consumers and the risks related to product purchase [40]. Country of origin is also strongly related to consumer trust [41,42,43], that has been shown to be an important factor affecting consumer food purchasing intentions [44]. Country of origin indications are not only used as a signal for the cognitive system, but also relate to symbols and emotions that consumers associate with a country [49,45,46]. For this reason, the buying decision process is strongly influenced by the origin of the product. In addition, given the increasing importance of country of origin attributes for consumers and given the continuous effort of food firms in trying to differentiate their products, a positive country image becomes a key factor for the success on the international market. Previous studies show that the concept of "Made in Italy" has become more than a country of origin indication: It seems to have reached the characteristics of a brand with a defined identity and to be considered as a synonym of quality and reliability [47,48,49,50]. Thus, selling products with the "Made in Italy" trademark means obtaining an important competitive advantage, thanks to the benefits that derive from such a strong image. However, "Made in Italy" has recently been suffering from a complex competitive environment with the emergence of "Italian sounding" products coming from abroad. Such products are not "Made in Italy" but try to benefit from the positive attitudes towards Italian food products. Forgery accounts globally for 60 billion euros and has increased in the last ten years; in the USA, only one product out of eight, among the ones sold as Italian, actually comes from Italy [51]. The most forged product is cheese, in particular Parmigiano Reggiano, that is evoked in the names of foreign cheeses named "Parmesan", "Reggianito", and "Parmesello".
Current literature has shown that consumers tend to prefer domestic and local products, or products imported from countries with similar culture or traditions, underlining ethnocentric tendencies [52]. Ethnocentrism was defined in 1906 by William Graham Sumner as the general inclination of an individual to base its assessments of an external phenomena on the standards of the group he/she belongs to [53]. Afterwards, in 1987, Shimp and Sharma [54] adapted the concept to marketing. They defined consumer ethnocentrism (CET) as a personality trait, founded in generally stable values, that dictates what is considered to be right or moral in the context of foreign product purchase [53]. The background assumption is that food characterizes people, cultures and societies. For this reason, food can be considered as a cultural element. Despite the fact that human beings are omnivores, they do not eat the same food across different cultures. In fact, the preference for some foods and the refusal for others have a cultural origin [55]. Every culture has a foodstuff code that approves of some products and forbids others. This code is determined by geographical, environmental, economic, historical and nutritional elements that characterize the culture itself. Often particular foods are associated with specific cultures. The development of global trade leads to the introduction in the market of new products coming from countries that differ for cultural, political, or economic orientation. As a consequence, the buying decision process is becoming more and more complex and consumers have to choose between local or foreign products [56]. Consumers are often faced with the option of buying international and multinational brands or products from the local market. Approaching different cultures, the desire to stay anchored to one's own personal identity and eating habits could lead to nationalist purchase behaviours [57]. Ethnocentrism is a global attitude, but differences in the strength with which it affects consumer behaviour exist among countries [39,58]. For this reason, ethnocentrism is considered as an important factor to foresee consumer attitudes and perceptions towards imported and foreign food products [39]. According to Shimp and Sharma [54] and Lindquist et al. [59], the reasons for which it may be unsuitable to buy foreign products are related to four factors: Damage to the domestic economy, job loss, unpatriotic behaviour, and product availability. Previous studies highlight the usefulness of studying consumer choices looking at ethnocentrism [23,60,61]. In these studies, ethnocentrism was considered as one of the antecedents of the purchasing behaviour [62,63].
Given all of the above considerations, our research focuses on purchases of food products of Italian origin in a large German city such as Munich. Figure 1 represents the framework of our analysis.
More precisely, the present analysis addresses the following research questions:
RQ1. Which is the level of ethnocentrism tendencies and product knowledge related to Italian food products on the international market? Are there differences between customers of speciality stores and generalist food stores?
RQ2. Which is the relation of ethnocentrism tendencies and product knowledge to socio-demographic characteristics? Are there differences in the association between variables for customers of speciality stores and generalist food stores?
RQ3. Which is the effect of ethnocentrism tendencies, product knowledge and socio-demographic variables on the frequency of purchase of authentic Italian products on the international market? Do these relations differ for customers of speciality stores and generalist food stores?
Data on the variables included in the conceptual framework were collected via a survey questionnaire developed to investigate consumer behaviour, consumer ethnocentrism, knowledge of Italian food products, and sociodemographic characteristics. The questionnaire was structured in closed-answered questions to make it easier for respondents to answer and for researchers to compare and analyse the results.
Data was collected face to face in Munich (Germany) during May 2017. We chose a German city because Germany is the biggest importer of Italian food productions and Italy represents the first suppliers of food products in German market (Istat, 2018). Moreover, we chose Munich because of the presence of the Eataly store.
The choice of using a survey is related to the aim of reducing the interviewing time, given that consumers were food shopping. The risk of low-understanding or confusion about the questions, of skipping questions, or of satisfying were limited by the fact the survey was administered in person. However, this reduced the level of anonymity of the survey. The survey was developed in English and then translated and conducted in German.
Data was collected in the centre on Munich, focusing both on Eataly and non-Eataly customers. Eataly customers were interviewed in front of the shop, whereas non-Eataly customers were interviewed in front of other food shops. Relatively close to the store, i.e., at the REWE store, Penny store and at the Viktualien Markt. Data was collected during different time slots (8–12 am; 12–15 pm; 15–18 pm; 18–21 pm) by an experienced researcher who received specific training before data collection. Before starting the interviews, a screening question was applied to the potential respondents. The interviewer asked if the person was in charge of family food shopping. In case of a positive answer, the respondents were invited to take the questionnaire.
The questionnaire was administered to 203 subjects: 94 customers of Eataly Munich and 109 respondents who do not shop at the store. The general characteristics of the two sub-samples are reported in Table 1. We considered people who lived in Munich or have a German citizenship; however, we took notice of the country of origin of their families since it could be an interesting variable for our study. The possibility to specify the country of origin allowed us to define better the macro areas EU and extra EU. Among the 16 observations from European Union, 8 respondents come from Austria, 2 from Greece, 2 from Romania, 1 respondent from Albania, 1 from Croatia, 1 from UK and 1 from France. Indeed, in Bavaria, the most present ethnic groups are from Turkey, ex Jugoslav countries, Austria, and Italy. Moreover, the 13 observations with family origin from countries outside of the EU were distributed in the following way: 3 from Switzerland, 2 from USA, 2 from Brazil, 1 from Singapore, 1 from Syria, 1 from Iran, 1 from Macedonia, and 1 from Bosnia. 36.9% of the total sample had visited Italy between 2 and 4 times in the last ten years, 31% of it visits Italy every year, 25.6% had done so only once, and 6.4% had never been to Italy.
| Variable | Eataly customers (%) | Non-Eataly customers (%) |
| Age | ||
| 18–30 | 23.4 | 25.7 |
| 31–40 | 16.0 | 19.3 |
| 41–50 | 22.7 | 22.9 |
| more than 50 | 38.3 | 32.1 |
| Gender | ||
| Male | 53.2 | 48.6 |
| Female | 46.8 | 51.4 |
| Educational level* | ||
| Hauptschule | 3.2 | 4.6 |
| Realschule | 21.3 | 24.8 |
| Abitur | 13.8 | 27.5 |
| Hochschulabschluss | 61.7 | 43.1 |
| Income | ||
| Less than 20,000 € | 16.0 | 11.9 |
| 20,000–40,000 € | 13.8 | 15.6 |
| 40,000–60,000 € | 23.4 | 17.4 |
| More than 60,000 € | 12.8 | 17.4 |
| Refuse to answer | 34.0 | 37.7 |
| *For accuracy, we present the educational level of the German scholastic system: Hauptschule = Secondary school, from grade 5 to 9; Realschule = Secondary school, from grade 5 to 10; Abitur = Final degree of Gymnasium, secondary school from 5 to 13; Hochschulabschluss = Final degree of the University. | ||
 DownLoad:
CSV
DownLoad:
CSV
In order to understand the attitudes and purchasing habits of a set of German consumers, we collected data on four main types of variables: Consumer ethnocentrism, knowledge about Italian food products, frequency of purchase of authentic Italian products, and socio-demographic characteristics.
The level of ethnocentrism is measured through the Consumer Ethnocentric Tendencies (CET) scale, in the version developed and tested by Klein et al. [64]. The original version was developed in 1987 by Shimp and Sharma [54] that proposed a psychometric scale to measure the ethnocentric vision of a nation or a group with respect to foreign products or products coming from outside the group. The scale was subsequently shortened and translated in many languages to be used in different countries. It has indeed been adopted by researchers focusing on a wide variety of products and services. All items are scored using a seven-point scale (where "1" means "strongly disagree" and "7" means "strongly agree"). More details are provided in Table 2.
| Variable name | Scale | Description |
| Ethnocentrism variable (CET scale) | ||
| CET1 | scale (1–7)* | Only those products that are unavailable in Germany should be imported |
| CET2 | scale (1–7)* | German products, first, last and foremost |
| CET3 | scale (1–7)* | A real German should always buy German-made products' |
| CET4 | scale (1–7)* | Germans should not buy foreign products, because this hurts German business and causes unemployment |
| CET5 | scale (1–7)* | It may cost me in the long-run but I prefer to support German products' |
| CET6 | scale (1–7)* | German consumers who purchase products made in other countries are responsible for putting their fellow Germans out of work |
| Product knowledge | ||
| SubKnow1 | scale (1–7)* | I know pretty much about fresh pasta |
| SubKnow2 | scale (1–7)* | I know how to judge the quality of fresh pasta |
| ObjKnow1 | dummy (0–1) | Wrong/correct answer to closed-answer questions about traditional Italian food products (long cut pasta) |
| ObjKnow2 | dummy (0–1) | Wrong/correct answer to closed-answer to questions about traditional Italian food products (stuffed pasta) |
| ObjKnow3 | dummy (0–1) | Wrong/correct answer to closed-answer to questions about traditional Italian food products (typical Italian dish) |
| ObjKnow4 | dummy (0–1) | Wrong/correct answer to closed-answer questions about traditional Italian food products (typical dish form Southern Italy) |
| Food purchasing habits | ||
| Eataly | dummy (0–1) | Dummy variable on purchases at Eataly (0 = no; 1 = yes) |
| Italian products | scale (1–5) | Frequency of purchase of authentic Italian food products (never, yearly, monthly, weekly) |
| *Level of agreement: 1 = strongly disagree; 7 = strongly agree. | ||
DownLoad:
CSV
Literature highlights that the level of ethnocentrism may be influenced by some antecedents [65]. Indeed, demographic variables have been shown to affect consumption behaviour directly and indirectly, that is via consumer personal values and other characteristics of their decision-making processes [66]. We focus on four demographic antecedents: Gender, age, education, and income.
The relation between ethnocentrism and gender is not clear in the literature. Some empirical studies showed that women tend to be more ethnocentric than men [67]; while others find evidence supporting the opposite [68,69]. Moreover, other authors did not find any significant gender differences [70,71].
For what concerns age, some authors found a positive association with age: With younger consumers showing lower levels of ethnocentric tendencies compared to older ones [72,73]. However, other studies highlight an opposite association [68,74] or no association between age and ethnocentrism [75].
Considering education, most studies found a negative association with educational levels [67,72,73,76]. Moreover, literature suggests that higher educated people tend to be less conservative and to show lower racial preconceptions [77].
Focusing on income, previous studies do not agree on a single hypothesis about the link between these variables. Indeed, many authors highlight a negative relationship between income levels and consumer ethnocentrism [54,74,75,76], while others find a positive one [78] or no association [79].
The analysis also focuses on product knowledge. Indeed, consumer purchasing decisions are influenced by many variables, among others their knowledge about the product [80,81]. The more consumers know about the product, the better are the chances that they will purchase the product [30]. According to some authors, consumer knowledge is positively correlated with product information [32,82] and purchase intensions [30]. Thanks to globalization, products with different attributes and features are available on the market and consumers have more knowledge about them.
Knowledge about Italian food products is measured using both objective and subjective knowledge measures [22]. Literature indeed indicates that often consumers tend to overestimate their knowledge, believing to know more than what they actually know. Objective knowledge is the "current, accurate information stored by individuals in their long-term memory" [83]; while subjective knowledge is based on self-assumptions about one's own knowledge of a topic [84,85]. More specifically, objective knowledge was assessed by means of multiple-choice questions related to knowledge and familiarity with Italian food; while subjective knowledge was measured through a one to seven scale.
Variables concerning socio-demographic characteristics and food purchasing habits by respondents were also considered. More in detail, we collected data about gender, age, education, and income. Respondents were also asked about their purchases in Eataly Munich, allowing us to divide the sample in Eataly customers and non-customers. Finally, we investigated the purchase frequency of authentic Italian products with a direct question evaluated on a four-level scale.
Collected data was firstly analysed by means of descriptive statistics and factor analysis. More specifically, before analysing the variables that influence ethnocentrism and product knowledge (RQ2) and the role of the latter constructs on purchasing decisions (RQ3), we performed a factor analysis on all of the variables related to ethnocentrism and knowledge of Italian food products. Factor analysis is a useful tool to study complex concepts, such as ethnocentrism or product knowledge, that are collected via a set of questions that relate to a latent unobservable factor. Likelihood-ratio tests for the number of factors where performed to check if the number of factors was sufficient.
After having reduced the dimensionality of the data into factors, we investigated the distribution of the factors across different consumer characteristics and in particular focusing on consumers who shop or do not shop at Eataly.
We then applied an ordinary least square model to the data to analyse the multivariate associations among variables. More specifically, we used as dependent variables the factors related to ethnocentrism and knowledge of Italian products, and as independent variables the socio-demographic characteristics of respondents.
Furthermore, we performed four ordered logistic regressions, via cumulative link models, to evaluate the relation between the purchasing behaviour related to authentic Italian products and the other variables of our conceptual framework (Figure 1).
As a first analysis of the data, we report some descriptive statistic useful to provide insights on our first research question, i.e., on the level of consumer ethnocentrism tendencies and product knowledge. For what concerns ethnocentrism, Table 3 reports as a mean of comparison, even if the data are ordinal, the mean value and the standard deviation for each of the six items of the CET scale.
| Eataly customers | Non-Eataly customers | |||
| Variable | Mean | Std. Deviation | Mean | Std. Deviation |
| ETN1 | 3.42 | 1.97 | 3.27 | 2.06 |
| ETN2 | 1.58 | 1.09 | 1.98 | 1.45 |
| ETN3 | 2.09 | 1.48 | 2.28 | 1.51 |
| ETN4 | 1.46 | 0.96 | 1.80 | 1.12 |
| ETN5 | 1.90 | 1.29 | 2.40 | 1.65 |
| ETN6 | 1.22 | 0.64 | 1.47 | 1.16 |
DownLoad:
CSV
According to our study, the CET scale mean score in Munich is 2.08. The results underline low ethnocentric tendencies and a general disagreement with the sentences of the scale, especially among Eataly consumers (except for the first item). It is interesting to underline how the mean scores of the scale reveal a general trend of respondents to prefer local products. More precisely, the respondents disagree strongly with item 6 ("German consumers who purchase products made in other countries are responsible for putting their fellow Germans out of work") and item 4 ("Germans should not buy foreign products, because this hurts German business and causes unemployment"). On the other hand, item 1 ("only those products that are unavailable in Germany should be imported") reaches higher mean values. This result is reinforced by the general trend to prefer local products: 76% of German people consider very important the fact that food products come from their region [86]. In this direction, German consumers may prefer to import food that they do not produce, but do not avoid purchasing ethnic food or imported products. In particular, they do not seem to associate the unemployment in Germany with the import of food products.
Table 4 reports the mean value and the standard deviation for each of the items aimed at measuring knowledge about Italian food products. Even if mean values for Eataly customers are always higher than for non-Eataly customers, as you might expect, values in the two subsamples do not vary much.
| Eataly customers | Non-Eataly customers | |||
| Variable | Mean | Std. Deviation | Mean | Std. Deviation |
| SUB1 | 5.54 | 1.58 | 5.38 | 1.60 |
| SUB2 | 4.46 | 1.71 | 4.22 | 1.87 |
| OBJ_easy | 1.91 | 0.35 | 1.86 | 0.42 |
| OBJ_advanced | 0.68 | 0.71 | 0.61 | 0.64 |
DownLoad:
CSV
We also report the frequency of purchase of authentic Italian products as a background information to our third research question about the role of the above variables, together with socio-demographics, in influencing the purchase of authentic Italian products on the international market.
Results related to the frequency of purchase indicate that authentic Italian food is bought every week by 52.7% of the sample (more in detail, by 59.6% of Eataly customers and 46.8% of non-Eataly customers), once per month by 39.9% of the respondents (38.3% of Eataly customers and 41.3% of non-Eataly customers), and a few times during the year by 6.4% of the sample (2.1% of Eataly customers and 10.1% of non-Eataly customers). Only 2 respondents out of 203 do not purchase Italian products (1.0%) and these are non-Eataly customers.
To assess the relationship among the cultural variables included in our survey, we performed an explorative factor analysis. The choice of using a dimension-reduction tool is functional to responding to the second and third research questions, to see if we can treat the items of the same scale as being measures of one unique (or more) latent variable. Being able to group different items in a factor makes the interpretation of the (following) regression analysis more straightforward.
The factor analysis grouped the variables into two factors (Table 5). The first factor groups together all the six variables included in the CET scale. The second factor instead groups all the variables related to knowledge.
| Variable | Factor 1 | Factor 2 |
| ETN1 | 0.408 | 0.039 |
| ETN2 | 0.579 | −0.119 |
| ETN3 | 0.701 | −0.109 |
| ETN4 | 0.769 | −0.240 |
| ETN5 | 0.583 | −0.246 |
| ETN6 | 0.431 | −0.162 |
| SUB1 | 0.142 | 0.907 |
| SUB2 | 0.238 | 0.670 |
| OBJ_easy | 0.033 | 0.308 |
| OBJ_advanced | 0.001 | 0.275 |
DownLoad:
CSV
The output of the factor analysis does not seem to distinguish between the variables aimed at measuring objective and subjective knowledge as it groups them all in one unique factor, even if with quite diverse factor loadings. Factor loadings are reported in Table 4. Likelihood-ratio tests for the number of factors support the existence of only two significant latent factors.
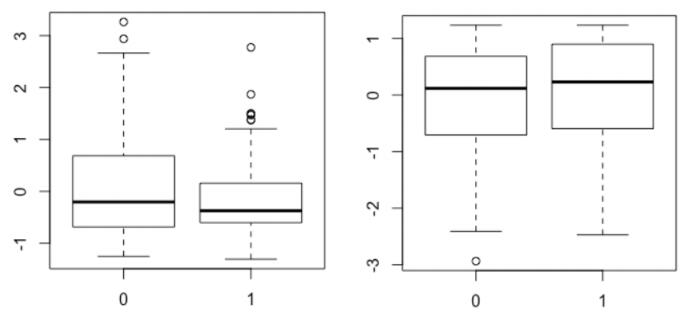
To evaluate if there are differences between Eataly and non-Eataly customers related to ethnocentrism (factor 1) and product knowledge (factor 2) (RQ1), we report the boxplots of the scores of the factor analysis. What emerges is that non-Eataly customers (X = 0) seem to be less homogenous in terms of ethnocentrism that Eataly customers (X = 1). In particular they show a heavy right tail, that highlights a group of very ethnocentric individuals among such consumers. For what concerns knowledge of Italian food products, the two distributions of scores for Eataly and non-Eataly customers do not show major differences. The boxplots unveil left-skewed distributions, suggesting the existence of a non-negligible group of subjects that have low levels of knowledge about Italian products in both types of consumers. T-tests confirm that mean values do not differ in a statistically significant way for factor 2 on product knowledge, but they do differ for factor 1 on ethnocentrism, meaning that non-Eataly customers have higher scores for factor 1, thus, they are statistically more ethnocentric than Eataly consumers.
Having reduced ethnocentrism and knowledge of Italian food products to two single factors, we are able to evaluate if there are significant associations between the levels of ethnocentrism and knowledge of Italian products and the socio-demographic characteristics of the respondents [65] i.e., to provide insights on the second research question. We perform two models for each variable, fitting responses from Eataly and non-Eataly customers to evaluate if there are differences in the association among variables in these two sub-samples.
Tables 6 and 7 summarize the output of two linear regression models where the dependent variable is the ethnocentrism factor performed on non-Eataly customers (Table 6) and Eataly customers (Table 7). What emerges is that, among non-Eataly customers, higher levels of ethnocentrism seem to be associated, ceteris paribus, with females and with people with lower levels of education. Income was not included in such models due to high levels of correlation with education levels and the lower response rate that would affect sample size. The corresponding models with income instead of education were also analysed, but these show lower levels of significance.
| Ethnocentrism, non-Eataly customers | |||||
| Estimate | Std. Error | t-value | Pr(>|t|) | significance | |
| (Intercept) | 0.18715 | 0.21112 | 0.886 | 0.377 | |
| GENDER (male) | −0.59296 | 0.18608 | −3.187 | 0.002 | ** |
| AGE 31–40 | 0.16497 | 0.28310 | 0.583 | 0.561 | |
| AGE 41–50 | 0.06292 | 0.26927 | 0.234 | 0.816 | |
| AGE morethan 50 | −0.24322 | 0.25059 | −0.971 | 0.334 | |
| EDUCATION abitur | 0.28370 | 0.22869 | 1.241 | 0.218 | |
| EDUCATION realschule | 0.53660 | 0.24286 | 2.210 | 0.029 | * |
| EDUCATION hauptschule | 0.92672 | 0.45003 | 2.059 | 0.042 | * |
| R-squared | 0.186 | ||||
| Adjusted R-squared | 0.130 | ||||
| DF | 101 | ||||
| p-value | 0.003 | ||||
| Notes: Signif. codes: 0 '***' 0.001 '**' 0.01 '*' 0.05 '.' 0.1 ' ' 1. | |||||
DownLoad:
CSV
| Ethnocentrism, Eataly customers | |||||
| Estimate | Std. Error | t-value | Pr(>|t|) | significance | |
| (Intercept) | −0.04584 | 0.17213 | −0.266 | 0.791 | |
| GENDER (male) | −0.34965 | 0.15331 | −2,281 | 0.025 | * |
| AGE 31–40 | 0.38836 | 0.24241 | 1,602 | 0.113 | |
| AGE 41–50 | 0.07972 | 0.23002 | 0.347 | 0.730 | |
| AGE morethan 50 | −0.05034 | 0.20627 | −0.244 | 0.808 | |
| EDUCATION reordabitur | 0.21740 | 0.22807 | 0.953 | 0.343 | |
| EDUCATION reordrealschule | −0.12147 | 0.19426 | −0.625 | 0.533 | |
| EDUCATION reordhauptschule | 0.15983 | 0.43385 | 0.368 | 0.713 | |
| R-squared | 0.112 | ||||
| Adjusted R-squared | 0.041 | ||||
| DF | 86 | ||||
| p-value | 0.1592 | ||||
| Notes: Signif. codes: 0 '***' 0.001 '**' 0.01 '*' 0.05 '.' 0.1 ' ' 1. | |||||
DownLoad:
CSV
Results reported in Table 7 suggest that there is no evidence to infer the existence of an association between socio-demographic variables and the level of ethnocentrism among Eataly customers.
A similar analysis was performed also for what concerns the knowledge for Italian products. Results are reported in Tables 8 and 9. The levels of knowledge of Italian food products among non-Eataly customers seem to be related to gender, with males having lower levels of knowledge, and age, with older consumers being more knowledgeable about Italian products. Instead, knowledge for Italian food products among Eataly customers does not seem to be associated with different socio-demographic characteristics.
| Italian products knowledge, non-Eataly customers | |||||
| Estimate | Std. Error | t-value | Pr(>|t|) | significance | |
| (Intercept) | −0.29309 | 0.19796 | −1.481 | 0.142 | |
| GENDER (male) | −0.43917 | 0.17449 | −2.517 | 0.013 | * |
| AGE 31–40 | 0.62188 | 0.26546 | 2.343 | 0.021 | * |
| AGE 41–50 | 0.61096 | 0.25249 | 2.420 | 0.017 | * |
| AGE morethan 50 | 0.81631 | 0.23498 | 3.474 | 0.001 | *** |
| EDUCATION abitur | 0.00433 | 0.21444 | 0.020 | 0.984 | |
| EDUCATION realschule | −0.36016 | 0.22773 | −1.582 | 0.117 | |
| EDUCATION hauptschule | −0.18559 | 0.42199 | −0.440 | 0.661 | |
| R-squared | 0.158 | ||||
| Adjusted R-squared | 0.100 | ||||
| DF | 101 | ||||
| p-value | 0.013 | ||||
| Notes: Signif. codes: 0 '***' 0.001 '**' 0.01 '*' 0.05 '.' 0.1 ' ' 1. | |||||
DownLoad:
CSV
| Italian products knowledge, Eataly customers | |||||
| Estimate | Std. Error | t-value | Pr(>|t|) | significance | |
| (Intercept) | 0.03076 | 0.21661 | 0.142 | 0.887 | |
| GENDER (male) | −0.13972 | 0.19292 | −0.724 | 0.471 | |
| AGE 31–40 | 0.18703 | 0.30504 | 0.613 | 0.541 | |
| AGE 41–50 | 0.52842 | 0.28945 | 1.826 | 0.071 | |
| AGE morethan 50 | 0.30250 | 0.25957 | 1.165 | 0.247 | |
| EDUCATION abitur | −0.61764 | 0.28700 | −2.152 | 0.034 | * |
| EDUCATION realschule | −0.15604 | 0.24446 | −0.638 | 0.525 | |
| EDUCATION hauptschule | −0.51515 | 0.54594 | −0.944 | 0.348 | |
| R-squared | 0.112 | ||||
| Adjusted R-squared | 0.039 | ||||
| DF | 86 | ||||
| p-value | 0.1613 | ||||
| Notes: Signif. codes: 0 '***' 0.001 '**' 0.01 '*' 0.05 '.' 0.1 ' ' 1. | |||||
DownLoad:
CSV
Given the above results, we also tested the relation of the two factors regarding the two cultural variables in our framework with the purchase at the Eataly store in Munich. We performed a logistic regression with two regressors (the two factors) considering as dependent variable a dummy variable where 0 indicates a non-Eataly customer and 1 a person who shops at Eataly. Results confirm a negative and significant association between purchasing at Eataly and the ethnocentrism factor (p-value = 0.038) and no evidence for an association with the knowledge of Italian food products.
After having analysed the role of socio-demographic characteristics on the cultural variables included in our conceptual framework, we have investigated their role on the frequency of purchase of Italian food products, to try to answer to our third research question. Hence, we run a set of ordinal regression models where the dependent variable is the purchase frequency of authentic Italian food products. As before, we run two separate models for the two subsets of consumers: Eataly and non-Eataly customers, to verify if there are changes in the associations with the independent variables (RQ3). Given the relatively weak relations between socio-demographics and the cultural variables factors discussed above, especially in the case of Eataly customers, and the fact that previous literature highlights both direct and indirect effects of socio-demographic variables on consumption behaviour, we run two models for each subset of the sample: One with only the two factors related to the cultural variables and one with also socio-demographic variables. Significant variables are identified in in Tables 10 and 11.
| Non eataly customers | ||||||||||
| Model 1 | Model 2 | |||||||||
| Estimate | Std. Error | t-value | Pr(>|t|) | significance | Estimate | Std. Error | t-value | Pr(>|t|) | significance | |
| (Intercepts) | ||||||||||
| never|year | −4,138,112 | 0.721297 | −57,370 | 9.6E-06 | *** | −384,180 | 0.82328 | −46,664 | 3.07E-03 | *** |
| year|month | −2,129,359 | 0.308493 | −69,024 | 5.1E-09 | *** | −179,588 | 0.49726 | −36,116 | 0.0003043 | *** |
| month|week | 0.080418 | 0.196692 | 0.4089 | 0.6826 | 0.56813 | 0.45026 | 12,618 | 0.2070221 | ||
| (Explanatory variables) | ||||||||||
| GENDER (male) | 0.24283 | 0.42665 | 0.5692 | 0.5692489 | ||||||
| AGE 31–40 | −0.48598 | 0.58290 | −0.8337 | 0.4044353 | ||||||
| AGE 41–50 | 0.76475 | 0.58939 | 12,975 | 0.1944476 | ||||||
| AGE morethan 50 | 0.90878 | 0.55132 | 16,484 | 0.0992744 | ||||||
| EDUCATION abitur | −0.13429 | 0.48279 | −0.2782 | 0.7808877 | ||||||
| EDUCATION realschule | 0.12468 | 0.53617 | 0.2325 | 0.8161165 | ||||||
| EDUCATION hauptschule | −0.42209 | 0.86700 | −0.4868 | 0.6263756 | ||||||
| Factor 1 | −0.288937 | 0.184715 | −15,642 | 0.1178 | −0.22096 | 0.20746 | −10,651 | 0.2868503 | ||
| Factor 2 | 0.326450 | 0.200457 | 16,285 | 0.1034 | 0.30237 | 0.22712 | 13,313 | 0.1830912 | ||
| N. of observations | 109 | 109 | ||||||||
| Akaike Information Criterion (AIC) | 228.54 | 145.57 | ||||||||
| Notes: Signif. codes: 0 '***' 0.001 '**' 0.01 '*' 0.05 '.' 0.1 ' ' 1. | ||||||||||
DownLoad:
CSV
| Eataly customers | ||||||||||
| Model 1 | Model 2 | |||||||||
| Estimate | Std. Error | t-value | Pr(>|t|) | significance | Estimate | Std. Error | t-value | Pr(>|t|) | significance | |
| never|year | −1045854 | 2644408 | −0.3955 | 0.69248 | −11261026 | 28092799 | −0.4009 | 0.68853 | ||
| year|month | −396228 | 0.72498 | −54654 | 4.6E-05 | *** | −3595964 | 0.885406 | −40614 | 0.04879 | *** |
| month|week | −0.37777 | 0.22206 | −17012 | 0.08890 | . | 0.387025 | 0.513935 | 0.7531 | 0.45141 | |
| (Explanatory variables) | ||||||||||
| GENDER (male) | −0.238943 | 0.502088 | −0.4759 | 0.63415 | ||||||
| AGE 31–40 | 0.959550 | 0.740327 | 12961 | 0.19494 | ||||||
| AGE 41–50 | 1864401 | 0.763756 | 24411 | 0.01464 | * | |||||
| AGE morethan 50 | 1590115 | 0.646868 | 24582 | 0.01396 | * | |||||
| EDUCATION abitur | 1111720 | 0.793847 | 14004 | 0.16139 | ||||||
| EDUCATION realschule | −1461593 | 0.591462 | −24712 | 0.01347 | * | |||||
| EDUCATION hauptschule | −2921894 | 1489000 | −19623 | 0.04973 | * | |||||
| Factor 1 | 0.12715 | 0.29616 | 0.4293 | 0.66768 | 0.055926 | 0.334351 | 0.1673 | 0.86716 | ||
| Factor 2 | 0.59636 | 0.23479 | 25400 | 0.01109 | * | 0.620954 | 0.265170 | 23417 | 0.01920 | * |
| N. of observations | 94 | 94 | ||||||||
| Akaike Information Criterion (AIC) | 232.70 | 143.69 | ||||||||
| Notes: Signif. codes: 0 '***' 0.001 '**' 0.01 '*' 0.05 '.' 0.1 ' ' 1. | ||||||||||
DownLoad:
CSV
Results indicate that the frequency of purchase of authentic Italian products among Eataly customers is not associated so much to ethnocentrism—that in this subsample is lower than among non-Eataly customers—but to personal knowledge about Italian food products. This suggests that the more you know about traditional products the more you are prone to purchase them. This has marketing implications both at the store and country level if "Made in Italy" products are to be promoted. If we look at Model 2 for this subset of consumers—whose cultural factors were not explained by socio-demographic variables—we find that, ceteris paribus, older people seem to have higher frequency of purchase of such products and people with lower levels of education purchase authentic Italian products less frequently. For non-Eataly customers we find that socio-demographic characteristics, ethnocentrism and product knowledge do not seem to affect the purchase of Italian food. This could instead depend on other factors not included in our analysis.
Results from the descriptive analysis, aimed at answering to RQ1, indicate higher levels of ethnocentrism among consumers who do not shop at Eataly compared to Eataly customers; while no significant differences seem to emerge for what concerns the knowledge of Italian food products. Such results highlight an interesting contrast that suggests that the choice of purchasing at Eataly seems to be conscious and in line with personal inclinations. Indeed, it does not seem to depend on knowledge of Italian products, instead it is more related (negatively) to the level of ethnocentrism, i.e., the willingness to protect German products and economy.
For what concerns RQ2, among non-Eataly customers, it appears that men are less ethnocentric with respect to women, confirming the main empirical studies [67,75]. This could indicate that women tend to be more conservative for what concerns food choices. Considering the educational level, results indicate that people with lower educational level (Hauptschule, Realschule and Abitur) are more ethnocentric than the ones with a university degree. Previous studies agree with our finding, showing a negative relation between the two variables. Indeed, more educated people tend to have fewer ethnic preconceptions and to be less conservative [87]. Among Eataly customers, where ethnocentrism levels were lower, we dot find evidence of a significant role of socio-demographics on the level of ethnocentrism. Moving to product knowledge, among non-Eataly customers, females and, ceteris paribus, older people seem to be more knowledgeable on Italian food products. Again, no significant relation is highlighted among Eataly customers.
Finally, for what concerns our third research question (RQ3), we find that the regular purchase of authentic Italian food does not characterise only Eataly customers. Indeed, 52.7% of the sample purchase Italian food every week, 39.9% every month, with percentages that do not differ substantially between the two subsamples. What seems to emerge from our analyses is that the level of ethnocentrism tendencies influences the choice of shopping at Eataly or not, but not so much the level of purchase of Italian food products. Indeed, the frequency of purchase of Italian food products, among Eataly customers, is instead related to product knowledge, age and education.
The paper aimed at investigating the role of cultural variables such as ethnocentrism and product knowledge on the choice of international food products, focusing on "Made in Italy" food products in Germany.
To do so, data on ethnocentrism tendencies, knowledge about Italian food products, and food shopping behaviour were collected among consumers living in Munich (Germany). The choice of Munich was related to the presence of an Eataly store, that is the largest Italian food hall in the world and whose focus is selling traditional Italian food products. The results of our analysis highlight that ethnocentrism tendencies and lack of product knowledge can constitute potential barriers to the success of Italian food products in foreign markets.
This provides some interesting implications for firms marketing Italian food products and also for policy makers interested in building the "Made in Italy" brand. What emerges is that while increasing the customer base of Eataly or retailers selling only Italian food products might be long and quite cumbersome, given the difficulty and the time involved in changing personal cultural values, there is still space for Italian food firms to sell their products via more generalist retailers. Speciality retailers should try to differentiate their communication strategies, not focusing only on the fact that products are authentic Italian but trying to attract new customers by increasing awareness about the taste, quality and other features that their products—being authentic traditional Italian products—have.
Moreover, all stakeholders interested in increasing sales or promoting authentic Italian food products should target product knowledge. Building knowledge about Italian products and culinary traditions could increase the frequency of purchase by the less ethnocentric foreign consumers. This could, for example, be done by communications campaigns in the city, through local newspapers, cooking magazines or local events and festivals. Product knowledge should be built also in the store itself among customers for example using billboards (a tool that already differentiates Eataly stores from those of other retailers), providing recipes and organising seminars and classes. Indeed, the current educational engagement of Eataly on traditional production processes and producers can help customers understand that even if prices are not low, the quality of the products makes the difference. This type of communication could be also extended out of the store. Increasing product knowledge and making people more conscious about the quality differences between authentic and non-authentic products could also gradually reduce the market erosion for authentic Italian food products by imitation ones, supporting the "Made in Italy" brand.
However, results suffer from a set of limitations that need to be considered. First of all, the variables are measured on the basis of stated preference data. This has well-known problems related to the risk of over-statement of socially desirable practices or values. Moreover, the analysis is based on a sample limited in size and in geographical scope and this limits the reliability of the findings. Moreover, the results of our regressive models show low levels of R-squared indicating low levels of association (in some cases significant and in other not) among some of the variables of our conceptual framework and, possibly, suggesting the presence of other additional variables in explaining the purchasing behaviour. Future work should also consider a wider range of behaviour determinants and try to confirm results with a larger sample. However, this is one of the few studies looking at the role of ethnocentrism and product knowledge on the preferences for food products sold by retailers with a strong national identity on the international market. Future work should focus on collecting data also in other countries so that results may be more extendable. Further work could be done also developing ad hoc ethnocentrism scales, given that this variable might depend on the product and on the context. Moreover, future research could also explore more deeply the motivations affecting the choice of the retailer channel and analyse the possible relations with ethnocentrism and product knowledge. Finally, from a prospective point of view, researchers should also investigate the relations among the different latent constructs that affect consumer choices by using more integrated regression models, e.g., structural equation models.
The authors would like to thank the anonymous reviewers for providing insightful suggestions and comments.
The authors declare no conflicts of interest.
| [1] |
Rahim HFA, Sibai A, Khader Y, et al. (2014) Non-communicable diseases in the Arab world. Lancet 383: 356–367. doi: 10.1016/S0140-6736(13)62383-1

|
| [2] |
Spring B, Moller AC, Coons MJ (2012) Multiple health behaviours: Overview and implications. J Public Health 34: i3–i10. doi: 10.1093/pubmed/fdr111
|
| [3] | Musaiger A, Al-Mannai M, Tayyem R, et al. (2012) Prevalence of overweight and obesity among adolescents in seven Arab countries: A cross-cultural study. J Obes 2012: 981390. |
| [4] | Sachithananthan V, Buzgeia M, Awad F, et al. (2013) Nutritional status, dietary profile and selected lifestyle attributes of adolescents and early adults in Benghazi, Libya. J Food Nutr Disor d 3: 2. |
| [5] |
Salam A, Alshekteria A, Mohammed H, et al. (2012) Physical, mental, emotional and social health status of adolescents and youths in Benghazi, Libya. East Mediterr Health J 18: 586–598. doi: 10.26719/2012.18.6.586
|
| [6] | Tsouros A, Dowding G, Thompson J, et al. (1998) Health promoting universities: Concept, experience and framework for action. Copenhagen: World Health Organization. |
| [7] | Education Audiovisual and Culture Executive Agency (EACEA), Higher Education in Libya, 2012. Available from: http://eacea.ec.europa.eu/tempus/participating_countries/overview/libya_overview_of_hes_final.pdf (accessed 20 April 2018). |
| [8] |
Tamtam A, Gallagher F, Olabi AG, et al. (2011) Higher education in Libya, system under stress. Proc Soc Behav Sci 29: 742–751. doi: 10.1016/j.sbspro.2011.11.300
|
| [9] |
Ansari WE, Khalil K, Stock C (2014) Symptoms and health complaints and their association with perceived stressors among students at nine Libyan universities. Int J Environ Res Public Health 11: 12088–12107. doi: 10.3390/ijerph111212088
|
| [10] |
Conry MC, Morgan K, Curry P, et al. (2011) The clustering of health behaviours in Ireland and their relationship with mental health, self-rated health and quality of life. BMC Public Health 11: 692. doi: 10.1186/1471-2458-11-692
|
| [11] |
So ES, Park BM (2016) Health behaviors and academic performance among Korean adolescents. Asian Nurs Res 10: 123–127. doi: 10.1016/j.anr.2016.01.004
|
| [12] |
Tucker P, Gilliland J (2007) The effect of season and weather on physical activity: A systematic review. Public Health 121: 909–922. doi: 10.1016/j.puhe.2007.04.009
|
| [13] | Molnar BE, Gortmaker SL, Bull FC, et al. (2004) Unsafe to play? Neighborhood disorder and lack of safety predict reduced physical activity among urban children and adolescents. Am J Health Promot 18: 378–386. |
| [14] |
Abbasi IN (2014) Socio-cultural barriers to attaining recommended levels of physical activity among females: A review of literature. Quest 66: 448–467. doi: 10.1080/00336297.2014.955118
|
| [15] |
Moodie R, Stuckler D, Monteiro C, et al. (2013) Profits and pandemics: Prevention of harmful effects of tobacco, alcohol, and ultra-processed food and drink industries. Lancet 381: 670–679. doi: 10.1016/S0140-6736(12)62089-3
|
| [16] |
El Ansari W, Khalil K, Crone D, et al. (2014) Physical activity and gender differences: Correlates of compliance with recommended levels of five forms of physical activity among students at nine universities in Libya. Cent Eur J Public Health 22: 98. doi: 10.21101/cejph.a4011
|
| [17] |
Baskin-Sommers A, Sommers I (2006) The co-occurrence of substance use and high-risk behaviors. J Adolesc Health 38: 609–611. doi: 10.1016/j.jadohealth.2005.07.010
|
| [18] | Willoughby T, Chalmers H, Busseri MA (2004) Where is the syndrome? Examining co-occurrence among multiple problem behaviors in adolescence. J Consult Clin Psychol 72: 1022. |
| [19] | Zweig JM, Lindberg LD, Mcginley KA (2001) Adolescent health risk profiles: The co-occurrence of health risks among females and males. J Youth Adolesc 30: 707–728. |
| [20] | Schuit AJ, van Loon AJM, Tijhuis M, et al. (2002) Clustering of lifestyle risk factors in a general adult population. Prev Med 35: 219–224. |
| [21] |
Costa E, Dias CM, Oliveira L, et al. (2014) Clustering of behavioural risk factors in the Portuguese population: Data from National Health Interview Survey. J Behav Health 3: 205–211. doi: 10.5455/jbh.20141122100623
|
| [22] |
Huang DY, Lanza HI, Murphy DA, et al. (2012) Parallel development of risk behaviors in adolescence: Potential pathways to co-occurrence. Int J Behav Dev 36: 247–257. doi: 10.1177/0165025412442870
|
| [23] |
Hale D, Viner R (2012) Policy responses to multiple risk behaviours in adolescents. J Public Health 34: i11–i19. doi: 10.1093/pubmed/fdr112
|
| [24] |
Scott A, Knott M (1974) A cluster analysis method for grouping means in the analysis of variance. Biometrics 30: 507–512. doi: 10.2307/2529204
|
| [25] | Kaufman L, Rousseeuw PJ (2009) Finding groups in data: An introduction to cluster analysis. New Jersey: John Wiley & Sons. |
| [26] |
Rapkin BD, Luke DA (1993) Cluster analysis in community research: Epistemology and practice. Am J Community Psychol 21: 247–277. doi: 10.1007/BF00941623
|
| [27] |
Lanza ST, Cooper BR (2016) Latent class analysis for developmental research. Child Dev Perspect 10: 59–64. doi: 10.1111/cdep.12163
|
| [28] | El Ansari W, Stock C (2010) Is the health and wellbeing of university students associated with their academic performance? Cross sectional findings from the United Kingdom. Int J Environ Res Public Health 7: 509–527. |
| [29] | El Ansari W, Stock C, Mills C (2013) Is alcohol consumption associated with poor academic achievement in university students? Int J Prev Med 1: 1175–1188. |
| [30] |
American College Health Association (2007) American College Health Association National College Health Assessment (ACHA-NCHA): Spring 2006 Reference Group Report (abridged). J Am Coll Health 55: 195. doi: 10.3200/JACH.55.4.195-206
|
| [31] | Stock C, Kücük N, Miseviciene I, et al. (2002) Differences in health complaints between university students from three European countries. Eur J Public Health 12: 26–27. |
| [32] |
Haskell WL, Lee IM, Pate RR, et al. (2007) Physical activity and public health: Updated recommendation for adults from the American College of Sports Medicine and the American Heart Association. Circulation 116: 1081. doi: 10.1161/CIRCULATIONAHA.107.185649
|
| [33] |
Mikolajczyk RT, El Ansari W, Maxwell AE (2009) Food consumption frequency and perceived stress and depressive symptoms among students in three European countries. Nutr J 8: 31. doi: 10.1186/1475-2891-8-31
|
| [34] | Hurrelmann K, Kolip P (1994) The Youth Health Survey. Public Relations Service, SFB 227, No 11. Bielefeld: University of Bielefeld. |
| [35] | El Ansari W, Stock C, John J, et al. (2011) Health promoting behaviours and lifestyle characteristics of students at seven universities in the UK. Cent Eur J Public Health 19: 197–204. |
| [36] |
Stock C, Mikolajczyk R, Bloomfield K, et al. (2009) Alcohol consumption and attitudes towards banning alcohol sales on campus among European university students. Public Health 123: 122–129. doi: 10.1016/j.puhe.2008.12.009
|
| [37] | Mchugh ML (2013) The chi-square test of independence. Biochem Med 23: 143–149. |
| [38] |
He FJ, Nowson CA, Macgregor GA (2006) Fruit and vegetable consumption and stroke: Meta-analysis of cohort studies. Lancet 367: 320–326. doi: 10.1016/S0140-6736(06)68069-0
|
| [39] | World Health Organization, Global recommendations on physical activity for health, 2010. Available from: http://www.who.int/dietphysicalactivity/factsheet_recommendations/en/ (accesssed 9 January 2018). |
| [40] |
Murray CJ, Vos T, Lozano R, et al. (2012) Disability-adjusted life years (DALYs) for 291 diseases and injuries in 21 regions, 1990–2010: A systematic analysis for the Global Burden of Disease Study 2010. Lancet 380: 2197–2223. doi: 10.1016/S0140-6736(12)61689-4
|
| [41] | Buck D, Frosini F (2012) Clustering of unhealthy behaviours over time: Implications for policy and practice. Available from: http://www.haringey.gov.uk/sites/haringeygovuk/files/clustering-of-unhealthy-behaviours-over-time-aug-2013.pdf (accessed 2 Febraury 2018). |
| [42] |
Ye YL, Wang PG, Qu GC, et al. (2016) Associations between multiple health risk behaviors and mental health among Chinese college students. Psychol Health Med 21: 377–385. doi: 10.1080/13548506.2015.1070955
|
| [43] |
Alzahrani SG, Watt RG, Sheiham A, et al. (2014) Patterns of clustering of six health-compromising behaviours in Saudi adolescents. BMC Public Health 14: 1215. doi: 10.1186/1471-2458-14-1215
|
| [44] |
Quintiliani L, Allen J, Marino M, et al. (2010) Multiple health behavior clusters among female college students. Patient Educ Couns 79: 134–137. doi: 10.1016/j.pec.2009.08.007
|
| [45] |
Dodd LJ, Al-Nakeeb Y, Nevill A, et al. (2010) Lifestyle risk factors of students: A cluster analytical approach. Prev Med 51: 73–77. doi: 10.1016/j.ypmed.2010.04.005
|
| [46] |
Lv J, Liu Q, Ren Y, et al. (2011) Socio-demographic association of multiple modifiable lifestyle risk factors and their clustering in a representative urban population of adults: A cross-sectional study in Hangzhou, China. Int J Behav Nutr Phys Act 8: 40. doi: 10.1186/1479-5868-8-40
|
| [47] | Galan I, Rodriguez-Artalejo F, Tobias A, et al. (2005) Clustering of behavior-related risk factors and its association with subjective health. Gac Sanit 19: 370–378. |
| [48] |
Kritsotakis G, Psarrou M, Vassilaki M, et al. (2016) Gender differences in the prevalence and clustering of multiple health risk behaviours in young adults. J Adv Nurs 72: 2098–2113. doi: 10.1111/jan.12981
|
| [49] |
Haug S, Schaub MP, Gross CS, et al. (2013) Predictors of hazardous drinking, tobacco smoking and physical inactivity in vocational school students. BMC Public Health 13: 475. doi: 10.1186/1471-2458-13-475
|
| [50] | Idowu A, Fatusi AO, Olajide FO (2016) Clustering of behavioural risk factors for non-communicable diseases (NCDs) among rural-based adolescents in south-west Nigeria. Int J Adolesc Med Health. |
| [51] | Lippke S, Nigg CR, Maddock JE (2012) Health-promoting and health-risk behaviors: Theory-driven analyses of multiple health behavior change in three international samples. Int J Behav Med 19: 1–13. |
| [52] |
Nigg CR, Lee H, Hubbard AE, et al. (2009) Gateway health behaviors in college students: Investigating transfer and compensation effects. J Am Coll Health 58: 39–44. doi: 10.3200/JACH.58.1.39-44
|
| [53] |
Costa FM, Jessor R, Turbin MS (2007) College student involvement in cigarette smoking: The role of psychosocial and behavioral protection and risk. Nicotine Tob Res 9: 213–224. doi: 10.1080/14622200601078558
|
| [54] | Raynor DA, Levine H (2005) Associations between the five-factor model of personality and health behaviors among college students. J Am Coll Health 58: 73–82. |
| [55] |
Busch V, Van Stel HF, Schrijvers AJ, et al. (2013) Clustering of health-related behaviors, health outcomes and demographics in Dutch adolescents: A cross-sectional study. BMC Public Health 13: 1118. doi: 10.1186/1471-2458-13-1118
|
| [56] |
Li Y, Feng X, Zhang M, et al. (2016) Clustering of cardiovascular behavioral risk factors and blood pressure among people diagnosed with hypertension: A nationally representative survey in China. Sci Rep 6: 27627. doi: 10.1038/srep27627
|
| [57] | Jawad M, Lee JT, Millett C (2015) Waterpipe tobacco smoking prevalence and correlates in 25 Eastern Mediterranean and Eastern European countries: Cross-sectional analysis of the Global Youth Tobacco Survey. Nicotine Tob Res 18: 395–402. |
| 1. | Juliette Richetin, Eugenio Demartini, Anna Gaviglio, Elena Claire Ricci, Stefanella Stranieri, Alessandro Banterle, Marco Perugini, The biasing effect of evocative attributes at the implicit and explicit level: The tradition halo and the industrial horn in food products evaluations, 2019, 09696989, 101890, 10.1016/j.jretconser.2019.101890 | |
| 2. | José Alexandres Dos Santos, Rosamaria Moura-Leite, Matheus Wemerson Gomes Pereira, Marta Pagán, Social and environmental disclosure of the largest companies in Brazil’s agribusiness sector, 2020, ahead-of-print, 1747-1117, 10.1108/SRJ-01-2019-0009 | |
| 3. | Elena Castellari, Elena Claire Ricci, Stefanella Stranieri, Stéphan Marette, Martina Sarnataro, Claudio Soregaroli, Relationships Between Health and Environmental Information on the Willingness to Pay for Functional Foods: The Case of a New Aloe Vera Based Product, 2019, 11, 2072-6643, 2781, 10.3390/nu11112781 | |
| 4. | Valentina Maria Merlino, Filippo Brun, Alice Versino, Simone Blanc, Milk packaging innovation: Consumer perception and willingness to pay, 2020, 5, 2471-2086, 307, 10.3934/agrfood.2020.2.307 | |
| 5. | Lucio Cappelli, Fabrizio D’Ascenzo, Maria Felice Arezzo, Roberto Ruggieri, Irina Gorelova, The Willingness to Pay in the Food Sector. Testing the Hypothesis of Consumer Preferences for Some Made in Italy Products, 2020, 12, 2071-1050, 6275, 10.3390/su12156275 | |
| 6. | Sergio Erick García‐Barrón, Ana Luisa Gutiérrez‐Salomón, Judith Jaimez‐Ordaz, Socorro Josefina Villanueva‐Rodríguez, Influence of expectations on the level of liking of a local coffee in Mexico, 2021, 101, 0022-5142, 1572, 10.1002/jsfa.10776 | |
| 7. | Juan Jose Blazquez-Resino, Santiago Gutierrez-Broncano, Pedro Jimenez-Estevez, Israel Roberto Perez-Jimenez, The Effect of Ethnocentrism on Product Evaluation and Purchase Intention: The Case of Extra Virgin Olive Oil (EVOO), 2021, 13, 2071-1050, 4744, 10.3390/su13094744 | |
| 8. | Marzia Ingrassia, Claudio Bellia, Chiara Giurdanella, Pietro Columba, Stefania Chironi, Digital Influencers, Food and Tourism—A New Model of Open Innovation for Businesses in the Ho.Re.Ca. Sector, 2022, 8, 2199-8531, 50, 10.3390/joitmc8010050 | |
| 9. | Giuseppina Migliore, Giuseppina Rizzo, Giorgio Schifani, Giuseppe Quatrosi, Luigi Vetri, Riccardo Testa, Ethnocentrism Effects on Consumers’ Behavior during COVID-19 Pandemic, 2021, 9, 2227-7099, 160, 10.3390/economies9040160 | |
| 10. | Zi-Xu Wang, Amer Hamzah Bin Jantan, Ruo-Xi Wu, Yue Gong, Meng-Ru Cao, Philip Pong Weng Wong, Lei Wang, Exploring consumers’ intention toward domestic energy-saving vehicles: Some insights from China, 2022, 13, 1664-1078, 10.3389/fpsyg.2022.927709 | |
| 11. | Claudio Bellia, Pietro Columba, Marzia Ingrassia, The Brand–Land Identity of Etna Volcano Valley Wines: A Policy Delphi Study, 2022, 12, 2077-0472, 811, 10.3390/agriculture12060811 | |
| 12. | Stefania Chironi, Simona Bacarella, Luca Altamore, Pietro Columba, Marzia Ingrassia, Consumption of spices and ethnic contamination in the daily diet of Italians - consumers’ preferences and modification of eating habits, 2021, 8, 2352-6181, 10.1186/s42779-021-00082-8 | |
| 13. | Mariarosaria Simeone, Morena Cinquegrana, Carlo Russo, It Seems Italian, Doesn’t It? An Exploratory Analysis of English and Spanish Consumers about Italian Appearance Food Products, 2022, 11, 2304-8158, 1392, 10.3390/foods11101392 |

Walid El Ansari, Khalid A Khalil, Derrick Ssewanyana, Christiane Stock. Behavioral risk factor clusters among university students at nine universities in Libya[J]. AIMS Public Health, 2018, 5(3): 296-311. doi: 10.3934/publichealth.2018.3.296

| Variable | Eataly customers (%) | Non-Eataly customers (%) |
| Age | ||
| 18–30 | 23.4 | 25.7 |
| 31–40 | 16.0 | 19.3 |
| 41–50 | 22.7 | 22.9 |
| more than 50 | 38.3 | 32.1 |
| Gender | ||
| Male | 53.2 | 48.6 |
| Female | 46.8 | 51.4 |
| Educational level* | ||
| Hauptschule | 3.2 | 4.6 |
| Realschule | 21.3 | 24.8 |
| Abitur | 13.8 | 27.5 |
| Hochschulabschluss | 61.7 | 43.1 |
| Income | ||
| Less than 20,000 € | 16.0 | 11.9 |
| 20,000–40,000 € | 13.8 | 15.6 |
| 40,000–60,000 € | 23.4 | 17.4 |
| More than 60,000 € | 12.8 | 17.4 |
| Refuse to answer | 34.0 | 37.7 |
| *For accuracy, we present the educational level of the German scholastic system: Hauptschule = Secondary school, from grade 5 to 9; Realschule = Secondary school, from grade 5 to 10; Abitur = Final degree of Gymnasium, secondary school from 5 to 13; Hochschulabschluss = Final degree of the University. | ||
DownLoad:
CSV
| Variable name | Scale | Description |
| Ethnocentrism variable (CET scale) | ||
| CET1 | scale (1–7)* | Only those products that are unavailable in Germany should be imported |
| CET2 | scale (1–7)* | German products, first, last and foremost |
| CET3 | scale (1–7)* | A real German should always buy German-made products' |
| CET4 | scale (1–7)* | Germans should not buy foreign products, because this hurts German business and causes unemployment |
| CET5 | scale (1–7)* | It may cost me in the long-run but I prefer to support German products' |
| CET6 | scale (1–7)* | German consumers who purchase products made in other countries are responsible for putting their fellow Germans out of work |
| Product knowledge | ||
| SubKnow1 | scale (1–7)* | I know pretty much about fresh pasta |
| SubKnow2 | scale (1–7)* | I know how to judge the quality of fresh pasta |
| ObjKnow1 | dummy (0–1) | Wrong/correct answer to closed-answer questions about traditional Italian food products (long cut pasta) |
| ObjKnow2 | dummy (0–1) | Wrong/correct answer to closed-answer to questions about traditional Italian food products (stuffed pasta) |
| ObjKnow3 | dummy (0–1) | Wrong/correct answer to closed-answer to questions about traditional Italian food products (typical Italian dish) |
| ObjKnow4 | dummy (0–1) | Wrong/correct answer to closed-answer questions about traditional Italian food products (typical dish form Southern Italy) |
| Food purchasing habits | ||
| Eataly | dummy (0–1) | Dummy variable on purchases at Eataly (0 = no; 1 = yes) |
| Italian products | scale (1–5) | Frequency of purchase of authentic Italian food products (never, yearly, monthly, weekly) |
| *Level of agreement: 1 = strongly disagree; 7 = strongly agree. | ||
DownLoad:
CSV
| Eataly customers | Non-Eataly customers | |||
| Variable | Mean | Std. Deviation | Mean | Std. Deviation |
| ETN1 | 3.42 | 1.97 | 3.27 | 2.06 |
| ETN2 | 1.58 | 1.09 | 1.98 | 1.45 |
| ETN3 | 2.09 | 1.48 | 2.28 | 1.51 |
| ETN4 | 1.46 | 0.96 | 1.80 | 1.12 |
| ETN5 | 1.90 | 1.29 | 2.40 | 1.65 |
| ETN6 | 1.22 | 0.64 | 1.47 | 1.16 |
DownLoad:
CSV
| Eataly customers | Non-Eataly customers | |||
| Variable | Mean | Std. Deviation | Mean | Std. Deviation |
| SUB1 | 5.54 | 1.58 | 5.38 | 1.60 |
| SUB2 | 4.46 | 1.71 | 4.22 | 1.87 |
| OBJ_easy | 1.91 | 0.35 | 1.86 | 0.42 |
| OBJ_advanced | 0.68 | 0.71 | 0.61 | 0.64 |
DownLoad:
CSV
| Variable | Factor 1 | Factor 2 |
| ETN1 | 0.408 | 0.039 |
| ETN2 | 0.579 | −0.119 |
| ETN3 | 0.701 | −0.109 |
| ETN4 | 0.769 | −0.240 |
| ETN5 | 0.583 | −0.246 |
| ETN6 | 0.431 | −0.162 |
| SUB1 | 0.142 | 0.907 |
| SUB2 | 0.238 | 0.670 |
| OBJ_easy | 0.033 | 0.308 |
| OBJ_advanced | 0.001 | 0.275 |
DownLoad:
CSV
| Ethnocentrism, non-Eataly customers | |||||
| Estimate | Std. Error | t-value | Pr(>|t|) | significance | |
| (Intercept) | 0.18715 | 0.21112 | 0.886 | 0.377 | |
| GENDER (male) | −0.59296 | 0.18608 | −3.187 | 0.002 | ** |
| AGE 31–40 | 0.16497 | 0.28310 | 0.583 | 0.561 | |
| AGE 41–50 | 0.06292 | 0.26927 | 0.234 | 0.816 | |
| AGE morethan 50 | −0.24322 | 0.25059 | −0.971 | 0.334 | |
| EDUCATION abitur | 0.28370 | 0.22869 | 1.241 | 0.218 | |
| EDUCATION realschule | 0.53660 | 0.24286 | 2.210 | 0.029 | * |
| EDUCATION hauptschule | 0.92672 | 0.45003 | 2.059 | 0.042 | * |
| R-squared | 0.186 | ||||
| Adjusted R-squared | 0.130 | ||||
| DF | 101 | ||||
| p-value | 0.003 | ||||
| Notes: Signif. codes: 0 '***' 0.001 '**' 0.01 '*' 0.05 '.' 0.1 ' ' 1. | |||||
DownLoad:
CSV
| Ethnocentrism, Eataly customers | |||||
| Estimate | Std. Error | t-value | Pr(>|t|) | significance | |
| (Intercept) | −0.04584 | 0.17213 | −0.266 | 0.791 | |
| GENDER (male) | −0.34965 | 0.15331 | −2,281 | 0.025 | * |
| AGE 31–40 | 0.38836 | 0.24241 | 1,602 | 0.113 | |
| AGE 41–50 | 0.07972 | 0.23002 | 0.347 | 0.730 | |
| AGE morethan 50 | −0.05034 | 0.20627 | −0.244 | 0.808 | |
| EDUCATION reordabitur | 0.21740 | 0.22807 | 0.953 | 0.343 | |
| EDUCATION reordrealschule | −0.12147 | 0.19426 | −0.625 | 0.533 | |
| EDUCATION reordhauptschule | 0.15983 | 0.43385 | 0.368 | 0.713 | |
| R-squared | 0.112 | ||||
| Adjusted R-squared | 0.041 | ||||
| DF | 86 | ||||
| p-value | 0.1592 | ||||
| Notes: Signif. codes: 0 '***' 0.001 '**' 0.01 '*' 0.05 '.' 0.1 ' ' 1. | |||||
DownLoad:
CSV
| Italian products knowledge, non-Eataly customers | |||||
| Estimate | Std. Error | t-value | Pr(>|t|) | significance | |
| (Intercept) | −0.29309 | 0.19796 | −1.481 | 0.142 | |
| GENDER (male) | −0.43917 | 0.17449 | −2.517 | 0.013 | * |
| AGE 31–40 | 0.62188 | 0.26546 | 2.343 | 0.021 | * |
| AGE 41–50 | 0.61096 | 0.25249 | 2.420 | 0.017 | * |
| AGE morethan 50 | 0.81631 | 0.23498 | 3.474 | 0.001 | *** |
| EDUCATION abitur | 0.00433 | 0.21444 | 0.020 | 0.984 | |
| EDUCATION realschule | −0.36016 | 0.22773 | −1.582 | 0.117 | |
| EDUCATION hauptschule | −0.18559 | 0.42199 | −0.440 | 0.661 | |
| R-squared | 0.158 | ||||
| Adjusted R-squared | 0.100 | ||||
| DF | 101 | ||||
| p-value | 0.013 | ||||
| Notes: Signif. codes: 0 '***' 0.001 '**' 0.01 '*' 0.05 '.' 0.1 ' ' 1. | |||||
DownLoad:
CSV
| Italian products knowledge, Eataly customers | |||||
| Estimate | Std. Error | t-value | Pr(>|t|) | significance | |
| (Intercept) | 0.03076 | 0.21661 | 0.142 | 0.887 | |
| GENDER (male) | −0.13972 | 0.19292 | −0.724 | 0.471 | |
| AGE 31–40 | 0.18703 | 0.30504 | 0.613 | 0.541 | |
| AGE 41–50 | 0.52842 | 0.28945 | 1.826 | 0.071 | |
| AGE morethan 50 | 0.30250 | 0.25957 | 1.165 | 0.247 | |
| EDUCATION abitur | −0.61764 | 0.28700 | −2.152 | 0.034 | * |
| EDUCATION realschule | −0.15604 | 0.24446 | −0.638 | 0.525 | |
| EDUCATION hauptschule | −0.51515 | 0.54594 | −0.944 | 0.348 | |
| R-squared | 0.112 | ||||
| Adjusted R-squared | 0.039 | ||||
| DF | 86 | ||||
| p-value | 0.1613 | ||||
| Notes: Signif. codes: 0 '***' 0.001 '**' 0.01 '*' 0.05 '.' 0.1 ' ' 1. | |||||
DownLoad:
CSV
| Non eataly customers | ||||||||||
| Model 1 | Model 2 | |||||||||
| Estimate | Std. Error | t-value | Pr(>|t|) | significance | Estimate | Std. Error | t-value | Pr(>|t|) | significance | |
| (Intercepts) | ||||||||||
| never|year | −4,138,112 | 0.721297 | −57,370 | 9.6E-06 | *** | −384,180 | 0.82328 | −46,664 | 3.07E-03 | *** |
| year|month | −2,129,359 | 0.308493 | −69,024 | 5.1E-09 | *** | −179,588 | 0.49726 | −36,116 | 0.0003043 | *** |
| month|week | 0.080418 | 0.196692 | 0.4089 | 0.6826 | 0.56813 | 0.45026 | 12,618 | 0.2070221 | ||
| (Explanatory variables) | ||||||||||
| GENDER (male) | 0.24283 | 0.42665 | 0.5692 | 0.5692489 | ||||||
| AGE 31–40 | −0.48598 | 0.58290 | −0.8337 | 0.4044353 | ||||||
| AGE 41–50 | 0.76475 | 0.58939 | 12,975 | 0.1944476 | ||||||
| AGE morethan 50 | 0.90878 | 0.55132 | 16,484 | 0.0992744 | ||||||
| EDUCATION abitur | −0.13429 | 0.48279 | −0.2782 | 0.7808877 | ||||||
| EDUCATION realschule | 0.12468 | 0.53617 | 0.2325 | 0.8161165 | ||||||
| EDUCATION hauptschule | −0.42209 | 0.86700 | −0.4868 | 0.6263756 | ||||||
| Factor 1 | −0.288937 | 0.184715 | −15,642 | 0.1178 | −0.22096 | 0.20746 | −10,651 | 0.2868503 | ||
| Factor 2 | 0.326450 | 0.200457 | 16,285 | 0.1034 | 0.30237 | 0.22712 | 13,313 | 0.1830912 | ||
| N. of observations | 109 | 109 | ||||||||
| Akaike Information Criterion (AIC) | 228.54 | 145.57 | ||||||||
| Notes: Signif. codes: 0 '***' 0.001 '**' 0.01 '*' 0.05 '.' 0.1 ' ' 1. | ||||||||||
DownLoad:
CSV
| Eataly customers | ||||||||||
| Model 1 | Model 2 | |||||||||
| Estimate | Std. Error | t-value | Pr(>|t|) | significance | Estimate | Std. Error | t-value | Pr(>|t|) | significance | |
| never|year | −1045854 | 2644408 | −0.3955 | 0.69248 | −11261026 | 28092799 | −0.4009 | 0.68853 | ||
| year|month | −396228 | 0.72498 | −54654 | 4.6E-05 | *** | −3595964 | 0.885406 | −40614 | 0.04879 | *** |
| month|week | −0.37777 | 0.22206 | −17012 | 0.08890 | . | 0.387025 | 0.513935 | 0.7531 | 0.45141 | |
| (Explanatory variables) | ||||||||||
| GENDER (male) | −0.238943 | 0.502088 | −0.4759 | 0.63415 | ||||||
| AGE 31–40 | 0.959550 | 0.740327 | 12961 | 0.19494 | ||||||
| AGE 41–50 | 1864401 | 0.763756 | 24411 | 0.01464 | * | |||||
| AGE morethan 50 | 1590115 | 0.646868 | 24582 | 0.01396 | * | |||||
| EDUCATION abitur | 1111720 | 0.793847 | 14004 | 0.16139 | ||||||
| EDUCATION realschule | −1461593 | 0.591462 | −24712 | 0.01347 | * | |||||
| EDUCATION hauptschule | −2921894 | 1489000 | −19623 | 0.04973 | * | |||||
| Factor 1 | 0.12715 | 0.29616 | 0.4293 | 0.66768 | 0.055926 | 0.334351 | 0.1673 | 0.86716 | ||
| Factor 2 | 0.59636 | 0.23479 | 25400 | 0.01109 | * | 0.620954 | 0.265170 | 23417 | 0.01920 | * |
| N. of observations | 94 | 94 | ||||||||
| Akaike Information Criterion (AIC) | 232.70 | 143.69 | ||||||||
| Notes: Signif. codes: 0 '***' 0.001 '**' 0.01 '*' 0.05 '.' 0.1 ' ' 1. | ||||||||||
DownLoad:
CSV
| Variable | Eataly customers (%) | Non-Eataly customers (%) |
| Age | ||
| 18–30 | 23.4 | 25.7 |
| 31–40 | 16.0 | 19.3 |
| 41–50 | 22.7 | 22.9 |
| more than 50 | 38.3 | 32.1 |
| Gender | ||
| Male | 53.2 | 48.6 |
| Female | 46.8 | 51.4 |
| Educational level* | ||
| Hauptschule | 3.2 | 4.6 |
| Realschule | 21.3 | 24.8 |
| Abitur | 13.8 | 27.5 |
| Hochschulabschluss | 61.7 | 43.1 |
| Income | ||
| Less than 20,000 € | 16.0 | 11.9 |
| 20,000–40,000 € | 13.8 | 15.6 |
| 40,000–60,000 € | 23.4 | 17.4 |
| More than 60,000 € | 12.8 | 17.4 |
| Refuse to answer | 34.0 | 37.7 |
| *For accuracy, we present the educational level of the German scholastic system: Hauptschule = Secondary school, from grade 5 to 9; Realschule = Secondary school, from grade 5 to 10; Abitur = Final degree of Gymnasium, secondary school from 5 to 13; Hochschulabschluss = Final degree of the University. | ||
| Variable name | Scale | Description |
| Ethnocentrism variable (CET scale) | ||
| CET1 | scale (1–7)* | Only those products that are unavailable in Germany should be imported |
| CET2 | scale (1–7)* | German products, first, last and foremost |
| CET3 | scale (1–7)* | A real German should always buy German-made products' |
| CET4 | scale (1–7)* | Germans should not buy foreign products, because this hurts German business and causes unemployment |
| CET5 | scale (1–7)* | It may cost me in the long-run but I prefer to support German products' |
| CET6 | scale (1–7)* | German consumers who purchase products made in other countries are responsible for putting their fellow Germans out of work |
| Product knowledge | ||
| SubKnow1 | scale (1–7)* | I know pretty much about fresh pasta |
| SubKnow2 | scale (1–7)* | I know how to judge the quality of fresh pasta |
| ObjKnow1 | dummy (0–1) | Wrong/correct answer to closed-answer questions about traditional Italian food products (long cut pasta) |
| ObjKnow2 | dummy (0–1) | Wrong/correct answer to closed-answer to questions about traditional Italian food products (stuffed pasta) |
| ObjKnow3 | dummy (0–1) | Wrong/correct answer to closed-answer to questions about traditional Italian food products (typical Italian dish) |
| ObjKnow4 | dummy (0–1) | Wrong/correct answer to closed-answer questions about traditional Italian food products (typical dish form Southern Italy) |
| Food purchasing habits | ||
| Eataly | dummy (0–1) | Dummy variable on purchases at Eataly (0 = no; 1 = yes) |
| Italian products | scale (1–5) | Frequency of purchase of authentic Italian food products (never, yearly, monthly, weekly) |
| *Level of agreement: 1 = strongly disagree; 7 = strongly agree. | ||
| Eataly customers | Non-Eataly customers | |||
| Variable | Mean | Std. Deviation | Mean | Std. Deviation |
| ETN1 | 3.42 | 1.97 | 3.27 | 2.06 |
| ETN2 | 1.58 | 1.09 | 1.98 | 1.45 |
| ETN3 | 2.09 | 1.48 | 2.28 | 1.51 |
| ETN4 | 1.46 | 0.96 | 1.80 | 1.12 |
| ETN5 | 1.90 | 1.29 | 2.40 | 1.65 |
| ETN6 | 1.22 | 0.64 | 1.47 | 1.16 |
| Eataly customers | Non-Eataly customers | |||
| Variable | Mean | Std. Deviation | Mean | Std. Deviation |
| SUB1 | 5.54 | 1.58 | 5.38 | 1.60 |
| SUB2 | 4.46 | 1.71 | 4.22 | 1.87 |
| OBJ_easy | 1.91 | 0.35 | 1.86 | 0.42 |
| OBJ_advanced | 0.68 | 0.71 | 0.61 | 0.64 |
| Variable | Factor 1 | Factor 2 |
| ETN1 | 0.408 | 0.039 |
| ETN2 | 0.579 | −0.119 |
| ETN3 | 0.701 | −0.109 |
| ETN4 | 0.769 | −0.240 |
| ETN5 | 0.583 | −0.246 |
| ETN6 | 0.431 | −0.162 |
| SUB1 | 0.142 | 0.907 |
| SUB2 | 0.238 | 0.670 |
| OBJ_easy | 0.033 | 0.308 |
| OBJ_advanced | 0.001 | 0.275 |
| Ethnocentrism, non-Eataly customers | |||||
| Estimate | Std. Error | t-value | Pr(>|t|) | significance | |
| (Intercept) | 0.18715 | 0.21112 | 0.886 | 0.377 | |
| GENDER (male) | −0.59296 | 0.18608 | −3.187 | 0.002 | ** |
| AGE 31–40 | 0.16497 | 0.28310 | 0.583 | 0.561 | |
| AGE 41–50 | 0.06292 | 0.26927 | 0.234 | 0.816 | |
| AGE morethan 50 | −0.24322 | 0.25059 | −0.971 | 0.334 | |
| EDUCATION abitur | 0.28370 | 0.22869 | 1.241 | 0.218 | |
| EDUCATION realschule | 0.53660 | 0.24286 | 2.210 | 0.029 | * |
| EDUCATION hauptschule | 0.92672 | 0.45003 | 2.059 | 0.042 | * |
| R-squared | 0.186 | ||||
| Adjusted R-squared | 0.130 | ||||
| DF | 101 | ||||
| p-value | 0.003 | ||||
| Notes: Signif. codes: 0 '***' 0.001 '**' 0.01 '*' 0.05 '.' 0.1 ' ' 1. | |||||
| Ethnocentrism, Eataly customers | |||||
| Estimate | Std. Error | t-value | Pr(>|t|) | significance | |
| (Intercept) | −0.04584 | 0.17213 | −0.266 | 0.791 | |
| GENDER (male) | −0.34965 | 0.15331 | −2,281 | 0.025 | * |
| AGE 31–40 | 0.38836 | 0.24241 | 1,602 | 0.113 | |
| AGE 41–50 | 0.07972 | 0.23002 | 0.347 | 0.730 | |
| AGE morethan 50 | −0.05034 | 0.20627 | −0.244 | 0.808 | |
| EDUCATION reordabitur | 0.21740 | 0.22807 | 0.953 | 0.343 | |
| EDUCATION reordrealschule | −0.12147 | 0.19426 | −0.625 | 0.533 | |
| EDUCATION reordhauptschule | 0.15983 | 0.43385 | 0.368 | 0.713 | |
| R-squared | 0.112 | ||||
| Adjusted R-squared | 0.041 | ||||
| DF | 86 | ||||
| p-value | 0.1592 | ||||
| Notes: Signif. codes: 0 '***' 0.001 '**' 0.01 '*' 0.05 '.' 0.1 ' ' 1. | |||||
| Italian products knowledge, non-Eataly customers | |||||
| Estimate | Std. Error | t-value | Pr(>|t|) | significance | |
| (Intercept) | −0.29309 | 0.19796 | −1.481 | 0.142 | |
| GENDER (male) | −0.43917 | 0.17449 | −2.517 | 0.013 | * |
| AGE 31–40 | 0.62188 | 0.26546 | 2.343 | 0.021 | * |
| AGE 41–50 | 0.61096 | 0.25249 | 2.420 | 0.017 | * |
| AGE morethan 50 | 0.81631 | 0.23498 | 3.474 | 0.001 | *** |
| EDUCATION abitur | 0.00433 | 0.21444 | 0.020 | 0.984 | |
| EDUCATION realschule | −0.36016 | 0.22773 | −1.582 | 0.117 | |
| EDUCATION hauptschule | −0.18559 | 0.42199 | −0.440 | 0.661 | |
| R-squared | 0.158 | ||||
| Adjusted R-squared | 0.100 | ||||
| DF | 101 | ||||
| p-value | 0.013 | ||||
| Notes: Signif. codes: 0 '***' 0.001 '**' 0.01 '*' 0.05 '.' 0.1 ' ' 1. | |||||
| Italian products knowledge, Eataly customers | |||||
| Estimate | Std. Error | t-value | Pr(>|t|) | significance | |
| (Intercept) | 0.03076 | 0.21661 | 0.142 | 0.887 | |
| GENDER (male) | −0.13972 | 0.19292 | −0.724 | 0.471 | |
| AGE 31–40 | 0.18703 | 0.30504 | 0.613 | 0.541 | |
| AGE 41–50 | 0.52842 | 0.28945 | 1.826 | 0.071 | |
| AGE morethan 50 | 0.30250 | 0.25957 | 1.165 | 0.247 | |
| EDUCATION abitur | −0.61764 | 0.28700 | −2.152 | 0.034 | * |
| EDUCATION realschule | −0.15604 | 0.24446 | −0.638 | 0.525 | |
| EDUCATION hauptschule | −0.51515 | 0.54594 | −0.944 | 0.348 | |
| R-squared | 0.112 | ||||
| Adjusted R-squared | 0.039 | ||||
| DF | 86 | ||||
| p-value | 0.1613 | ||||
| Notes: Signif. codes: 0 '***' 0.001 '**' 0.01 '*' 0.05 '.' 0.1 ' ' 1. | |||||
| Non eataly customers | ||||||||||
| Model 1 | Model 2 | |||||||||
| Estimate | Std. Error | t-value | Pr(>|t|) | significance | Estimate | Std. Error | t-value | Pr(>|t|) | significance | |
| (Intercepts) | ||||||||||
| never|year | −4,138,112 | 0.721297 | −57,370 | 9.6E-06 | *** | −384,180 | 0.82328 | −46,664 | 3.07E-03 | *** |
| year|month | −2,129,359 | 0.308493 | −69,024 | 5.1E-09 | *** | −179,588 | 0.49726 | −36,116 | 0.0003043 | *** |
| month|week | 0.080418 | 0.196692 | 0.4089 | 0.6826 | 0.56813 | 0.45026 | 12,618 | 0.2070221 | ||
| (Explanatory variables) | ||||||||||
| GENDER (male) | 0.24283 | 0.42665 | 0.5692 | 0.5692489 | ||||||
| AGE 31–40 | −0.48598 | 0.58290 | −0.8337 | 0.4044353 | ||||||
| AGE 41–50 | 0.76475 | 0.58939 | 12,975 | 0.1944476 | ||||||
| AGE morethan 50 | 0.90878 | 0.55132 | 16,484 | 0.0992744 | ||||||
| EDUCATION abitur | −0.13429 | 0.48279 | −0.2782 | 0.7808877 | ||||||
| EDUCATION realschule | 0.12468 | 0.53617 | 0.2325 | 0.8161165 | ||||||
| EDUCATION hauptschule | −0.42209 | 0.86700 | −0.4868 | 0.6263756 | ||||||
| Factor 1 | −0.288937 | 0.184715 | −15,642 | 0.1178 | −0.22096 | 0.20746 | −10,651 | 0.2868503 | ||
| Factor 2 | 0.326450 | 0.200457 | 16,285 | 0.1034 | 0.30237 | 0.22712 | 13,313 | 0.1830912 | ||
| N. of observations | 109 | 109 | ||||||||
| Akaike Information Criterion (AIC) | 228.54 | 145.57 | ||||||||
| Notes: Signif. codes: 0 '***' 0.001 '**' 0.01 '*' 0.05 '.' 0.1 ' ' 1. | ||||||||||
| Eataly customers | ||||||||||
| Model 1 | Model 2 | |||||||||
| Estimate | Std. Error | t-value | Pr(>|t|) | significance | Estimate | Std. Error | t-value | Pr(>|t|) | significance | |
| never|year | −1045854 | 2644408 | −0.3955 | 0.69248 | −11261026 | 28092799 | −0.4009 | 0.68853 | ||
| year|month | −396228 | 0.72498 | −54654 | 4.6E-05 | *** | −3595964 | 0.885406 | −40614 | 0.04879 | *** |
| month|week | −0.37777 | 0.22206 | −17012 | 0.08890 | . | 0.387025 | 0.513935 | 0.7531 | 0.45141 | |
| (Explanatory variables) | ||||||||||
| GENDER (male) | −0.238943 | 0.502088 | −0.4759 | 0.63415 | ||||||
| AGE 31–40 | 0.959550 | 0.740327 | 12961 | 0.19494 | ||||||
| AGE 41–50 | 1864401 | 0.763756 | 24411 | 0.01464 | * | |||||
| AGE morethan 50 | 1590115 | 0.646868 | 24582 | 0.01396 | * | |||||
| EDUCATION abitur | 1111720 | 0.793847 | 14004 | 0.16139 | ||||||
| EDUCATION realschule | −1461593 | 0.591462 | −24712 | 0.01347 | * | |||||
| EDUCATION hauptschule | −2921894 | 1489000 | −19623 | 0.04973 | * | |||||
| Factor 1 | 0.12715 | 0.29616 | 0.4293 | 0.66768 | 0.055926 | 0.334351 | 0.1673 | 0.86716 | ||
| Factor 2 | 0.59636 | 0.23479 | 25400 | 0.01109 | * | 0.620954 | 0.265170 | 23417 | 0.01920 | * |
| N. of observations | 94 | 94 | ||||||||
| Akaike Information Criterion (AIC) | 232.70 | 143.69 | ||||||||
| Notes: Signif. codes: 0 '***' 0.001 '**' 0.01 '*' 0.05 '.' 0.1 ' ' 1. | ||||||||||
