1.
Introduction
Long term energy planning has become a pressing issue since the future happenings depended on today's decision. Historically, while energy provided by biomass proved inadequate to supply the growing economies, people turned to hydropower later on to coal and then to oil, natural gas, and nuclear power. The twenty-first century is the time for the next transition from fossil fuels towards RE and climate change is one of the critical driving forces. Shifting toward RE sources is accelerated by rising fossil fuel costs, improving renewable energy technologies and implementing policies (reflected the real expense and negative impacts of fossil fuels) [1,2,3]. Transition to a low or zero carbon economy is strongly related to the integration of RE sources not only from the growing environmental concerns but also from the market due to the rapid reduction of the Levelized Cost of Electricity (LCOE). RE contributes to the sustainable development goals by providing environmental, social, and economic benefits. Some of the RE sources, such as wind and solar photo voltaic, have an intermittent character which is highly variable and have limited predictability which can have a significant impact on the operation of the electric power system [4,5]. With the recent technological advancements and rapid cost reductions, electrical energy storage is deployed which enhanced the system's performance and stability. The energy storage system aims to provide better energy management and improve supply and demand balance. Unlike conventional generators which only are used in creating electrical power and situates at the generation level, the energy storage systems have a variety of applications. They could be found in generation, transmission and distribution levels of a power system. Under the existence of intermittent RE resource, energy storage systems can maintain the stability of the power grid in an effectively feasible manner [6,7].
Concerning energy systems, there is a need to consider a comprehensive and detailed evaluation for providing a road-map towards sustainable and secure energy planning. In this context, a modelling framework is necessary to optimally determine the technologies to be utilized in the power sector according to specific projections and policy targets [8]. Generation expansion planning is a complicated task, combining techno-economic and environmental characteristics. For electricity systems with high shares of intermittent RE sources, numerous approaches attempt to link the gap between planning models and operation considering realistic operating details such as start-up cost, shut-down cost, ramp rates operating reserves, etc. These issues are typically addressed by models developed for the solution of the UC problem to meet the demand at a minimum operating cost. Due to rapid penetration of intermittent RE sources, the incorporation of short-term operational constraints in the generation expansion planning is considered as a methodological framework to address the power market dynamics and result in robust expansion plan ensuring the system reliability. Incorporation of short-term decisions into the long-term planning framework can strengthen the accuracy of the decisions and guaranty the stability of power networks [9,10]. Using this approach for a limited number of time slices can lead to averaging of intermittent RE generation by strongly underestimating their variability. An alternative approach to assigning a value to each time slice is to select a set of historical days for representing the whole year. Each selected day expresses a part of the year (e.g., a season or a month).
UC is an optimization problem which determines the operating schedule of a set of power generating units to satisfy the amount of electricity demand, considering a set of physical and operational constraints [11,12,13]. The objective of UC is to minimize the total operational cost over a time horizon, while a number of system and generator constraints must be met [14]. Typically, UC problem is a mixed integer and linear program (MILP), where the commitment decision variables are an integer, and the objective function and constraints are linear in both the commitment and the dispatch decision variables [15,16]. UC is rarely used in real system operation to realize uncertainty by a large number of scenarios dramatically increases the dimension of the optimization model [17]. Base on some studies, UC is employed for the determination of optimal operational scheduling in microgrids that consists a group of dispatchable and non-dispatchable generations in both grid-connected and isolated modes [18]. UC is also applied for the optimal schedule of combined heat and power, as well as for the systems consisting of controllable distributed generators and battery storage systems [19,20,21]. UC is not only necessary for the short-term dispatching of the power units, but also the midterm and long term interconnection issues. The combination of UC-based constraints into generation expansion planning can alter the optimal generation mix results to a significant extent [22].
The considering approach combining long term generation expansion planning, along with short-term optimal UC, can directly affect socioeconomic growth in Afghanistan. Sustainable energy supply is closely linked to climate change, economic development, agricultural productivity, food security, etc. Access to clean energy plays a critical role in achieving sustainable development goals. Indeed, there is a close connection between energy insufficiency and poverty indicators like illiteracy, life expectancy, and infant mortality. Afghanistan has an excellent renewable energy potential (estimated 300 GW) but is not appropriately utilized [23,24]. The existing electrical system of the country is state-owned with small private sectors participation and it is not secure, sufficient and sustainable. Per capita, power consumption is 195 kWh, which is among the lowest in the world. Afghanistan severely depends on politically unstable import power, which makes 78% of the total supply. The rural electrification rate is remarkably low despite forming 75% of the population and contributing 67% of the Gross Domestic Product (GDP). Afghanistan's energy sector seeks to increase the share of renewable energy, particularly solar and wind, by addressing the technological challenges, institutional barriers, along with the market restrictions. The development of renewable energy along optimal operation has the potential to assure energy security, while mitigating climate change impacts [25,26,27].
The rest of the paper is organized as follows: Section 2 details the electricity demand forecast for the long-term planning horizon in Afghanistan. Section 3 evaluates the capacity of renewable energy. The cost reduction of renewable energy technologies is demonstrated in Section 4. Section 5 presents the proposed expansion planning model. In Section 6, an optimal UC is calculated to estimate operational aspects of the system. Section 7 is discussion and analysis, and finally, the conclusion is drawn in Section 8.
2.
Forecasted electricity demand
Energy planning is usually performs according to studies base on demand forecasts and supply-side capabilities. Long-term load forecasting plays an essential role in the preparation, scheduling for construction of new generating plants, energy trade and sustainable economic development. For this study, demand-side is evaluated according to the historical data and forecasted energy need. The original set of electricity demand in Afghanistan are residential, commercial, registered and unregistered industries, governmental organizations, non-governmental organizations, and worshipping places. Base on assumptions and key parameters such as GDP growth, average tariff level, household consumption level, and connection rates, gross demand is expected to increase to 18,400 GWh from the current level of 7,769 GWh, and peak demand is expected to stand at around 3,500 MW by 2032. Forecasted electricity demand for each province and the total for the whole country is illustrated in Table 1 [28].
3.
Capacity evaluation for renewable energy potential
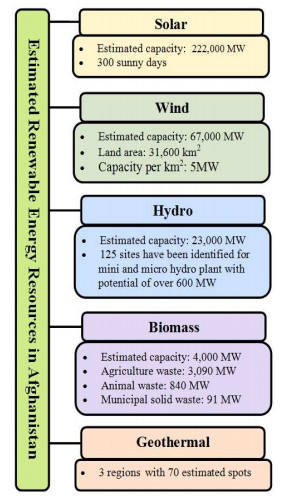
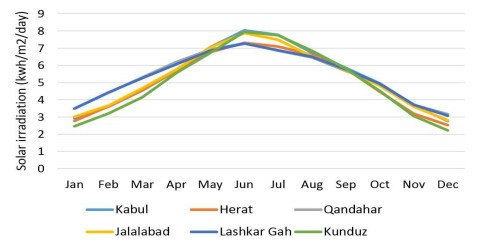
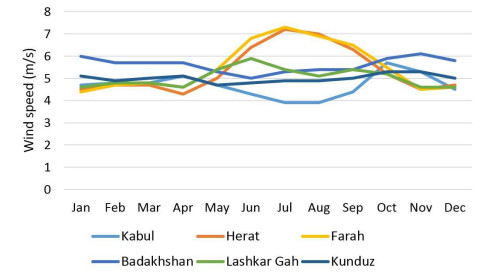
Supply-side for considered study is fulfilled based on the estimated RE potential and cost reduction of renewable energy technologies. Afghanistan enjoys an abundance of renewable energies, whose exploitation could help to meet future demand at cost levels that is economically attractive. Presently, there are few hydropower plants and small-scale solar and wind power projects. Based on the preliminary survey accomplished by the National Renewable Energy Laboratory (NREL) of the United States, the country has huge RE resources (presented in Figure 1). Solar with average radiation of 6.5 kWh/m$ ^2 $/day and more than 300 sunny days is preferred as the main option to meet future energy demand. Windy lands are estimated to be 31,600 km$ ^2 $ which form almost 5% of the country [29,30]. Solar radiation and wind speed measured for a different part of the country are presented in Figures 2 and 3, respectively. Hydropower dominates the present domestic power generation by total installed capacity of 300 MW. Besides grid-connected, there are some off-grid networks based on micro-hydro which are mostly available in the rural area. The feasible hydro potential is mainly estimated on Kokcha, Amu, Panj, Kabul, Panjshir and Kunar rivers. The country has biomass and geothermal potential to use as clean energy as well. Based on statistics, 6.8 million ton of crop residues were produced during 2008–2009, which could be a source of renewable energy if converted into biogas or biofuels [31]. Geothermal is determined in 70 spots with an estimated capacity of (4–100) MW. Anticipated fields are along the Hindukush mountain range and fault systems, such as Harirud, Badakhshan, Helmand, Arghandab and Farahrud [32].
4.
Cost review of renewable energy technologies
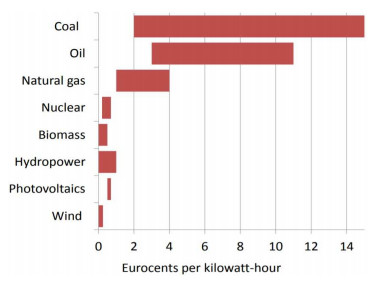
Availability of different energy sources at a reasonable cost is a significant factor to manipulate the expansion planning, appropriately. Several factors, including supported policies, continuous progression of technologies as well as competitive pressures, are contributing to the costs reduction of RE technologies. For renewable energies, the price generally needs to fall at the level which fossil-fuel power plants sell electricity. For such, as hydropower and biomass have already occurred, wind and geothermal have gotten closer [1]. RE based on solar, wind, and hydro can provide all new power globally by 2030, and replace all current non-renewable energies by 2050 [2]. Global average costs for the solar Photo Voltaic (PV) and the wind is expected to decline to about 0.05 $/kWh and 0.06 $/kWh, respectively. Concentrated Solar Power (CSP) is also indicated to achieve cost competitiveness for projects commissioned between 2020 and 2022 [34,35,36]. Fossil fuel may currently look with a cost advantage over RE but if externalities are added RE would be more affordable. Externalities associated with RE is much lower, less than 1 ȼ/kWh compare to the coal ranging between 2 to 15 ȼ/kWh. Figure 4 presents the range of external costs associated with different electricity sources. LCOE is an economic assessment of the total cost to build and operate a power generating over its lifetime energy output. It aims to provide comparisons of different technologies with different project size, lifetime, capital cost, and capacities [37,38]. In the case of RE, the assumed capacity factor of a facility has a significant impact on the LCOE. It is generally dependant on the quality of the renewable resource as based on resource for Australian conditions is summarized in Table 2 [39].
4.1. Solar
The multiple advantages of solar radiation such as light, heat, and electricity placed solar energy as an indispensable option around the globe. PV is one of the fastest growing technology used in a wide range from a small consumer to large power stations globally. The installed capacity of PV had grown at the rate of 40% over the last decade, with cost reductions of 22% for each doubling of cumulative capacity [40,41,42]. Beside PV, CSP technologies are gaining interest due to advantages of higher efficiency, lower operating costs, and good scale-up potential. The incorporation of thermal energy storage and backup systems increased CSP potential in competitiveness towards conventional energy systems. Cost reductions for CSP technologies is expected due to market growth, project experience, and use of advanced materials and components in upcoming years [43,44].
4.2. Wind power
Wind energy has been used for thousands of years and from about 120 years started to generate electricity. Continuous technological improvements caused a significant cost reduction of wind technology and it is already competing with fossil fuel power generation [45,46,47]. Low-cost power generation placed wind as a significant source of energy for the present and future planning [48]. Cost reduction predicted for different renewable energy technologies is presented in Figure 5.
5.
Proposed demand and supply balance model
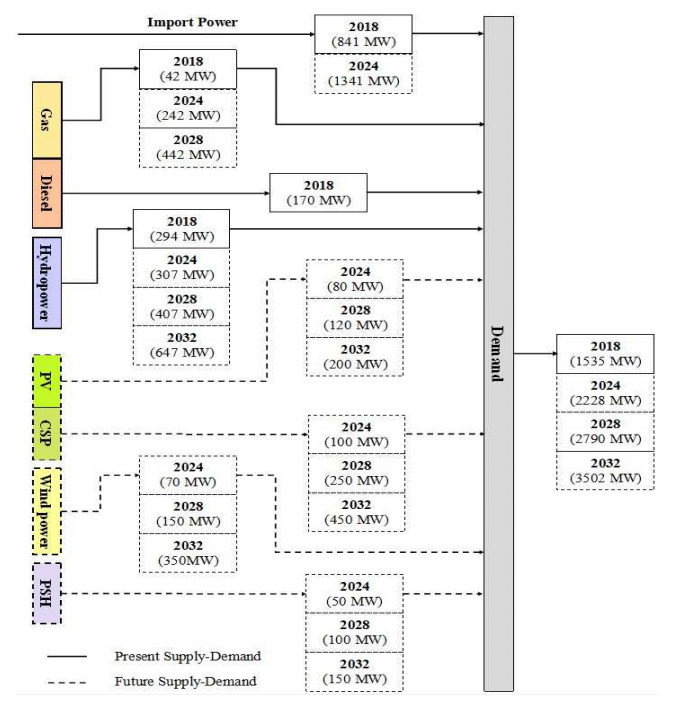
Expansion planning is essential for ensuring the security of supply and efficient functioning of the electricity market. This study proposes long term demand and supply balance model with a vast influence of renewable energy sources as presented in Figure 6. Through considered model, the capacity of additional thermal base import power is limited, and the domestic coal-fired power plants options are replaced with alternative RE sources. Solar, wind and hydro are the primary RE sources considered to meet the future demand. Besides PV, CSP is evaluated as the most suitable solar technology in Afghanistan climatic condition. Through CSP, solar radiation concentrates on a receiver by using mirrors instead of burning fossil fuel to produce steam and generate electricity. CSP technologies with higher efficiency, lower operating costs, and good scale-up potential have the advantage of low-cost thermal energy storage, allow providing dispatchable renewable power. The Life Cycle Cost (LCC) of each component is the sum of capital cost, operating and maintenance cost and replacement cost minus salvage cost as formulated in Eq 5.1 [50].
where $ C $ is capital cost, $ OM $ is the operation and maintenance cost, $ R $ is the replacement cost, and S is the salvage value, all in $. The subscript of $ npv $ denotes the net present value of each factor.
Alongside numerous advantages, RE integration may create some challenges as might cannot match the demand appropriately since in some days, the wind may not blow, or sun may not shine. Seasonal variation also will increase intermittency as solar irradiation is most influential in the summer while in some places wind is most effective in the winter. To overcome the challenges and to improve power system stability, a grid-scale energy storage system is considered as well. There are many ways, which can store energy through that Pump Storage Hydro (PSH) and Thermal Energy Storage (TES) are preferred as the most appropriate technologies in Afghanistan. Through PSH, the electricity will be stored during times when generation, especially from RE sources, exceeds consumption and return to the grid when production falls below consumption. Conversion from electric energy to the net output power by PSH and from thermal energy to the net electricity by CSP is described in Eqs 5.2 and 5.3 respectively.
where in Eq 5.2, $ \eta PSH $ is efficiency of PSH, $ W_{ur} $ is water in upper reservoir, $ m $ is mass, $ g $ is gravity, $ h_{ur} $ is height of upper reservoir, and $ P_{PSH}^{max} $ is maximum output power of PSH. In Eq 5.3, $ E_{CSP}^{net} $ is net output energy stored by $ CSP $ in $ MWh $, $ MSS $ is molten storage slat, $ cof_c $ is heat co-efficient, $ HMT $ is temperature of hot molten salt $ CMT $ is temperature of cold molten salt, $ STR_{los} $ is storage loss, and $ \eta CSP $ is efficiency of the CSP.
Afghanistan is a key country between energy surplus areas (Central Asian Republics and Iran) and energy deficit regions (Pakistan and India). The country is in a position that can facilitate and launch regional electricity trade for the benefit of the region and derive significant gains for its economy from energy imports and exports. At present, there are ongoing regional efforts by multilateral institutions to establish regional energy trading agreements between Central Asian and South Asian countries. Afghanistan, with its geographical location, can be a bridge in between and gain significance revenues for its economy from energy imports and exports and supply its energy need due to some planned and/or unplanned power outages [51].
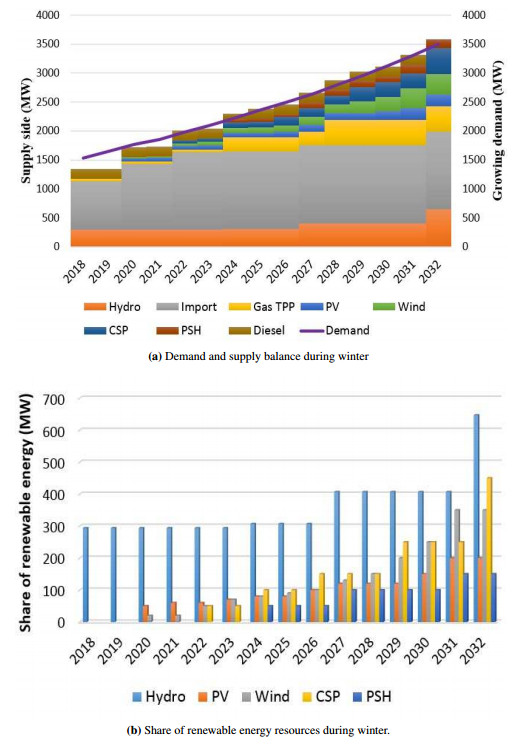
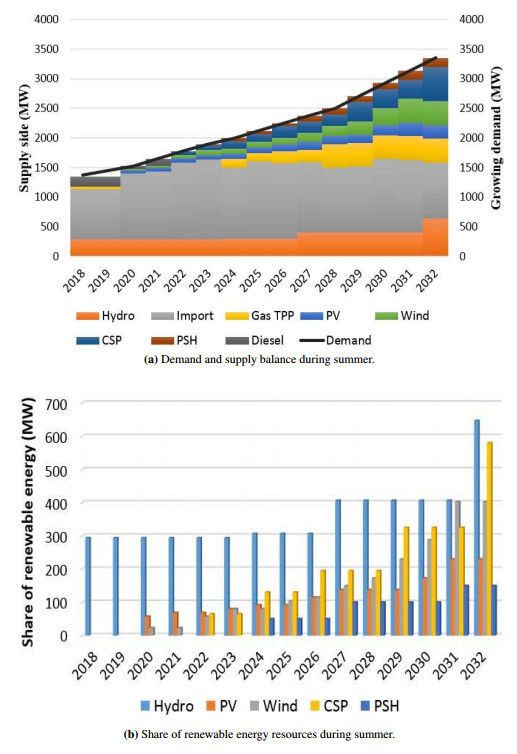
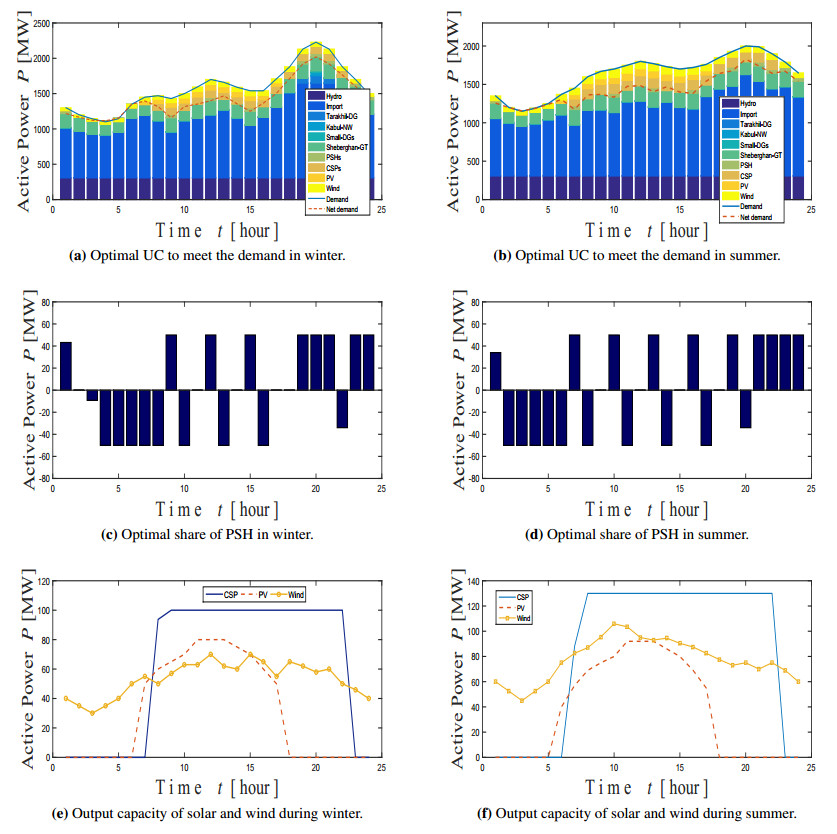
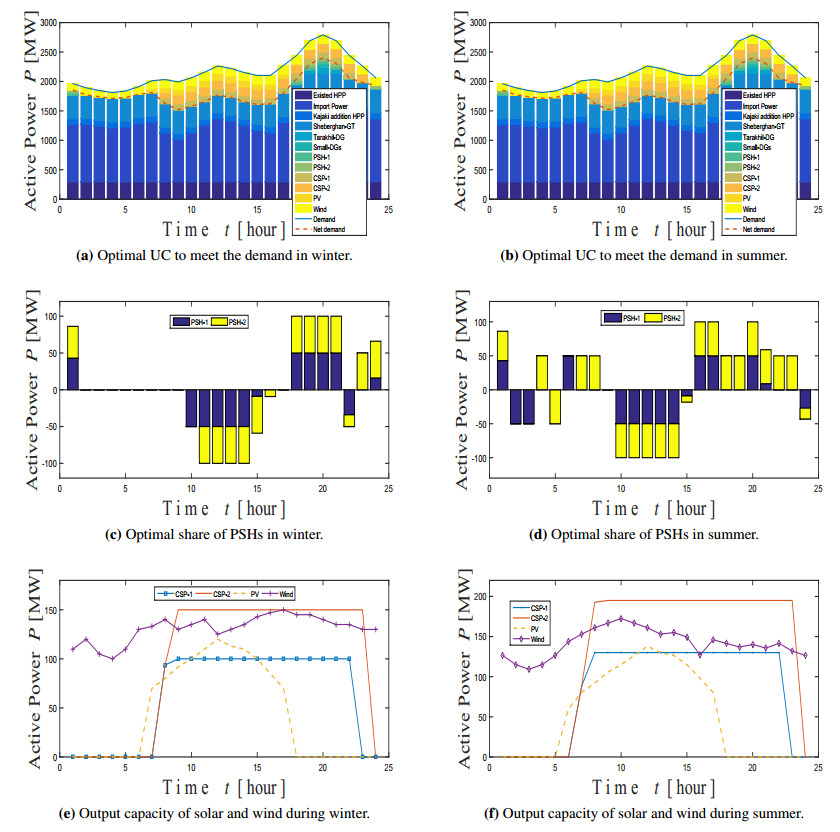
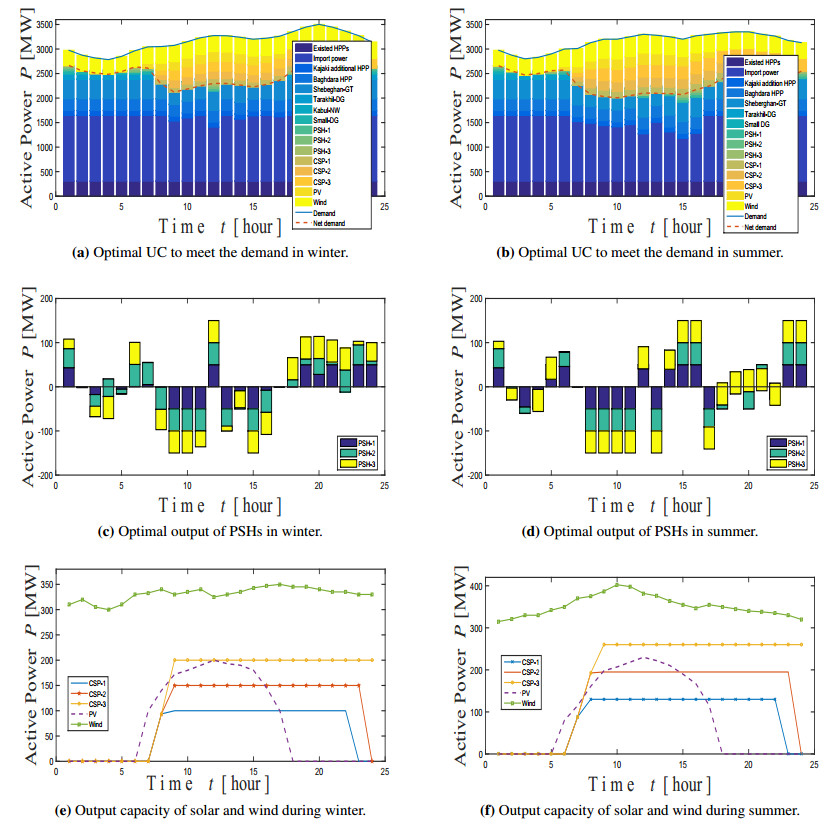
To evaluate seasonal demand with supply from variable RE resources, evaluation performed for both winter and summer as graphically presented in Figures 7 and 8 respectively.
6.
Optimal unit commitment
Future systems with a larger share of renewable generation require flexible production mix. Operational flexibility is equally important for long-term capacity expansion planning [52,53]. Unit commitment is an optimization problem used to determine the operation schedule of the generating units with varying demand under different constraints and environmental conditions [54,55,56]. UC performed in this study considers the main technical and operational characteristics like start-up costs, ramp limits and system coupling constraints like energy balance and reserve requirements. To assign the incorporation of short-term decisions into the long-term planning framework a set of historical days for representing the whole year are selected. Using this approach for a limited number of time slices can lead to averaging of intermittent RE generation by strongly underestimating their variability.
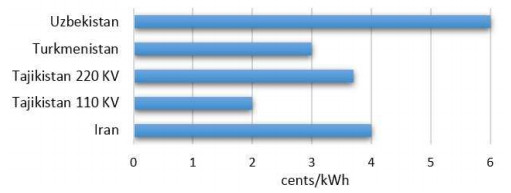
Existing electrical system in Afghanistan is consisted of import power and domestic hydro and thermal resources. Import power from neighboring countries are obtained at the maximum agreed amounts all year-round except for Tajikistan which only exports surplus power. The total import power capacity reaches to 841 MW that expected to increase to 1,341 MW by 2024. Cost for import power varies upon the Power Purchase Agreement (PPA) with a power exporter country as depicted in Figure 9. Domestic thermal units fired by imported diesel fuel, are mostly reciprocating engines except for Kabul-NW power plant which consists, two diesel-fired gas turbines [28]. Power generating capacity and fuel coefficient of existing and planned thermal units are presented in Table 3 [57,58].
6.1. Objective function
The objective function for considered UC is indicated in Eq 6.1.
where $ NT $ is total scheduling period in hours and $ NTG $ is the total number of power generating units. $ F $ is fuel cost function of unit $ i $ at hour $ t $ in $, $ PGi $ is output power of unit $ i $ at hour $ t $ in MW and $ SUC $ is start-up cost of unit $ i $ at hour $ t $ in $.
Equation (6.2) illustrates the quadratic fuel cost function where, $ a $, $ b $ and $ c $ are the fuel coefficients. Fuel costs quadratic equation is implemented after modifying piecewise linear blocks as the quadratic equation is non-linear. Reference [59] describes the conversion of fuel cost quadratic equation to the piecewise linear equation.
6.2. Program constraints
UC aims to identify the best possible scheme such that the overall generation cost has reduced. The problem involves deciding the hourly operation while satisfying a set of constraints. The main constraints for UC calculation considered in this study are as the following:
6.2.1. Power balance constraint
The total capacity of supply should satisfy the demand for each hour. Supply-side consist of thermal generators (TGs), HPP, Import Power (IP), PVs, CSPs and PSHs. The demand and supply balance for this study is expressed by Eq 6.3.
where $ n $ is the number of power generating units, $ P_{TGi}(t) $, $ P_{IPi}(t) $, $ P_{HPi}(t) $, $ P_{CSPi}(t) $, $ P_{PVi}(t) $, $ P_{Wi}(t) $, and $ P_{PSHi}(t) $ are the output power by thermal, import, hydro, CSP, PV, wind and PSH of unit $ i $ at hour $ t $ respectively. $ P_{Ld}(t) $ is total demand at hour $ t $.
6.2.2. Maximum/minimum power generating constraint
The power output of each generating units, limited with a specified range of production.
where $ P_{Gi}(t)^{min} $, $ P_{Gi}(t) $ and $ P_{Gi}(t)^{max} $ are the minimum, reasonable and the maximum output capacity of unit $ i $ at hour $ t $ in MW respectively.
6.2.3. Minimum up/down time constraint
The operating duration is determined by considering the minimum up and down time constraints. Once a unit is committed/decommitted, it should be kept stable for a minimum period before a transition.
where, $ T_{i}^{on} $, $ X_{i}^{on} $, $ T_{i}^{off} $ and $ X_{i}^{off} $ are the minimum uptime of unit $ i $, duration of unit $ i $ being continuously on, minimum downtime of unit $ i $ and duration of unit $ i $ being continuously off, respectively.
6.2.4. Ramp-rate constraint
The minimum ramp rate of power generating units has to be higher or equal to determined ramp rate as indicated in Eq 6.7.
where, $ R_{ri}(t) $ is the ramp rate of unit $ i $ at hour $ t $ and $ R_{ri}(t)^{min} $ is the minimum ramp rate of unit $ i $ at hour $ t $.
6.2.5. Output power constraints of PVs and CSPs
where, $ P_{CSP}(t) $ and $ P_{CSP}^{max} $ are output power and maximum output power of CSPs in MW. $ NC $ and $ CF^A $ are the nameplate capacity and annual capacity factor of CSPs respectively. $ P_{PV}(t) $ and $ P_{PV}(t)^{max} $ are output power and maximum output power of PV at hour $ t $ in MW respectively.
6.2.6. Output power constraints of wind plnts
where, $ P_{W}(t) $ and $ P_{W}(t)^{max} $ are output power and maximum output power of wind plants at hour $ t $ in MW respectively.
6.3. Simulation result
The simulation result obtained by using MATLAB (INTLINPROG) optimization toolbox presents the total daily energy mix with a scheduling time horizon of 24 hours. The primary difference regarding the structure of the chosen days is demand and supply level, which is affected by seasonal characteristics. Figures 10–12 highlight the operational scheduling, each box corresponds to a specific power unit of a particular technology type and hourly period.
7.
Discussion and analysis
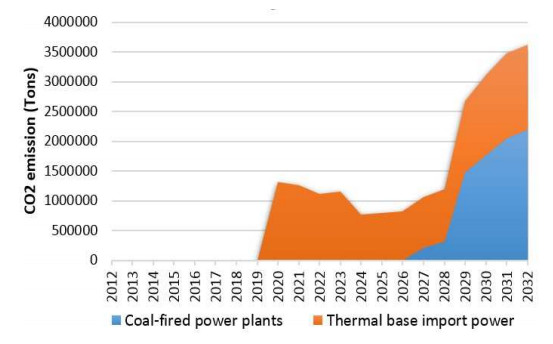
Many factors contribute to achieving sustainable development goals and one of the essential requirement is a sustainable energy supply. The positive consequences of an increasing share of RE on the mitigation of CO$ _2 $ emissions as well as on reduced energy import dependency are undeniable facts [60]. Afghanistan is struggling with plenty of problems such as fast population increase, unstable economic growth and an increase in poverty. Clean energy access as a key element can reduce the environmental effects of conventional generators, diversify energy supply, improve household incomes, create job opportunities as well as increase health and educational achievements [61]. Direct and indirect benefits through energy services can significantly reduce the high poverty level (54%) and the unemployment rate (30%) in Afghanistan [62,63,64]. The proposed model can bring more benefits, especially if the construction materials for energy infrastructures locally get process. It also will limit the capacity of additional thermal base import power and coal-fired power plants options. The CO$ _2 $ emission amount prevented by the alternative RE sources, considered in expansion planning model is presented in Figure 13.
UC analysis into the demand and supply planning model made essential changes to the optimal generation mix and increased the operational flexibility of the system. The UC model estimated more operational details during capacity variation such as the quantity of import power, existing flexible units, RE sources and the sufficient inclusion of new technologies such as the energy storage systems. A temporal representation based on using a set of typical days is better suited to assess the potential of different options. The method reduced per MWh production cost as determined in Eq 7.1 and mitigated CO$ _2 $ emission as for a typical 24 hours operation is presented in Table 4.
where, $ TOC $ is the total operation cost, $ Mi $ and $ NA $ are the per MWh cost and the number of all generating units.
8.
Conclusion
This study provides an extensive analysis of long-term energy expansion planning towards self-sufficiency and sustainable energy supply in Afghanistan. The penetration of RE sources in the generation expansion planning is a significant factor towards tackling critical challenges, specifically the climate change and energy security. The study extensively analyzed the operational dimension of the electric power system that affected the results of system planning models. A detailed modelling analysis quantified the impact of both the temporal and techno-economic representation typically used for increasing penetration of RE sources. It allowed improving planning models by extending the operational time dimension. The UC approached in this study enhanced the ability to obtain decisions with intertemporal (hourly) constraints, which is embedded within the long-term planning. The proposed approach covered the forecasted electricity demand in a cost-effective way while satisfied a series of technical, economic and other logical constraints. By application of the proposed model, domestic energy production can cover 68.8% of forecasted demand, which 51.3% will provide from renewable energy sources. Connection rate is expected to increase to 65% in the rural area and the high level of near 100% for the urban regions. The CO$ _2 $ emission prevented by limiting thermal base import power and domestic coal-fired power plants options stand at 22,392,396 ton. And the total number of jobs along with the RE projects expected to reach 12,544.
Acknowledgments
For this paper, the authors acknowledge the support of the University of the Ryukyus through JICA (PEACE project).
Conflict of interest
All authors declare no conflicts of interest in this paper.


 DownLoad: