Review Special Issues

Drugs and drug delivery systems targeting amyloid-β in Alzheimer's disease

  • Alzheimer's disease (AD) is a devastating neurodegenerative disorder with no cure and limited treatment solutions that are unable to target any of the suspected causes. Increasing evidence suggests that one of the causes of neurodegeneration is the overproduction of amyloid beta (Aβ) and the inability of Aβ peptides to be cleared from the brain, resulting in self-aggregation to form toxic oligomers, fibrils and plaques. One of the potential treatment options is to target Aβ and prevent self-aggregation to allow for a natural clearing of the brain. In this paper, we review the drugs and drug delivery systems that target Aβ in relation to Alzheimer's disease. Many attempts have been made to use anti-Aβ targeting molecules capable of targeting Aβ (with much success in vitro and in vivo animal models), but the major obstacle to this technique is the challenge posed by the blood brain barrier (BBB). This highly selective barrier protects the brain from toxic molecules and pathogens and prevents the delivery of most drugs. Therefore novel Aβ aggregation inhibitor drugs will require well thought-out drug delivery systems to deliver sufficient concentrations to the brain.

    Citation: Morgan Robinson, Brenda Yasie Lee, Zoya Leonenko. Drugs and drug delivery systems targeting amyloid-β in Alzheimer's disease[J]. AIMS Molecular Science, 2015, 2(3): 332-358. doi: 10.3934/molsci.2015.3.332

    Related Papers:

    [1] A. M. Elaiw, Raghad S. Alsulami, A. D. Hobiny . Global dynamics of IAV/SARS-CoV-2 coinfection model with eclipse phase and antibody immunity. Mathematical Biosciences and Engineering, 2023, 20(2): 3873-3917. doi: 10.3934/mbe.2023182
    [2] Abdessamad Tridane, Yang Kuang . Modeling the interaction of cytotoxic T lymphocytes and influenza virus infected epithelial cells. Mathematical Biosciences and Engineering, 2010, 7(1): 171-185. doi: 10.3934/mbe.2010.7.171
    [3] Ting Guo, Zhipeng Qiu . The effects of CTL immune response on HIV infection model with potent therapy, latently infected cells and cell-to-cell viral transmission. Mathematical Biosciences and Engineering, 2019, 16(6): 6822-6841. doi: 10.3934/mbe.2019341
    [4] Tahir Khan, Roman Ullah, Gul Zaman, Jehad Alzabut . A mathematical model for the dynamics of SARS-CoV-2 virus using the Caputo-Fabrizio operator. Mathematical Biosciences and Engineering, 2021, 18(5): 6095-6116. doi: 10.3934/mbe.2021305
    [5] Maysaa Al Qurashi, Saima Rashid, Fahd Jarad . A computational study of a stochastic fractal-fractional hepatitis B virus infection incorporating delayed immune reactions via the exponential decay. Mathematical Biosciences and Engineering, 2022, 19(12): 12950-12980. doi: 10.3934/mbe.2022605
    [6] Jiazhe Lin, Rui Xu, Xiaohong Tian . Threshold dynamics of an HIV-1 model with both viral and cellular infections, cell-mediated and humoral immune responses. Mathematical Biosciences and Engineering, 2019, 16(1): 292-319. doi: 10.3934/mbe.2019015
    [7] Cameron Browne . Immune response in virus model structured by cell infection-age. Mathematical Biosciences and Engineering, 2016, 13(5): 887-909. doi: 10.3934/mbe.2016022
    [8] Cuicui Jiang, Kaifa Wang, Lijuan Song . Global dynamics of a delay virus model with recruitment and saturation effects of immune responses. Mathematical Biosciences and Engineering, 2017, 14(5&6): 1233-1246. doi: 10.3934/mbe.2017063
    [9] Maysaa Al Qurashi, Saima Rashid, Ahmed M. Alshehri, Fahd Jarad, Farhat Safdar . New numerical dynamics of the fractional monkeypox virus model transmission pertaining to nonsingular kernels. Mathematical Biosciences and Engineering, 2023, 20(1): 402-436. doi: 10.3934/mbe.2023019
    [10] Xuejuan Lu, Lulu Hui, Shengqiang Liu, Jia Li . A mathematical model of HTLV-I infection with two time delays. Mathematical Biosciences and Engineering, 2015, 12(3): 431-449. doi: 10.3934/mbe.2015.12.431
  • Alzheimer's disease (AD) is a devastating neurodegenerative disorder with no cure and limited treatment solutions that are unable to target any of the suspected causes. Increasing evidence suggests that one of the causes of neurodegeneration is the overproduction of amyloid beta (Aβ) and the inability of Aβ peptides to be cleared from the brain, resulting in self-aggregation to form toxic oligomers, fibrils and plaques. One of the potential treatment options is to target Aβ and prevent self-aggregation to allow for a natural clearing of the brain. In this paper, we review the drugs and drug delivery systems that target Aβ in relation to Alzheimer's disease. Many attempts have been made to use anti-Aβ targeting molecules capable of targeting Aβ (with much success in vitro and in vivo animal models), but the major obstacle to this technique is the challenge posed by the blood brain barrier (BBB). This highly selective barrier protects the brain from toxic molecules and pathogens and prevents the delivery of most drugs. Therefore novel Aβ aggregation inhibitor drugs will require well thought-out drug delivery systems to deliver sufficient concentrations to the brain.


    The etiology of aortic valve (AV) stenosis can be classified as congenital, rheumatic and calcific, in which calcification is the main and most common cause [1,2]. In Western countries, calcified aortic valve stenosis (CAVS) has become the third leading cardiovascular disease after coronary heart disease and elderly hypertension [3]. Calcification increases with age and affects mainly the older, occurring in 2–7% of people over age of 65 [4]. Once clinical symptoms appear, non-surgical treatment has a poor prognosis with a 2-year survival rate of only 50%. Currently, the most common treatment is valve replacement with a mechanical or biological valve [5,6]. Furthermore, calcification is also a major cause of the failure of bioprostheses [7]. Long-term follow-up studies have found that the incidence of structural valve degeneration 15 years after implantation is 30% to 60%, which is partly caused by calcification [8].

    Calcification has been previously thought to be a passive process of calcium deposition on valve over time [9]. However, recent studies have shown that it is the result of active regulation by multiple factors such as inflammation and metabolism. Beginning with subclinical inflammation, it progresses through stages of fibrosis and leaflet thickening, culminating in valve calcification [10]. Calcification alters the geometry and material properties of the AV, resulting in reduced flexibility and opening area that block the flow of blood from the left ventricle (LV) to the aorta. To supply the body with required volume of oxygenated blood, the heart self-regulates pump function by increasing its contractility to maintain the cardiac output.

    Healthy AV has mechanical properties of anisotropy, nonlinearity, incompressibility and hyperelasticity. Since calcification is a dynamic growth process and is not evenly distributed on the leaflets, which will change the material properties of the valve. AV calcification has been mathematically modeled in various ways, such as by changing the parameters of its constitutive equation, or increasing the thickness of the leaflets, or increasing the stiffness of calcified region. For example, Mutlu et al. [11] used linear elastic material model to simulate calcification levels with different elastic moduli to study complex regional flow in healthy and calcified AVs. Using the same calcification assumptions, Kivi et al. [12] studied the hemodynamic effects of calcification on the aortic root and coronary arteries to identify potential onset sites of coronary stenosis in a two-dimensional healthy AV model. Luraghi et al. [13] reconstructed a 3D model of the aortic root and calcium deposits from CT images of patients, numerical simulations were performed on 7 patients using the Lagrangian-Eulerian method. Halevi et al. [14,15] proposed a new method of reverse calcification process, which could reconstruct different stages of calcification to study its effects on valve hemodynamics. Maleki et al. [16] introduced an indicator (a parameter of the constitutive equation) whose value was varied to scale the overall elastic response of the valve tissue according to the severity of Calcification. Assuming the calcification process occurring in the high-strain region, Arzani et al. [17] developed a finite element model of the calcification process where calcification was modelled by increasing the stiffness of the affected region. To simulate the reduced mobility of leaflets due to calcification, Meschini et al. [18] immobilized parts of the area close to the mitral valve(MV) root, and the calcification severity was determined by the area of the calcification. Subsequently, different degrees of stenosis of AV were investigated using a fluid-structure-electrophysiology approach and calcification was modelled in a similar way as in [19].

    Finite Element (FE) method [20,21], Arbitrary Lagrangian-Eulerian (ALE) method [22,23], fictitious domain (FD) method [24] and immersed boundary (IB) method [25,26,27,28] are widely used to deal with fluid-structure interaction (FSI) problems [29]. Because the IB method does not need to generate dynamic body-fitted meshes that greatly simplifies mesh generation, and thus is often used for numerical simulation of large deformation elastic solids. Griffith and Luo [30] proposed the hybrid finite difference/finite element immersed boundary (IB/FE) method based on the IB method, which uses finite element discretization for immersed structures and finite difference discretization for incompressible Navier-Stokes equations. It can overcome one long-standing issue that the Euler grid is twice as fine when the Lagrangian grid is required under the conventional IB method to prevent leakage of the fluid-structure interaction interface. Gao et al. [28] used this IB/FE framework to study a personalized human mitral valve dynamics under physiological pressure loads and then extended it to a coupled MV-LV model [31]. Hasan et al. [32] developed aortic root and ascending aorta models from computed tomography angiography, and the results were consistent with clinical data. Recently, Cai et al. [33,34] investigated the effect of different constitutive equations on the dynamics of AV and MV using the same IB/FE modelling framework. Other applications of the IB/FE approach can be found in [35,36,37].

    In this paper, based on the assumption that calcification develops from the medial to the free end of the aortic valve [38], regional-varied constitutive equations are adopted to study calcified and healthy valves. The IB/FE method is used to simulate AV dynamics with fluid-structure interaction. Finally, the AV dynamics and selected hemodynamic parameters are analyzed at different calcification severity.

    In this study, the geometric model of healthy AV is adapted from our previous study [34], which was constructed from a porcine pericardial valve with a leaflet thickness of 0.04 cm [39], shown in Figure 1(a). The AV is mounted in a straight pipe that has a total length of 13 cm with inner radius of 1.3 cm and wall thickness of 0.15 cm.

    Figure 1.  (a) The AV model mounted in a straight tube; (b) Schematic diagrams of different calcification burden described by the ratio between the calcified area and the total leaflet area.

    Thubrikar et al.[38] have reported calcification patterns in surgically resected end-stage calcified valves, showing calcium deposits in the cusps and commissures with a radial spread to the abdominal region. The physiological anatomy reported by Otto et al. [40] also revealed that calcification develops regularly from the cusps to the leaflet free edge. The same patterns have also reported in [41,42]. In this study, we are not aiming to study patient-specific AV dynamics, but to focus on the effect of calcification-induced stenosis on AV dynamics in an idealized AV model. Figure 1(b) shows a schematic representation of different calcification burden studied in this study. In detail, each AV leaflet is divided into a calcified region (the grey color) near the aortic root (cusp) and a healthy non-calcified zone (the red color) towards the free edge. Note, the calcified region connects to the healthy region directly without overlapping. The progression of calcification in each leaflet is characterized by varying the size of the calcified zone. The initial site of calcification is defined at the regions with high flexure that is the attachment of the cusps to the aortic wall [43]. We have designed three CAVS cases according to the ratio of calcification area in relation to the total leaflet area, they are CAVS1: 20%, CAVS2: 30%, and CAVS: 40%, see Figure 1(b). We also include a healthy AV case (HAV) with 0% calcification for comparison.

    The constitutive equations, parameters, and fibre orientations of the AV leaflets are based on the results from [34]. In specific, the constitutive function for the leaflets is

    $ W1=C10(eC01(I13)1)+k12k2[ek2(I41)21],
    $
    (2.1)

    in which $ C_{10} $, $ C_{01} $, $ k_1 $, $ k_2 $ are constitutive parameters, $ I_1 = {\rm{tr}}(\mathbb{F}^T\mathbb{F}) $ with $ \mathbb{F} $ the deformation gradient, $ I_4 = {\bf f}_0\cdot(\mathbb{F}^T\mathbb{F}{\bf f}_0) $ with $ {\bf f}_0 $ the fibre direction in the reference state. Parameter values can be found in Table 1. The calcification deposits is described by an incompressible Neo-Hookean model,

    $ W2=α2(I13),
    $
    (2.2)
    Table 1.  Constitutive parameter values adapted from [34], and $ \alpha $ is obtained from [11].
    $ {C_{10}} $(kPa) $ {C_{01}} $ $ {k_1} $(kPa) $ {k_2} $ $ \alpha $ (MPa)
    1.21 7.99 24.23 57.62 7.69

     | Show Table
    DownLoad: CSV

    where $ \alpha $ is the shear modulus, $ D_1 $ is the bulk modulus, $ J = \det(\mathbb{F}) $. Considering the Poisson's ratio ($ \nu $) of 0.3 and the Young's modulus ($ E $) of 20 MPa for the calcification [11,12], then we have $ \alpha = E/2(1+\nu) $. The first Piola-Kirchhoff stress tensors ($ \mathbb{P} $) for healthy leaflet and the calcification deposit are

    $ PW1=2C10C01eC01(I13)F+2k1(I41)ek2(I41)2Ff0f0p0FT,
    $
    (2.3)
    $ PW2=αFp1FT,
    $
    (2.4)

    in which $ p_0 $ and $ p_1 $ are Lagrange multipliers to enforce incompressibility. Note both the healthy leaflets and calcification are assumed to be incompressible in this study.

    The IB/FE method [28,30] uses finite element discretization for solids and finite difference discretization for fluids. In brief, let $ {{\bf X}} = (X_{1}, X_{2}, X_{3}) \in U \subset R^3 $ denote Lagrangian material coordinates, and let $ {{\bf x}} = (x_{1}, x_{2}, x_{3}) \in \Omega \subset R^3 $ represent Eulerian coordinates. The mutual conversion between them is realized by the integral transformation of the Delta function $ \delta(\cdot) $, and $ \mathit{\boldsymbol{\chi}}({{\bf X}}, t) \in \Omega $ denotes the physical position of the structure point $ {{\bf X}} $ at time $ t $. The governing equations of the IB/FE system are

    $ ρ(ut(x,t)+u(x,t)u(x,t))=p(x,t)+μ2u(x,t)+f(x,t),
    $
    (2.5)
    $ u(x,t)=0,
    $
    (2.6)
    $ f(x,t)=ΩF(X,t)δ(xχ(X,t))dX,
    $
    (2.7)
    $ χt(X,t)=Ωu(x,t)δ(xχ(X,t))dx,
    $
    (2.8)
    $ UF(X,t)V(X)dX=UPe(X,t):XV(X)dX,
    $
    (2.9)

    where $ \rho = 1.0 $ g/ml is blood density, $ \mu = 4 $ cP is blood viscosity. Because the inner radius of the aortic tube is 1.3 cm, the accumulation of red blood cells can be ignored in our model [44], thus in this study, the blood is regarded as a Newtonian fluid, a widely adopted assumption when modelling blood flow in large arteries [45]. The velocity field $ {{\bf u}}({\bf x}, t) $ is in Eulerian form, $ p({\bf x}, t) $ is the Eulerian pressure field, $ {{\bf f}}({\bf x}, t) $ is the Eulerian elastic force density, and $ \mathbb{P}^{\mathrm{e}} $ is the first Piola-Kirchhoff stress tensor that can be derived from selected strain energy functions, see Section 2.1 for details. Further details about the IB/FE framework and its application in soft tissue can be found in [28,30,31] and its validation in [46,47].

    For the healthy case HAV, a physiological LV pressure profile is applied to the inlet with a peak value of 120 mmHg as shown in Figure 2. With increased calcification burden, the AV will impose higher resistance for the transvalvular flow, thus a higher systolic pressure is used for CAVS cases. LV pressure profiles for CAVS cases can also be found in Figure 2 which are based on literature reported data [15]. In general, the higher the calcification burden, the higher the systolic LV pressure.

    Figure 2.  LV pressure profiles for all studied cases derived from literature reported data [15].

    In the outlet, the aortic pressure is maintained at a range of 120/80 mmHg using a three-element Windkessel model due to the Baroreflex mechanism [48]. In brief, the three-element Windkessel model reads

    $ CdPWkdt+PWkRp=QAo,
    $
    (2.10)
    $ PAo=QAoRc+PWk,
    $
    (2.11)

    where $ R_c $ is the characteristic resistance, $ R_p $ represents the peripheral resistance and $ C $ is the arterial compliance. $ P_{WK} $ is the pressure stored in the Windkessel model. Details of the three-element Windkessel model can be found in [26], and parameter values are listed in Table 2.

    Table 2.  Parameter values of the Windkessel model, adapted from [49].
    $ {R_C} $ (mmHg ml$ ^{-1} $s) $ {R_P} $ (mmHg ml$ ^{-1} $s) $ C $ (ml mmHg$ ^{-1} $)
    0.033 0.79 1.75

     | Show Table
    DownLoad: CSV

    The whole model is immersed in a fluid region of $ 8\, {\rm{cm}}\times\, 8\, {\rm{cm}}\times 13\, {\rm{cm}} $ that is discretized into a regular $ 80\times80\times128 $ Cartesian grids. The grid size is the same as in our previous work for simulating the mitral valve dynamics in a straight tube [28], in which a grid convergence study was performed. Thus, in this study, we adopt a similar spatial spacing with $ \Delta x_1 = \Delta x_2 = 0.1 $ cm and $ \Delta x_3 = 0.1016 $ cm as in [28]. Figure 3 shows the meshes of the aortic tube and the aortic valve used in this study. The AV leaflet is meshed with very fine tetrahedral elements because of the very thin leaflet thickness (0.04 cm), the outer tube covering the AV is meshed with a dense mesh while the remaining tube is meshed with coarse hexahedral elements. Note the mesh density of the outer tube is not critical since the outer tube is fixed throughout the simulation, and its mechanical deformation is not computed but to prevent blood leakage across the tube wall. In sum, the solid region is subdivided into 196,028 elements. Prescribed LV pressure profiles (Figure 2) are used for each CAVS at the inlet (the LV side). Meanwhile, the Windkessel model is used to provide the physiologically accurate aortic pressure in the outlet. The whole aortic tube is fixed with zero displacements and the environmental flow outside the aortic tube is free to flow with 0 pressure on all boundaries of the computational domain. Details of the boundary conditions can also be found in [34].

    Figure 3.  Meshes of the aortic tube (left) and the aortic valve (right) colored by its z-coordinate.

    We set the cardiac cycle to be 0.8 s and the time step size 5e-6 s following our previous study [28]. The very small time step is because of the explicit time-stepping scheme. Details of the spatial and temporal discretization can be found in [28,30]. The periodic convergence test has been carried out in [34] using the HAV model, which has shown that this FSI AV model can reach periodic convergence from the second period and the effective opening area, left ventricular energy loss, stress, and others are all consistent with the reference data. Considering the computational time for one cardiac cycle requires several days, thus in this study, only first two cardiac cycles are simulated and the results from the second cycle are analyzed. The IB/FE AV model is implemented using the IBAMR software infrastructure (https://github.com/IBAMR/IBAMR). In this study, the Cartesian computational domain is further discretized with 2 nested grid levels with a refinement ratio of 4 between the two levels for improved computational efficiency. Note the structural mesh is not refined during the simulation.

    To evaluate valvular performance, the following hemodynamic parameters are introduced, including the regurgitant fraction (RF), the mean transvalvular pressure gradient (TPG), the effective orifice area (EOA), the performance index (PI), and the energy loss (EL) of the LV.

    The regurgitant fraction (RF) reflects the volume ratio of the regurgitant blood into LV through AV. It is defined as [50]

    $ RF=(VR+VL)/VF,
    $
    (4.1)

    in which $ V_{F} $ is the forward volume, $ V_{R} $ is the regurgitant volume, and $ V_{L} $ is the leakage volume.

    The mean transvalvular pressure gradient (TPG) measures the potential energy loss. It is the average pressure gradient across the AV in systole,

    $ TPG=1TT(PLVPAO)dt,
    $
    (4.2)

    where $ P_\text{LV} $ and $ P_\text{AO} $ are the pressures at LV and aortic sides, and $ T $ is the systolic duration.

    The effective orifice area (EOA) [50] is related to the degree of obstruction of blood flow,

    $ EOA=Qrms51.6TPG/ρ,
    $
    (4.3)
    $ Qrms=(1TTQ(t)2dt)1/2,
    $
    (4.4)

    in which $ Q(t) $ is the flow rate, and $ Q_{\rm{rms}} $ represents the root mean square volumetric flow rate.

    Performance index (PI) [51] provides the normalized resistance of valve using a size-independent method,

    $ PI=EOAAsew,
    $
    (4.5)

    in which $ A_\text{sew} $ is the valve sewing ring area.

    The energy loss of LV (EL) is calculated as [39]

    $ EL=0.1333t2t1Δp(t)Q(t)dt,
    $
    (4.6)

    in which $ t_2 $-$ t_1 $ denote the duration of one cardiac cycle, and $ \Delta{p} = P_{\mathrm{Ao}}-P_{\mathrm{LV}} $.

    Figure 4 shows the motion of the AV with different calcification degrees in the opening stage ($ t $ = 0.12 s, $ t $ = 0.18 s) and the closing stage ($ t $ = 0.36 s, $ t $ = 0.39 s, $ t $ = 0.47 s), respectively. It can be seen that the displacements in the calcified area are small, which is in line with the severity of calcification.

    Figure 4.  Movements of AV leaflets at different time.

    With the progress of CAVS, the on-off state of AV has changed dramatically. In the initial stage, the AV gradually opens and the HAV reaches a larger opening orifice than CAVS1, CAVS2, and CAVS3. The three calcified valves all reach their maximum opening area when $ t = 0.18s $. While the orifice area decreased dramatically in calcified AV, from 3.55 $ cm^2 $ in a healthy state to 1.41 $ cm^2 $ in moderate stenosis (CAVS3) at $ t $ = 0.18 s. Thus, during the opening phase, local stiffness of the valve due to calcification results slow opening with a small orifice. In the closing period, at $ t $ = 0.36 s and $ t $ = 0.39 s, the opening of the HAV is still relatively large in the early stage of the closure period. However, CAVS1, CAVS2, and CAVS3 have almost been closed, the average and maximum displacements are reduced to half of HAV. When $ t $ = 0.47 s, all AVs are closed. The valve cusp of calcified cases does not move much compared to the other areas due to the calcification, while the free edge of the valve leaflet is still healthy, and thus it can open and close freely in all cases. For this reason, the maximum displacement usually locates at the free edge, but decreases as the degree of calcification increases. From Figure 4, we can expect that calcification can lead to a decrease in cardiac output and result in an insufficient blood supply due to small opening orifice.

    It can be seen from Table 3 that the average and the maximum displacements decrease with the increase of the calcification severity. In sum, calcification can have an adverse effect on the mobility of the valve.

    Table 3.  Spatial average and maximum displacements at different time.
    Average displacement (cm) Maximum displacement (cm)
    Cases 0.18 s 0.36 s 0.39 s 0.47 s 0.18 s 0.36 s 0.39 s 0.47 s
    HAV 0.041 0.031 0.023 0.017 0.994 1.016 1.037 0.246
    CAVS1 0.026 0.014 0.015 0.015 0.952 0.881 0.179 0.224
    CAVS2 0.021 0.013 0.013 0.014 0.788 0.359 0.182 0.233
    CAVS3 0.018 0.012 0.011 0.013 0.685 0.239 0.132 0.222

     | Show Table
    DownLoad: CSV

    We further divide the cardiac cycle into the opening, fully-opened and closing phases. The opening phase represents the duration of the AV from the beginning of opening to the fully opened state. Fully-opened phases is the duration for which the maximum orifice area is maintained. The closing phase represents the duration from pre-closed to fully-closed states. The opening time for the four cases is similar that is around 0.1 s. While calcification can affect the duration of AV in the full-opened phase as summarized in Table 4. During the fully-opened phase, the duration is reduced from 0.15 s in the healthy case to 0.1 s in the calcified AVs. Therefore, the calcified valve not only has a small opening orifice but also has a short duration of the fully-opened phase. In the closing phase, the duration of the calcified valve is slightly longer than that of HAV, this increasing trend is consistent with [12].

    Table 4.  The duration of AV opening, fully-opened and closing phases.
    Cases Fully-opened (s) Closing (s)
    HAV 0.15 0.15
    CAVS1 0.10 0.155
    CAVS2 0.11 0.16
    CAVS3 0.10 0.16

     | Show Table
    DownLoad: CSV

    Figure 5 shows the velocity field across the AV at the opening phase ($ t $ = 0.12 s, $ t $ = 0.2 s) and the closing phase ($ t $ = 0.3 s, $ t $ = 0.35 s, $ t $ = 0.41 s). In the opening phase, the pressure of the left ventricle is higher than that on the aortic side, and the blood flows into the aortic side. Due to the different calcification areas of the four models, the blood flow is also different. When $ t $ = 0.2 s, the AV is fully opened. Because of the obstruction of valve opening in calcified AVs, different forward jets are formed, and the maximum flow velocity gradually increases with increased calcification area. In particular, the maximum flow velocity of CAVS3 exceeds 3 m/s. In the closing phase ($ t $ = 0.3 s), the blood enters into the aorta with a more homogeneous velocity field compared to the calcified cases, in which the jets are still maintained. At $ t $ = 0.41 s, the HAV shows clear regurgitant flow, and the volume is 5.05 mL, while the calcified valves are completely closed at this time and no clear regurgitation flow can be seen.

    Figure 5.  The fluid velocity fields in different cases.

    Figure 6 shows the velocity profiles at the location $ P_A $ as defined in Figure 1. As the calcified area increases, the peak velocity also increases from 2.27 m/s for HAV to 3.98 m/s for CAVS3. During the closure period of the AV, the HAV shows larger velocity oscillations, while the amplitude decreases as the calcification area increases. Those oscillations correspond to the closure regurgitant flow.

    Figure 6.  The velocity profiles at the location $ P_A $ defined in Figure 1.

    Figure 7(a) shows the flow rates through the AVs over a cardiac cycle without maintaining the aortic pressure at 120/80 mmHg. It can be found that the peak flow rate gradually decreases from 571.34 to 302.82 mL/s with the increased calcified severity. The forward flow volume is reduced from 97.21 mL for HAV to 69.66 mL for CAVS1, 61.23 mL for CAVS2, and 53.24 mL for CAVS3. During the closing phase, the maximum regurgitant flow rate of HAV is 170.57 mL/s, much higher than those of calcified AV (around 50 mL/s). Figure 7(b) shows the flow rates through the AV when maintaining the aortic pressure at 120/80 mmHg. It can be found that the flow of calcified AV is much closer to the flow rate of HAV compared to Figure 7(a).

    Figure 7.  Flow rates across the AV in one cardiac cycle without (a) and with (b) cardiomodulation.

    The fibre strain distributions of the AV in the fully-opened, pre-closed (the AV leaflets start to close), and fully-closed states are shown in Figure 8. It can be observed that the strain distribution of the calcification model is significantly different from that of HAV. In particular, CAVS2 and CAVS3 experience a large squeezed region in the centre region of the valve, which is not present in HAV at $ t $ = 0.24 s when the AV is fully opened. Meanwhile, it can be found that the strain forms a distinct boundary between calcified and healthy regions. Low strains are seen in the calcified regions, while high strains are usually concentrated at this boundary. Arazani et al. [17] have suggested that a compliance mismatch occurring in this region may lead to a local increase in strain, which leads to further calcium deposition and propagation of calcification. The reduction in strain in the calcified region throughout the cardiac cycle could be explained by calcium depositions that increase leaflet stiffness. At $ t $ = 0.48 s, the leaflet strain reaches the largest. The peak strains in Figure 8 are consistent with the range reported in [14] with the maximum magnitude greater than 0.1.

    Figure 8.  Fibre strain (unitless) distributions of AV in fully open (0.24 s), pre-closed (0.33 s) and fully closed (0.48 s) phases.

    Figure 9 presents the fibre stress of the valve at 0.24 s and 0.48 s. As calcification develops, locations of high mechanical stress appear and concentrate in commissures at the fully-opened state. When severe calcification is present, it gradually extends to the base of the valve. The magnitude of the stress in the belly region in the closing phase is much larger than the corresponding magnitude in the opening phase. The high stress regions mostly concentrate in the non-calcified regions, while all cases are experiencing very high fibre stresses at the closing phase. The distribution and magnitude of stress of all cases are in general agreement with [52,53] within a range of < 500 kPa. Thus, calcified valves experience a local increase in stress and strain, which in turn promotes the further progression of calcification.

    Figure 9.  Fibre stress distributions of AV in fully-opened (0.24 s) and fully-opened (0.48 s) phases.

    To analyze the effect of calcification on AV hemodynamic parameters, the results of $ V_F $, $ V_R $, $ V_L $, RF, PI, EL, the maximum velocity, EOA and TPG are summarized in Tables 5 and 6. In general, $ V_F $, $ V_R $, $ V_L $, and RF values in CAVS are lower than those of HAV, while TPG and EL increase significantly with increased calcification areas. EOA and PI are the most intuitive indices of the severity of calcification-induced stenosis and are negatively correlated with calcification severity. Since the degree of stenosis can be reflected by the maximum flow velocity, TPG, and EOA, we further include literature reported values [15,19,54,55,56,57,58] in Table 6, based on which we could classify each CAVS case with a medical grade of AV stenosis. It can be found that the results from our models agree well with the clinical classification except that the maximum velocity is slightly higher than in vivo reference data.

    Table 5.  The summary of hemodynamic parameters $ V_F $, $ V_R $, $ V_L $, RF, PI, and EL.
    Cases $ V_F $ (mL) $ V_R $ (mL) $ V_L $ (mL) RF (%) PI EL (mJ)
    HAV 97.21 5.05 1.03 6.25 0.67 109.44
    CAVS1 80.58 1.25 0.27 1.88 0.43 135.82
    CAVS2 88.39 0.88 0.12 1.13 0.33 281.86
    CAVS3 85.29 0.78 0.06 0.98 0.27 361.91

     | Show Table
    DownLoad: CSV
    Table 6.  Model predicted results compared to literature reported clinical data [15,19,54,55,56,57,58] on the classification of AV stenosis including the maximum velocity, EOA and TPG.
    Maximum velocity (m/s) EOA ($ cm^2 $) TPG (mmHg)
    in-vivo model in-vivo model in-vivo model
    healthy $ < $ 2 2.27 $ 3.9\pm1.2 $ 3.55 $ < $ 5 4.34
    sclerosis $ < $ 2 2.77 $ 3.9\pm1.2 $ 2.26 7.80
    Mild stenosis 2–2.9 3.65 $ > $ 1.5 1.73 $ < $ 20 16.28
    Moderate stenosis 3–3.9 3.98 1–1.5 1.41 20–39 22.79

     | Show Table
    DownLoad: CSV

    In this paper, by using the IB/FE method, we have studied AV dynamics with increased calcification. The initial location of calcification is at the valve cusp and gradually spreads radially to the free edge. One healthy model and three diseased models are constructed using the ratio of the area occupied by calcification. Among them, the hyperelastic constitutive equation that best describes the valve mechanical behaviour in previous studies [34] is used for healthy valves, and an isotropic Neo-Hookean model is used for calcification. For fluid boundary conditions, different LV pressures are assigned for each CAVS by maintaining the aortic pressure at 120/80 mmHg. A classic Winkessel model is further used to provide the outlet boundary condition at the aortic side. Compared with the vascular tree model [59], although the Windkessel cannot simulate the pulse wave transmission, it is simple and easy to implement to provide an accurate physiological pressure for the outlet. The same practice can also be seen in [15]. To assess the effect of calcification on AV performance, we analyzed AV displacement fields, transvalvular flow fields, strain, stress and hemodynamic performance. Our results show that calcification can a significant effect on the dynamics of AV.

    As can be seen from Table 5, with the increase of calcification area, $ V_F $, $ V_R $, $ V_L $, and RF all show a decreasing trend. $ V_F $ of HAV is 97.21 mL that is higher than the values from calcified cases (about 80 mL). Calcified leaflets connected to the aortic wall result a decrease in the volume of blood which returns from the aorta to the LV, while $ V_R $ and $ V_L $ decrease drastically with the increase of calcification area, which is also reflected in Figures 4 and 5.

    TPG is one of the important indicators to assess valve stenosis. In this study, TPG increases with calcification from 4.34 mmHg in HAV to 22.79 mmHg in CAVS3, which is 5-fold higher than HAV. Increased TPG can have an significant impact on valve performance and drive compensatory LV hypertrophy to accommodate increased after-load [60]. A larger EOA corresponds to a smaller pressure drop, resulting in less energy loss. With the development of calcification, the opening area in CAVS3 decrease to less than half of the healthy state, which can also be seen from Figure 4. PI shows how well the valve design utilizes its total installed area and is inversely proportional to the calcified area. As can be seen from the Figure 5, the calcified valve results in a orifice diameter decreased from 2.2 cm for HAV to 1.6 cm for CAVS1, and to 1.45 cm for CAVS2, and to 1.35 cm for CAVS3 as shown in Figure 5. The valve orifice ratios relative to HAV are 75, 61 and 43% of HAV, respectively. As discussed previously, larger TPG usually corresponds to larger EL. The EL of HAV is 109.44 mJ, which is very close to the reference value (129.03 mJ) reported in [50]. However, the EL of CAVS3 with moderate stenosis is 361.91 mJ, which is much larger than HAV.

    For the evaluation of various performance indicators of HAV, readers refer to our previous study [34]. For CAVS1, the maximum velocity is 2.77 m/s, the opening area is 2.26 $ cm^2 $, and the transvalvular pressure difference is 7.80 mmHg, which is in line with the clinical diagnosis of sclerosis as shown in Table 6. EOA and TPG of CAVS2 agree with the range of mild stenosis. For CAVS3, the maximum velocity, TPG, and EOA are consistent with moderate stenosis. Therefore, the selected three calcification models in this study represent typical clinical cases from sclerosis to mild stenosis and to moderate stenosis.

    Although the simulated results agree well the reported clinical data [15,19,54,55,56,57,58], limitations exist in this study. For example, we have not considered the pattern of calcification, but assumed to be uniformly distributed over the leaflets and follow a idealized growth pattern from the cusp to the free edge. The thickness of the valve is not uniform but increases with age due to the deformation of collagen fibres and calcium accumulation. For example, Weinberg et al. [61] studied AV aging from 20 to 80 years by including tissue flexibility degradation, thickening and calcification with aging. It is challenging to calculate wall shear stress in our IB/FE based AV model because the fluid mesh and the solid mesh are not body-fitted but overlapped. Thus future development in reconstructing accurate wall shear stress from IB/FE predicted velocity filed is needed, for example by including a boundary layer since wall shear stress is highly sensitive to the fluid mesh quality [62]. Furthermore, the blood is considered to be Newtonian with laminar flow assumption, future studies shall also investigate how non-Newtonian model affects AV dynamics, especially in stenotic AV when the turbulence is present [63], the damage to blood cells [64], and the impact on calcification progression [17]. Last but not the least, the constitutive model of calcification is simple without considering its complex structures, a microstructure-informed biomechanical model of calcification will be needed for a patient-specific simulation [65].

    In this work, we have studied the effect of calcification on human aortic dynamics. By using the IB/FE method, FSI simulations of AV dynamics are performed for healthy and three calcification cases characterized by increased calcified area in the leaflets. Our results show that calcification can significantly affect AV function and the selected calcified cases are able to describe the progression of calcification. In specific, calcified AVs have smaller opening area and higher forward jet flow. The higher the degree of calcification, the heavier the ventricular loading, resulting in a significant increase in left ventricular energy loss and transvalvular pressure gradient. Moreover, calcified valves could cause an increase in local stress and strain, which in turn promotes the development of calcification. This further suggests that the presence of calcification could lead to a vicious circle and should be treated at the right time. The maximum velocity, EOA and TPG predicted by our models are in general consistent with the clinical stenosis classification. It is expected that the IB/FE FSI simulated AV model has the potential to deepen the understanding of AV stenosis-induced ventricular dysfunction and facilitate the development of computational engineering-assisted medical diagnosis in AV-related diseases.

    This work is supported by National Natural Science Foundation of China (11871399) and the UK EPSRC (EP/S030875, EP/S014284/1, EP/S020950/1, EP/R511705/1, EP/T017899/1), which are gratefully acknowledged.

    On behalf of all authors, the corresponding author states that there is no conflict of interest.

    [1] Prince M, Jackson J (2009) Alzheimer's Disease International World Alzheimer Report 2009. London. 1-96 p.
    [2] Takeda A, Loveman E, Clegg A, et al. (2006) A systematic review of the clinical effectiveness of donepezil, rivastigmine and galantamine on cognition, quality of life and adverse events in Alzheimer's disease. Int J Geriatr Psychiatry 21: 17-28. doi: 10.1002/gps.1402
    [3] Ong KT, Villemagne VL, Bahar-Fuchs A, et al. (2015) Abeta imaging with 18F-florbetaben in prodromal Alzheimer's disease: a prospective outcome study. J Neurol Neurosurg Psychiatry 86: 431-436. doi: 10.1136/jnnp-2014-308094
    [4] Querfurth HW, LaFerla FM (2010) Alzheimer's disease. N Engl J Med 362: 329-344. doi: 10.1056/NEJMra0909142
    [5] Sperling RA, Aisen PS, Beckett LA, et al. (2011) Toward defining the preclinical stages of Alzheimer's disease: recommendations from the National Institute on Aging-Alzheimer's Association workgroups on diagnostic guidelines for Alzheimer's disease. Alzheimers Dement 7: 280-292. doi: 10.1016/j.jalz.2011.03.003
    [6] Petkova AT, Ishii Y, Balbach JJ, et al. (2002) A structural model for Alzheimer's beta -amyloid fibrils based on experimental constraints from solid state NMR. Proc Natl Acad Sci U S A 99: 16742-16747. doi: 10.1073/pnas.262663499
    [7] Matsuzaki K (2014) How do membranes initiate Alzheimer's Disease? Formation of toxic amyloid fibrils by the amyloid beta-protein on ganglioside clusters. Acc Chem Res 47: 2397-2404.
    [8] Cecchi C, Stefani M (2013) The amyloid-cell membrane system. The interplay between the biophysical features of oligomers/fibrils and cell membrane defines amyloid toxicity. Biophys Chem 182: 30-43.
    [9] Drolle E, Gaikwad RM, Leonenko Z (2012) Nanoscale electrostatic domains in cholesterol-laden lipid membranes create a target for amyloid binding. Biophys J 103: L27-29. doi: 10.1016/j.bpj.2012.06.053
    [10] Drolle E, Hane F, Lee B, et al. (2014) Atomic force microscopy to study molecular mechanisms of amyloid fibril formation and toxicity in Alzheimer's disease. Drug Metab Rev 46: 207-223. doi: 10.3109/03602532.2014.882354
    [11] Hane F, Drolle E, Gaikwad R, et al. (2011) Amyloid-beta aggregation on model lipid membranes: an atomic force microscopy study. J Alzheimers Dis 26: 485-494.
    [12] Lal R, Lin H, Quist AP (2007) Amyloid beta ion channel: 3D structure and relevance to amyloid channel paradigm. Biochim Biophys Acta 1768: 1966-1975. doi: 10.1016/j.bbamem.2007.04.021
    [13] Arispe N, Pollard HB, Rojas E (1993) Giant multilevel cation channels formed by Alzheimer disease amyloid beta-protein [A beta P-(1-40)] in bilayer membranes. Proc Natl Acad Sci U S A 90: 10573-10577. doi: 10.1073/pnas.90.22.10573
    [14] Demuro A, Smith M, Parker I (2011) Single-channel Ca(2+) imaging implicates Abeta1-42 amyloid pores in Alzheimer's disease pathology. J Cell Biol 195: 515-524. doi: 10.1083/jcb.201104133
    [15] Plant LD, Boyle JP, Smith IF, et al. (2003) The production of amyloid beta peptide is a critical requirement for the viability of central neurons. J Neurosci 23: 5531-5535.
    [16] Giuffrida ML, Caraci F, Pignataro B, et al. (2009) Beta-amyloid monomers are neuroprotective. J Neurosci 29: 10582-10587. doi: 10.1523/JNEUROSCI.1736-09.2009
    [17] Hardy J, Selkoe DJ (2002) The Amyloid Hypothesis of Alzheimer's Disease: Progress and Problems on the Road to Therapeutics. Science 297: 353-356. doi: 10.1126/science.1072994
    [18] Brambilla D, Verpillot R, Le Droumaguet B, et al. (2012) PEGylated nanoparticles bind to and alter amyloid-beta peptide conformation: toward engineering of functional nanomedicines for Alzheimer's disease. ACS Nano 6: 5897-5908. doi: 10.1021/nn300489k
    [19] Gobbi M, Re F, Canovi M, et al. (2010) Lipid-based nanoparticles with high binding affinity for amyloid-beta1-42 peptide. Biomaterials 31: 6519-6529. doi: 10.1016/j.biomaterials.2010.04.044
    [20] Cheng KK, Yeung CF, Ho SW, et al. (2013) Highly stabilized curcumin nanoparticles tested in an in vitro blood-brain barrier model and in Alzheimer's disease Tg2576 mice. Aaps j 15: 324-336. doi: 10.1208/s12248-012-9444-4
    [21] Cheng X, van Breemen RB (2005) Mass Spectrometry-Based Screening for Inhibitors of β-Amyloid Protein Aggregation. Anal Chem 77: 7012-7015. doi: 10.1021/ac050556a
    [22] He H, Dong W, Huang F (2010) Anti-Amyloidogenic and Anti-Apoptotic Role of Melatonin in Alzheimer Disease. Curr Neuropharmacol 8: 211-217. doi: 10.2174/157015910792246137
    [23] Lin L, Huang Q-X, Yang S-S, et al. (2013) Melatonin in Alzheimer's Disease. Int J Mol Sci 14: 14575-14593. doi: 10.3390/ijms140714575
    [24] Rosales-Corral S, Acuna-Castroviejo D, Tan DX, et al. (2012) Accumulation of Exogenous Amyloid-Beta Peptide in Hippocampal Mitochondria Causes Their Dysfunction: A Protective Role for Melatonin. Oxid Med Cell Longev 2012: 843649.
    [25] Adolfsson O, Pihlgren M, Toni N, et al. (2012) An effector-reduced anti-beta-amyloid (Abeta) antibody with unique abeta binding properties promotes neuroprotection and glial engulfment of Abeta. J Neurosci 32: 9677-9689. doi: 10.1523/JNEUROSCI.4742-11.2012
    [26] DeMattos RB, Bales KR, Cummins DJ, et al. (2001) Peripheral anti-A beta antibody alters CNS and plasma A beta clearance and decreases brain A beta burden in a mouse model of Alzheimer's disease. Proc Natl Acad Sci U S A 98: 8850-8855. doi: 10.1073/pnas.151261398
    [27] Legleiter J, Czilli DL, Gitter B, et al. (2004) Effect of different anti-Abeta antibodies on Abeta fibrillogenesis as assessed by atomic force microscopy. J Mol Biol 335: 997-1006. doi: 10.1016/j.jmb.2003.11.019
    [28] Lemere CA (2013) Immunotherapy for Alzheimer's disease: hoops and hurdles. Mol Neurodegener 8: 36. doi: 10.1186/1750-1326-8-36
    [29] Robert R, Wark KL (2012) Engineered antibody approaches for Alzheimer's disease immunotherapy. Arch Biochem Biophys 526: 132-138. doi: 10.1016/j.abb.2012.02.022
    [30] Wilcock DM, Rojiani A, Rosenthal A, et al. (2004) Passive immunotherapy against Abeta in aged APP-transgenic mice reverses cognitive deficits and depletes parenchymal amyloid deposits in spite of increased vascular amyloid and microhemorrhage. J Neuroinflammation 1: 24. doi: 10.1186/1742-2094-1-24
    [31] Findeis MA, Musso GM, Arico-Muendel CC, et al. (1999) Modified-peptide inhibitors of amyloid beta-peptide polymerization. Biochemistry 38: 6791-6800. doi: 10.1021/bi982824n
    [32] Ghanta J, Shen CL, Kiessling LL, et al. (1996) A strategy for designing inhibitors of beta-amyloid toxicity. J Biol Chem 271: 29525-29528. doi: 10.1074/jbc.271.47.29525
    [33] Hane FT, Lee BY, Petoyan A, et al. (2014) Testing synthetic amyloid-beta aggregation inhibitor using single molecule atomic force spectroscopy. Biosens Bioelectron 54: 492-498. doi: 10.1016/j.bios.2013.10.060
    [34] Pallitto MM, Ghanta J, Heinzelman P, et al. (1999) Recognition sequence design for peptidyl modulators of beta-amyloid aggregation and toxicity. Biochemistry 38: 3570-3578. doi: 10.1021/bi982119e
    [35] Tjernberg LO, Naslund J, Lindqvist F, et al. (1996) Arrest of beta-amyloid fibril formation by a pentapeptide ligand. J Biol Chem 271: 8545-8548. doi: 10.1074/jbc.271.15.8545
    [36] Morgan D, Diamond DM, Gottschall PE, et al. (2000) A beta peptide vaccination prevents memory loss in an animal model of Alzheimer's disease. Nature 408: 982-985. doi: 10.1038/35050116
    [37] Orgogozo JM, Gilman S, Dartigues JF, et al. (2003) Subacute meningoencephalitis in a subset of patients with AD after Abeta42 immunization. Neurology 61: 46-54. doi: 10.1212/01.WNL.0000073623.84147.A8
    [38] Wildsmith KR, Holley M, Savage JC, et al. (2013) Evidence for impaired amyloid beta clearance in Alzheimer's disease. Alzheimers Res Ther 5: 33. doi: 10.1186/alzrt187
    [39] Evin G, Hince C (2013) BACE1 as a therapeutic target in Alzheimer's disease: rationale and current status. Drugs Aging 30: 755-764. doi: 10.1007/s40266-013-0099-3
    [40] Wolfe MS (2012) gamma-Secretase inhibitors and modulators for Alzheimer's disease. J Neurochem 120 Suppl 1: 89-98.
    [41] Atwal JK, Chen Y, Chiu C, et al. (2011) A therapeutic antibody targeting BACE1 inhibits amyloid-beta production in vivo. Sci Transl Med 3: 84ra43.
    [42] Kao SC, Krichevsky AM, Kosik KS, et al. (2004) BACE1 suppression by RNA interference in primary cortical neurons. J Biol Chem 279: 1942-1949. doi: 10.1074/jbc.M309219200
    [43] Singer O, Marr RA, Rockenstein E, et al. (2005) Targeting BACE1 with siRNAs ameliorates Alzheimer disease neuropathology in a transgenic model. Nat Neurosci 8: 1343-1349. doi: 10.1038/nn1531
    [44] Vassar R (2014) BACE1 inhibitor drugs in clinical trials for Alzheimer's disease. Alzheimers Res Ther 6: 89. doi: 10.1186/s13195-014-0089-7
    [45] Luo Y, Bolon B, Kahn S, et al. (2001) Mice deficient in BACE1, the Alzheimer's beta-secretase, have normal phenotype and abolished beta-amyloid generation. Nat Neurosci 4: 231-232. doi: 10.1038/85059
    [46] Jacobsen H, Ozmen L, Caruso A, et al. (2014) Combined treatment with a BACE inhibitor and anti-Abeta antibody gantenerumab enhances amyloid reduction in APPLondon mice. J Neurosci 34: 11621-11630. doi: 10.1523/JNEUROSCI.1405-14.2014
    [47] Morgan D (2005) Mechanisms of A beta plaque clearance following passive A beta immunization. Neurodegener Dis 2: 261-266. doi: 10.1159/000090366
    [48] Banks WA, Terrell B, Farr SA, et al. (2002) Passage of amyloid beta protein antibody across the blood-brain barrier in a mouse model of Alzheimer's disease. Peptides 23: 2223-2226. doi: 10.1016/S0196-9781(02)00261-9
    [49] Banks WA (2012) Drug delivery to the brain in Alzheimer's disease: consideration of the blood-brain barrier. Adv Drug Deliv Rev 64: 629-639. doi: 10.1016/j.addr.2011.12.005
    [50] Pfeifer LA, White LR, Ross GW, et al. (2002) Cerebral amyloid angiopathy and cognitive function: the HAAS autopsy study. Neurology 58: 1629-1634. doi: 10.1212/WNL.58.11.1629
    [51] Racke MM, Boone LI, Hepburn DL, et al. (2005) Exacerbation of cerebral amyloid angiopathy-associated microhemorrhage in amyloid precursor protein transgenic mice by immunotherapy is dependent on antibody recognition of deposited forms of amyloid beta. J Neurosci 25: 629-636. doi: 10.1523/JNEUROSCI.4337-04.2005
    [52] Wilcock DM, Colton CA (2008) Anti-amyloid-beta immunotherapy in Alzheimer's disease: relevance of transgenic mouse studies to clinical trials. J Alzheimers Dis 15: 555-569.
    [53] Doody RS, Thomas RG, Farlow M, et al. (2014) Phase 3 trials of solanezumab for mild-to-moderate Alzheimer's disease. N Engl J Med 370: 311-321. doi: 10.1056/NEJMoa1312889
    [54] Panza F, Solfrizzi V, Imbimbo BP, et al. (2014) Amyloid-based immunotherapy for Alzheimer's disease in the time of prevention trials: the way forward. Expert Rev Clin Immunol 10: 405-419. doi: 10.1586/1744666X.2014.883921
    [55] Salloway S, Sperling R, Fox NC, et al. (2014) Two phase 3 trials of bapineuzumab in mild-to-moderate Alzheimer's disease. N Engl J Med 370: 322-333. doi: 10.1056/NEJMoa1304839
    [56] Tayeb HO, Murray ED, Price BH, et al. (2013) Bapineuzumab and solanezumab for Alzheimer's disease: is the 'amyloid cascade hypothesis' still alive? Expert Opin Biol Ther 13: 1075-1084. doi: 10.1517/14712598.2013.789856
    [57] Garber K (2012) Genentech's Alzheimer's antibody trial to study disease prevention. Nat Biotechnol 30: 731-732. doi: 10.1038/nbt0812-731
    [58] Panza F, Solfrizzi V, Imbimbo BP, et al. (2014) Efficacy and safety studies of gantenerumab in patients with Alzheimer's disease. Expert Rev Neurother 14: 973-986. doi: 10.1586/14737175.2014.945522
    [59] Kumar J, Sim V (2014) D-amino acid-based peptide inhibitors as early or preventative therapy in Alzheimer disease. Prion 8: 119-124. doi: 10.4161/pri.28220
    [60] Porat Y, Mazor Y, Efrat S, et al. (2004) Inhibition of islet amyloid polypeptide fibril formation: a potential role for heteroaromatic interactions. Biochemistry 43: 14454-14462. doi: 10.1021/bi048582a
    [61] Austen BM, Paleologou KE, Ali SA, et al. (2008) Designing peptide inhibitors for oligomerization and toxicity of Alzheimer's beta-amyloid peptide. Biochemistry 47: 1984-1992. doi: 10.1021/bi701415b
    [62] Taylor M, Moore S, Mayes J, et al. (2010) Development of a proteolytically stable retro-inverso peptide inhibitor of beta-amyloid oligomerization as a potential novel treatment for Alzheimer's disease. Biochemistry 49: 3261-3272. doi: 10.1021/bi100144m
    [63] Roy S (2010) Designing Novel Peptidic Inhibitors of Beta Amyloid Oligomerization Calgary, Alberta: University of Calgary. 164 p.
    [64] Gordon DJ, Tappe R, Meredith SC (2002) Design and characterization of a membrane permeable N-methyl amino acid-containing peptide that inhibits Abeta1-40 fibrillogenesis. J Pept Res 60: 37-55.
    [65] Parthsarathy V, McClean PL, Holscher C, et al. (2013) A novel retro-inverso peptide inhibitor reduces amyloid deposition, oxidation and inflammation and stimulates neurogenesis in the APPswe/PS1DeltaE9 mouse model of Alzheimer's disease. PLoS One 8: e54769. doi: 10.1371/journal.pone.0054769
    [66] Yu YJ, Zhang Y, Kenrick M, et al. (2011) Boosting brain uptake of a therapeutic antibody by reducing its affinity for a transcytosis target. Sci Transl Med 3: 84ra44.
    [67] 
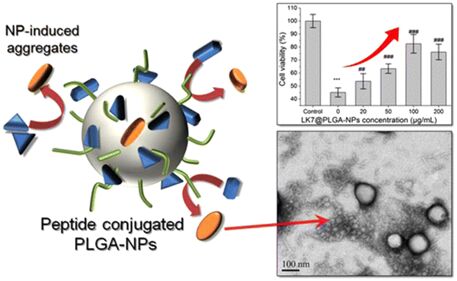
Xiong N, Dong X-Y, Zheng J, et al. (2015) Design of LVFFARK and LVFFARK-functionalized nanoparticles for inhibiting amyloid β-protein fibrillation and cytotoxicity. ACS Appl Mater Interfaces 7: 5650-5662. doi: 10.1021/acsami.5b00915
    [68] Taylor M, Moore S, Mourtas S, et al. (2011) Effect of curcumin-associated and lipid ligand-functionalized nanoliposomes on aggregation of the Alzheimer's Abeta peptide. Nanomedicine 7: 541-550. doi: 10.1016/j.nano.2011.06.015
    [69] Armstrong RA (2014) A critical analysis of the 'amyloid cascade hypothesis'. Folia Neuropathol 52: 211-225.
    [70] Castello MA, Soriano S (2014) On the origin of Alzheimer's disease. Trials and tribulations of the amyloid hypothesis. Ageing Res Rev 13: 10-12.
    [71] Chen Y, Liu L (2012) Modern methods for delivery of drugs across the blood-brain barrier. Adv Drug Deliv Rev 64: 640-665. doi: 10.1016/j.addr.2011.11.010
    [72] Pardridge WM (2003) Blood-brain barrier drug targeting: the future of brain drug development. Mol Interv 3: 90-105, 151. doi: 10.1124/mi.3.2.90
    [73] 
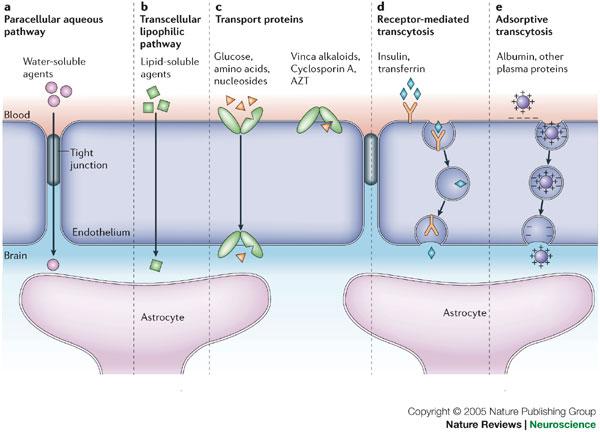
Abbott NJ, Patabendige AA, Dolman DE, et al. (2010) Structure and function of the blood-brain barrier. Neurobiol Dis 37: 13-25. doi: 10.1016/j.nbd.2009.07.030
    [74] Abbott NJ, Ronnback L, Hansson E (2006) Astrocyte-endothelial interactions at the blood-brain barrier. Nat Rev Neurosci 7: 41-53. doi: 10.1038/nrn1824
    [75] Mehta DC, Short JL, Nicolazzo JA (2013) Memantine transport across the mouse blood-brain barrier is mediated by a cationic influx H+ antiporter. Mol Pharm 10: 4491-4498. doi: 10.1021/mp400316e
    [76] Kim MH, Maeng HJ, Yu KH, et al. (2010) Evidence of carrier-mediated transport in the penetration of donepezil into the rat brain. J Pharm Sci 99: 1548-1566. doi: 10.1002/jps.21895
    [77] Cirrito JR, Deane R, Fagan AM, et al. (2005) P-glycoprotein deficiency at the blood-brain barrier increases amyloid-beta deposition in an Alzheimer disease mouse model. J Clin Invest 115: 3285-3290. doi: 10.1172/JCI25247
    [78] Deane R, Wu Z, Zlokovic BV (2004) RAGE (yin) versus LRP (yang) balance regulates alzheimer amyloid beta-peptide clearance through transport across the blood-brain barrier. Stroke 35: 2628-2631. doi: 10.1161/01.STR.0000143452.85382.d1
    [79] Guillemin GJ, Brew BJ (2004) Microglia, macrophages, perivascular macrophages, and pericytes: a review of function and identification. J Leukoc Biol 75: 388-397.
    [80] Bowman GL, Kaye JA, Moore M, et al. (2007) Blood-brain barrier impairment in Alzheimer disease: stability and functional significance. Neurology 68: 1809-1814. doi: 10.1212/01.wnl.0000262031.18018.1a
    [81] Claudio L (1996) Ultrastructural features of the blood-brain barrier in biopsy tissue from Alzheimer's disease patients. Acta Neuropathol 91: 6-14.
    [82] Kalaria RN (1992) The blood-brain barrier and cerebral microcirculation in Alzheimer disease. Cerebrovasc Brain Metab Rev 4: 226-260.
    [83] Marco S, Skaper SD (2006) Amyloid beta-peptide1-42 alters tight junction protein distribution and expression in brain microvessel endothelial cells. Neurosci Lett 401: 219-224. doi: 10.1016/j.neulet.2006.03.047
    [84] Zlokovic BV (2005) Neurovascular mechanisms of Alzheimer's neurodegeneration. Trends Neurosci 28: 202-208. doi: 10.1016/j.tins.2005.02.001
    [85] Wisniewski HM, Vorbrodt AW, Wegiel J (1997) Amyloid angiopathy and blood-brain barrier changes in Alzheimer's disease. Ann N Y Acad Sci 826: 161-172. doi: 10.1111/j.1749-6632.1997.tb48468.x
    [86] Kalaria RN, Sromek SM, Grahovac I, et al. (1992) Transferrin receptors of rat and human brain and cerebral microvessels and their status in Alzheimer's disease. Brain Res 585: 87-93. doi: 10.1016/0006-8993(92)91193-I
    [87] Jones AR, Shusta EV (2007) Blood-brain barrier transport of therapeutics via receptor-mediation. Pharm Res 24: 1759-1771. doi: 10.1007/s11095-007-9379-0
    [88] Gatter KC, Brown G, Trowbridge IS, et al. (1983) Transferrin receptors in human tissues: their distribution and possible clinical relevance. J Clin Pathol 36: 539-545. doi: 10.1136/jcp.36.5.539
    [89] Lee HJ, Engelhardt B, Lesley J, et al. (2000) Targeting rat anti-mouse transferrin receptor monoclonal antibodies through blood-brain barrier in mouse. J Pharmacol Exp Ther 292: 1048-1052.
    [90] 
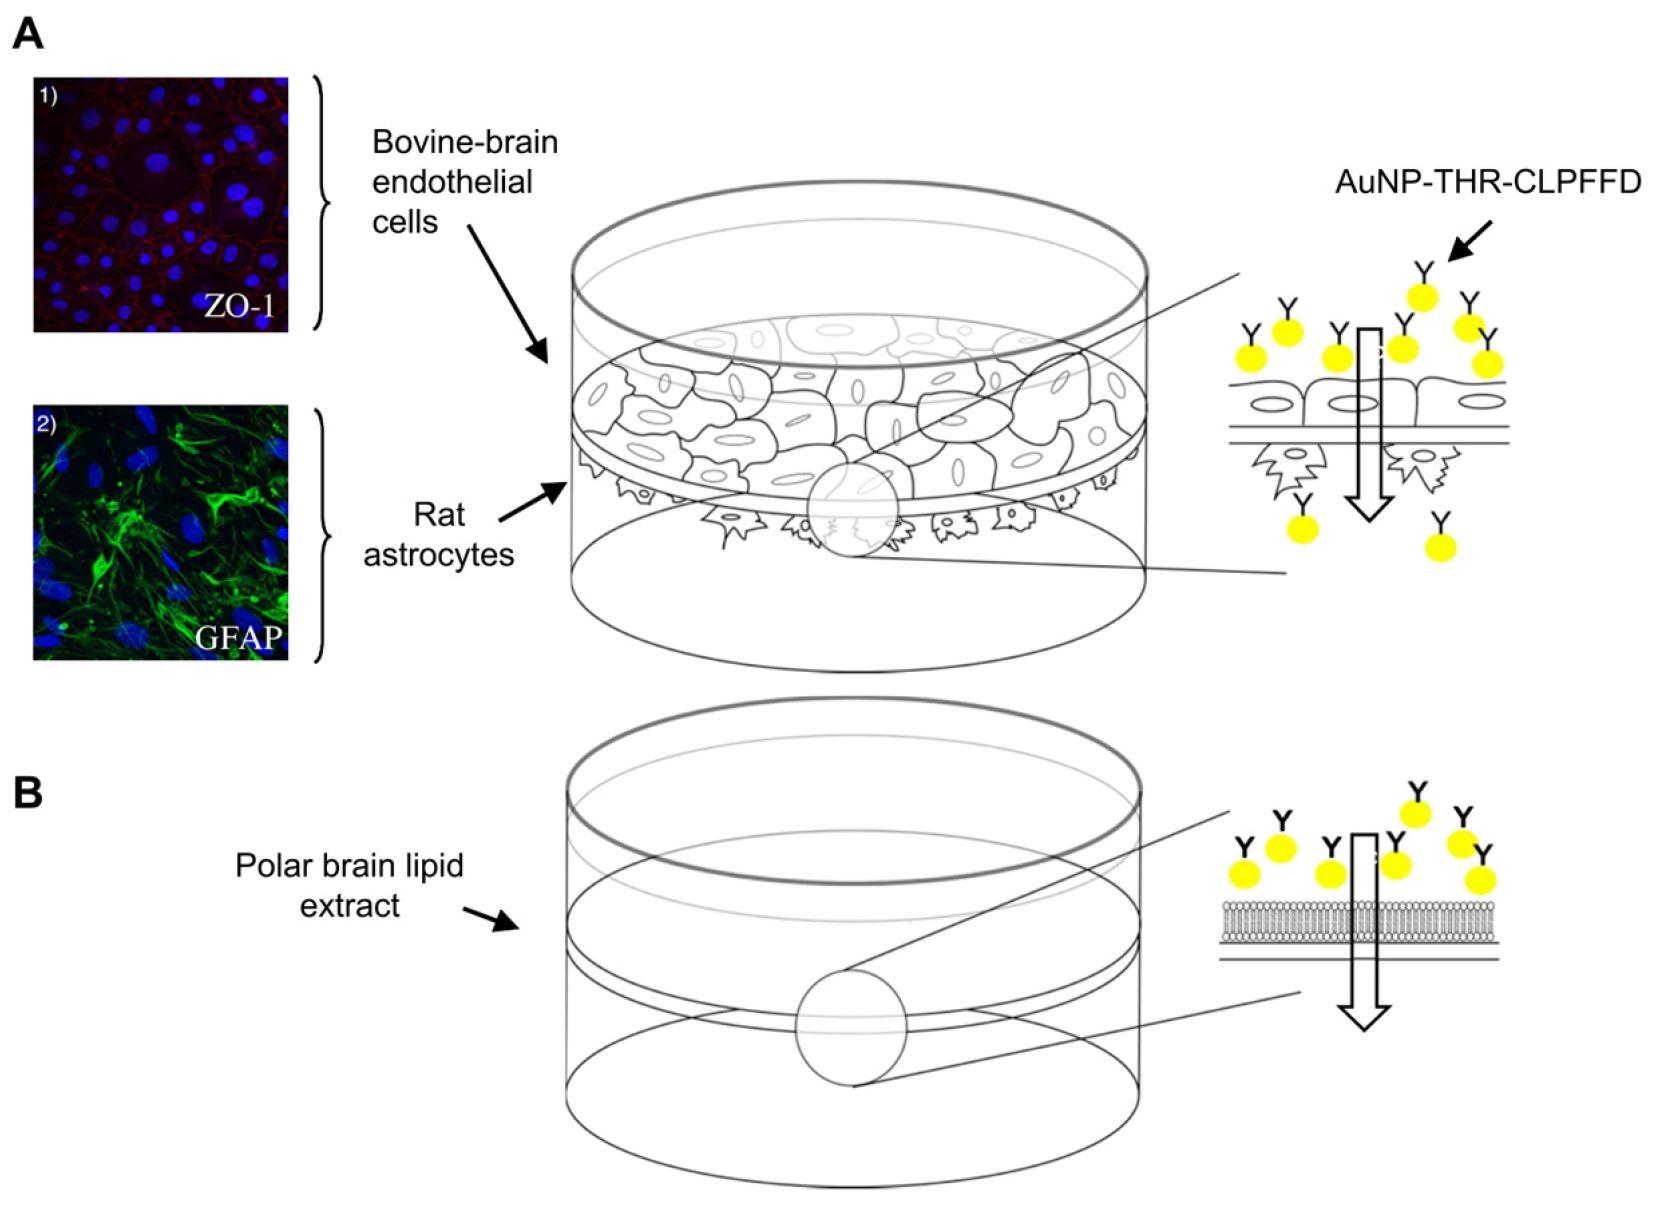
Prades R, Guerrero S, Araya E, et al. (2012) Delivery of gold nanoparticles to the brain by conjugation with a peptide that recognizes the transferrin receptor. Biomaterials 33: 7194-7205. doi: 10.1016/j.biomaterials.2012.06.063
    [91] Zhao WQ, De Felice FG, Fernandez S, et al. (2008) Amyloid beta oligomers induce impairment of neuronal insulin receptors. Faseb J 22: 246-260.
    [92] Xie L, Helmerhorst E, Taddei K, et al. (2002) Alzheimer's beta-amyloid peptides compete for insulin binding to the insulin receptor. J Neurosci 22: Rc221.
    [93] Markoutsa E, Papadia K, Giannou AD, et al. (2014) Mono and dually decorated nanoliposomes for brain targeting, in vitro and in vivo studies. Pharm Res 31: 1275-1289. doi: 10.1007/s11095-013-1249-3
    [94] Re F, Cambianica I, Sesana S, et al. (2010) Functionalization with ApoE-derived peptides enhances the interaction with brain capillary endothelial cells of nanoliposomes binding amyloid-beta peptide. J Biotechnol 156: 341-346.
    [95] Gaillard PJ, Visser CC, de Boer AG (2005) Targeted delivery across the blood-brain barrier. Expert Opin Drug Deliv 2: 299-309. doi: 10.1517/17425247.2.2.299
    [96] Lentz TL (1990) Rabies virus binding to an acetylcholine receptor alpha-subunit peptide. J Mol Recognit 3: 82-88. doi: 10.1002/jmr.300030205
    [97] Liu Y, Huang R, Han L, et al. (2009) Brain-targeting gene delivery and cellular internalization mechanisms for modified rabies virus glycoprotein RVG29 nanoparticles. Biomaterials 30: 4195-4202. doi: 10.1016/j.biomaterials.2009.02.051
    [98] Couch JA, Yu YJ, Zhang Y, et al. (2013) Addressing safety liabilities of TfR bispecific antibodies that cross the blood-brain barrier. Sci Transl Med 5: 183ra157, 181-112.
    [99] Bien-Ly N, Yu YJ, Bumbaca D, et al. (2014) Transferrin receptor (TfR) trafficking determines brain uptake of TfR antibody affinity variants. J Exp Med 211: 233-244. doi: 10.1084/jem.20131660
    [100] Yu YJ, Atwal JK, Zhang Y, et al. (2014) Therapeutic bispecific antibodies cross the blood-brain barrier in nonhuman primates. Sci Transl Med 6: 261ra154.
    [101] Niewoehner J, Bohrmann B, Collin L, et al. (2014) Increased brain penetration and potency of a therapeutic antibody using a monovalent molecular shuttle. Neuron 81: 49-60. doi: 10.1016/j.neuron.2013.10.061
    [102] 
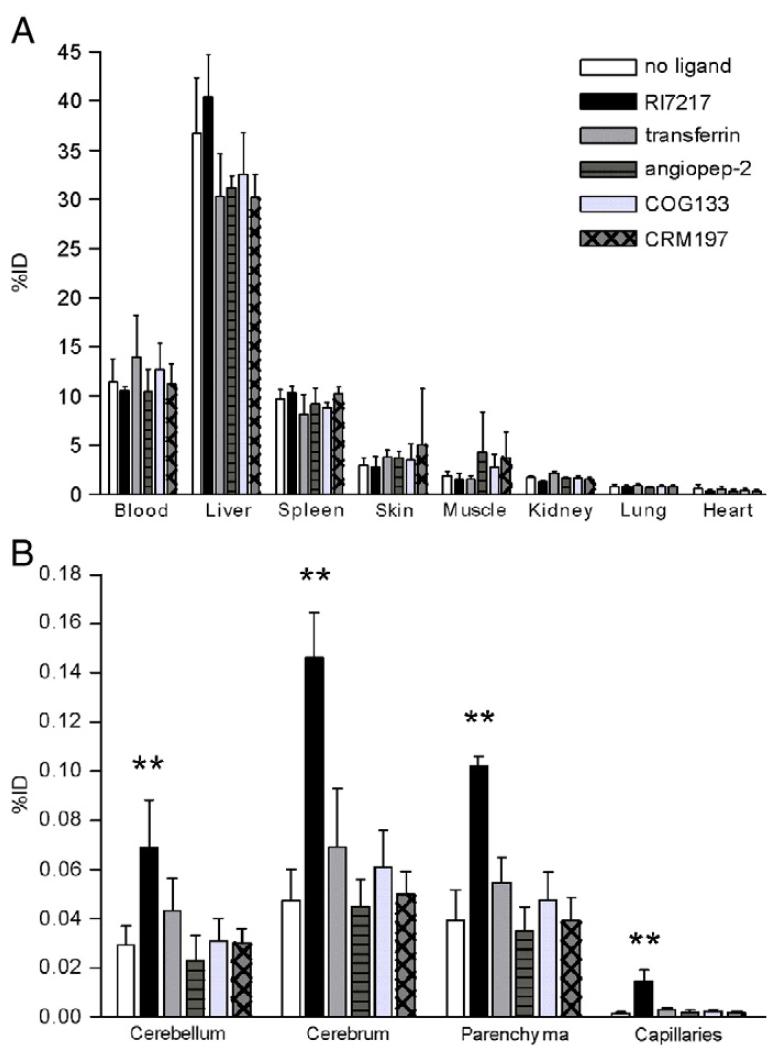
van Rooy I, Mastrobattista E, Storm G, et al. (2011) Comparison of five different targeting ligands to enhance accumulation of liposomes into the brain. J Control Release 150: 30-36. doi: 10.1016/j.jconrel.2010.11.014
    [103] Zhang C, Wan X, Zheng X, et al. (2014) Dual-functional nanoparticles targeting amyloid plaques in the brains of Alzheimer's disease mice. Biomaterials 35: 456-465. doi: 10.1016/j.biomaterials.2013.09.063
    [104] Zhang C, Zheng X, Wan X, et al. (2014) The potential use of H102 peptide-loaded dual-functional nanoparticles in the treatment of Alzheimer's disease. J Control Release 192: 317-324. doi: 10.1016/j.jconrel.2014.07.050
    [105] Salvati E, Re F, Sesana S, et al. (2013) Liposomes functionalized to overcome the blood-brain barrier and to target amyloid-beta peptide: the chemical design affects the permeability across an in vitro model. Int J Nanomedicine 8: 1749-1758.
    [106] Markoutsa E, Papadia K, Clemente C, et al. (2012) Anti-Abeta-MAb and dually decorated nanoliposomes: effect of Abeta1-42 peptides on interaction with hCMEC/D3 cells. Eur J Pharm Biopharm 81: 49-56. doi: 10.1016/j.ejpb.2012.02.006
    [107] Herve F, Ghinea N, Scherrmann JM (2008) CNS delivery via adsorptive transcytosis. AAPS J 10: 455-472. doi: 10.1208/s12248-008-9055-2
    [108] Pardridge WM, Buciak JL, Kang YS, et al. (1993) Protamine-mediated transport of albumin into brain and other organs of the rat. Binding and endocytosis of protamine-albumin complex by microvascular endothelium. J Clin Invest 92: 2224-2229.
    [109] Bickel U (1995) Antibody delivery through the blood-brain barrier. Adv Drug Deliv Rev 15: 53-72. doi: 10.1016/0169-409X(95)00005-R
    [110] Bechara C, Sagan S (2013) Cell-penetrating peptides: 20 years later, where do we stand? FEBS Lett 587: 1693-1702. doi: 10.1016/j.febslet.2013.04.031
    [111] Jaruszewski KM, Ramakrishnan S, Poduslo JF, et al. (2012) Chitosan enhances the stability and targeting of immuno-nanovehicles to cerebro-vascular deposits of Alzheimer's disease amyloid protein. Nanomedicine 8: 250-260. doi: 10.1016/j.nano.2011.06.008
    [112] Parhamifar L, Sime W, Yudina Y, et al. (2010) Ligand-induced tyrosine phosphorylation of cysteinyl leukotriene receptor 1 triggers internalization and signaling in intestinal epithelial cells. PLoS One 5: e14439. doi: 10.1371/journal.pone.0014439
    [113] Malhotra M, Tomaro-Duchesneau C, Prakash S (2013) Synthesis of TAT peptide-tagged PEGylated chitosan nanoparticles for siRNA delivery targeting neurodegenerative diseases. Biomaterials 34: 1270-1280. doi: 10.1016/j.biomaterials.2012.10.013
    [114] Sarvaiya J, Agrawal YK (2015) Chitosan as a suitable nanocarrier material for anti-Alzheimer drug delivery. Int J Biol Macromol 72: 454-465. doi: 10.1016/j.ijbiomac.2014.08.052
    [115] Gao Y, Wang ZY, Zhang J, et al. (2014) RVG-peptide-linked trimethylated chitosan for delivery of siRNA to the brain. Biomacromolecules 15: 1010-1018. doi: 10.1021/bm401906p
    [116] Sharma G, Modgil A, Layek B, et al. (2013) Cell penetrating peptide tethered bi-ligand liposomes for delivery to brain in vivo: Biodistribution and transfection. J Control Release 167: 1-10. doi: 10.1016/j.jconrel.2013.01.016
  • This article has been cited by:

    1. Mohammad Izadi, H.M. Srivastava, Numerical approximations to the nonlinear fractional-order Logistic population model with fractional-order Bessel and Legendre bases, 2021, 145, 09600779, 110779, 10.1016/j.chaos.2021.110779
    2. Saif Ullah, Sana Zulfiqar, Anum Aish Buhader, Najeeb Alam Khan, Analysis of Caputo-Fabrizio fractional order semi-linear parabolic equations via effective amalgamated technique, 2021, 96, 1402-4896, 035214, 10.1088/1402-4896/abd796
    3. C. J. Zúñiga-Aguilar, J. F. Gómez-Aguilar, H. M. Romero-Ugalde, Hadi Jahanshahi, Fawaz E. Alsaadi, Fractal-fractional neuro-adaptive method for system identification, 2021, 0177-0667, 10.1007/s00366-021-01314-w
    4. P. Veeresha, D.G. Prakasha, Abdel-Haleem Abdel-Aty, Harendra Singh, Emad E. Mahmoud, Sunil Kumar, An efficient approach for fractional nonlinear chaotic model with Mittag-Leffler law, 2021, 33, 10183647, 101347, 10.1016/j.jksus.2021.101347
    5. Hari Mohan Srivastava, Khaled M. Saad, A Comparative Study of the Fractional-Order Clock Chemical Model, 2020, 8, 2227-7390, 1436, 10.3390/math8091436
    6. Hamdy I. Abdel‐Gawad, Ali A. Aldailami, Khaled M. Saad, José F. Gómez‐Aguilar, Numerical solution of q ‐dynamic equations , 2020, 0749-159X, 10.1002/num.22725
    7. H. M. Srivastava, Khaled M. Saad, Numerical Simulation of the Fractal-Fractional Ebola Virus, 2020, 4, 2504-3110, 49, 10.3390/fractalfract4040049
    8. Kashif Ali Abro, Abdon Atangana, José Francisco Gomez-Aguilar, Role of bi-order Atangana–Aguilar fractional differentiation on Drude model: an analytic study for distinct sources, 2021, 53, 0306-8919, 10.1007/s11082-021-02804-3
    9. H. M. Srivastava, I. Area, J. J. Nieto, Power-series solution of compartmental epidemiological models, 2021, 18, 1551-0018, 3274, 10.3934/mbe.2021163
    10. Hassan Khan, J. F. Gómez-Aguilar, A. A. Alderremy, Shaban Aly, Dumitru Baleanu, On the approximate solution of fractional-order Whitham–Broer–Kaup equations, 2021, 35, 0217-9849, 2150192, 10.1142/S021798492150192X
    11. Ebenezer Bonyah, Ali Akgül, On solutions of an obesity model in the light of new type fractional derivatives, 2021, 147, 09600779, 110956, 10.1016/j.chaos.2021.110956
    12. Tahir Khan, The analysis of fractional-order hepatitis B epidemiological model, 2022, 1745-5030, 1, 10.1080/17455030.2022.2120217
    13. Nauman Raza, Zara Hassan, J. F. Gómez-Aguilar, Extraction of new super-Gaussian solitons via collective variables, 2021, 53, 0306-8919, 10.1007/s11082-021-03125-1
    14. Tahir Khan, Roman Ullah, Ali Yousef, Gul Zaman, Qasem M. Al-Mdallal, Yasser Alraey, M. De Aguiar, Modeling and Dynamics of the Fractional Order SARS-CoV-2 Epidemiological Model, 2022, 2022, 1099-0526, 1, 10.1155/2022/3846904
    15. H. M. Srivastava, Rashid Jan, Asif Jan, Wejdan Deebani, Meshal Shutaywi, Fractional-calculus analysis of the transmission dynamics of the dengue infection, 2021, 31, 1054-1500, 053130, 10.1063/5.0050452
    16. Hari M. Srivastava, Jaouad Danane, Analysis of a Stochastic SICR Epidemic Model Associated with the Lévy Jump, 2022, 12, 2076-3417, 8434, 10.3390/app12178434
    17. Babak Shiri, Dumitru Baleanu, A General Fractional Pollution Model for Lakes, 2022, 4, 2096-6385, 1105, 10.1007/s42967-021-00135-4
    18. Hassan Khan, Rasool Shah, J.F. Gómez-Aguilar, Dumitru Baleanu, Poom Kumam, D. Baleanu, D. Kumar, J. Hristov, Travelling waves solution for fractional-order biological population model, 2021, 16, 0973-5348, 32, 10.1051/mmnp/2021016
    19. Xiaolan Liu, Cheng-Cheng Zhu, Hari Mohan Srivastava, Hongyan Xu, Global Stability for a Diffusive Infection Model with Nonlinear Incidence, 2022, 10, 2227-7390, 4296, 10.3390/math10224296
    20. Jianghua Han, Optimization System of Strength and Flexibility Training in Aerobics Course Based on Lagrangian Mathematical Equation, 2022, 0, 2444-8656, 10.2478/amns.2022.2.0169
    21. H. M. Srivastava, Sinan Deniz, A new modified semi-analytical technique for a fractional-order Ebola virus disease model, 2021, 115, 1578-7303, 10.1007/s13398-021-01081-9
    22. Sergio Adriani David, Carlos Alberto Valentim, Amar Debbouche, Fractional Modeling Applied to the Dynamics of the Action Potential in Cardiac Tissue, 2022, 6, 2504-3110, 149, 10.3390/fractalfract6030149
    23. SHU-BO CHEN, SAMANEH SORADI-ZEID, MARYAM ALIPOUR, YU-MING CHU, J. F. GÓMEZ-AGUILAR, HADI JAHANSHAHI, OPTIMAL CONTROL OF NONLINEAR TIME-DELAY FRACTIONAL DIFFERENTIAL EQUATIONS WITH DICKSON POLYNOMIALS, 2021, 29, 0218-348X, 2150079, 10.1142/S0218348X21500791
    24. Tahir Khan, Rahman Ullah, Thabet Abdeljawad, Manar A. Alqudah, Faizullah Faiz, A Theoretical Investigation of the SARS-CoV-2 Model via Fractional Order Epidemiological Model, 2023, 135, 1526-1506, 1295, 10.32604/cmes.2022.022177
    25. Tahir Khan, Saeed Ahmad, Rahman Ullah, Ebenezer Bonyah, Khursheed J. Ansari, The asymptotic analysis of novel coronavirus disease via fractional-order epidemiological model, 2022, 12, 2158-3226, 035349, 10.1063/5.0087253
    26. Dong-Me Li, Bing Chai, Qi Wang, A model of hepatitis B virus with random interference infection rate, 2021, 18, 1551-0018, 8257, 10.3934/mbe.2021410
    27. Hari M. Srivastava, Abedel-Karrem N. Alomari, Khaled M. Saad, Waleed M. Hamanah, Some Dynamical Models Involving Fractional-Order Derivatives with the Mittag-Leffler Type Kernels and Their Applications Based upon the Legendre Spectral Collocation Method, 2021, 5, 2504-3110, 131, 10.3390/fractalfract5030131
    28. Sachin Kumar, Dia Zeidan, Numerical study of Zika model as a mosquito-borne virus with non-singular fractional derivative, 2022, 15, 1793-5245, 10.1142/S1793524522500188
    29. Amit Kumar Saraswat, Manish Goyal, Numerical simulation of time-dependent influenza model with Atangana–Baleanu non-integer order derivative in Liouville–Caputo sense, 2022, 96, 0973-7111, 10.1007/s12043-022-02335-w
    30. Tahir Khan, Roman Ullah, Gul Zaman, Jehad Alzabut, A mathematical model for the dynamics of SARS-CoV-2 virus using the Caputo-Fabrizio operator, 2021, 18, 1551-0018, 6095, 10.3934/mbe.2021305
    31. Fırat EVİRGEN, Esmehan UÇAR, Sümeyra UÇAR, Necati ÖZDEMİR, Modelling Influenza A disease dynamics under Caputo-Fabrizio fractional derivative with distinct contact rates, 2023, 3, 2791-8564, 58, 10.53391/mmnsa.1274004
    32. J.E. Lavín-Delgado, S. Chávez-Vázquez, J.F. Gómez-Aguilar, V.H. Olivares-Peregrino, Eduardo Pérez-Careta, Trajectory tracking of a mobile robot manipulator using fractional backstepping sliding mode and neural network control methods, 2024, 0228-6203, 1, 10.1080/02286203.2024.2371678
    33. Sana Abdulkream Alharbi, Mohamed A. Abdoon, Rania Saadeh, Reima Daher Alsemiry, Reem Allogmany, Mohammed Berir, Fathelrhman EL Guma, Modeling and analysis of visceral leishmaniasis dynamics using fractional‐order operators: A comparative study, 2024, 47, 0170-4214, 9918, 10.1002/mma.10101
    34. Asia Kanwal, Salah Boulaaras, Ramsha Shafqat, Bilal Taufeeq, Mati ur Rahman, Explicit scheme for solving variable-order time-fractional initial boundary value problems, 2024, 14, 2045-2322, 10.1038/s41598-024-55943-4
    35. H.M. Srivastava, 2025, 9780443288142, 1, 10.1016/B978-0-44-328814-2.00007-2
  • Reader Comments
  • © 2015 the Author(s), licensee AIMS Press. This is an open access article distributed under the terms of the Creative Commons Attribution License (http://creativecommons.org/licenses/by/4.0)
通讯作者: 陈斌, bchen63@163.com
  • 1. 

    沈阳化工大学材料科学与工程学院 沈阳 110142

  1. 本站搜索
  2. 百度学术搜索
  3. 万方数据库搜索
  4. CNKI搜索

Metrics

Article views(10573) PDF downloads(1975) Cited by(16)

Figures and Tables

Figures(6)

/

DownLoad:  Full-Size Img  PowerPoint
Return
Return

Catalog