Transcatheter aortic valve implantation (TAVI) is now a widely adopted option for many inoperable and high risk patients with severe aortic valve stenosis, and clinical trials continue to show great benefit with regards to mortality and major cardiovascular endpoints. As the technology continues to expand and possibly grow to include intermediate and low risk populations, investigators have remained focused on efforts to reduce the risk of peri-procedural complications, of which neurologic events remain some of the most feared. Fortunately, contemporary studies have shown a significant decline in the risk of stroke with TAVI as compared to early clinical trials, and no difference when compared to surgical aortic valve replacement in the most recent trials. This review will focus on current methods for diagnosing, defining, and quantifying the effect of stroke after TAVI, explore the evidence with regards to stroke risk in various populations undergoing these procedures, discuss possible mechanisms for both early and late neurologic events after TAVI, and discuss strategies for both pharmacologic and device based embolic protection during these procedures.
1.
Introduction
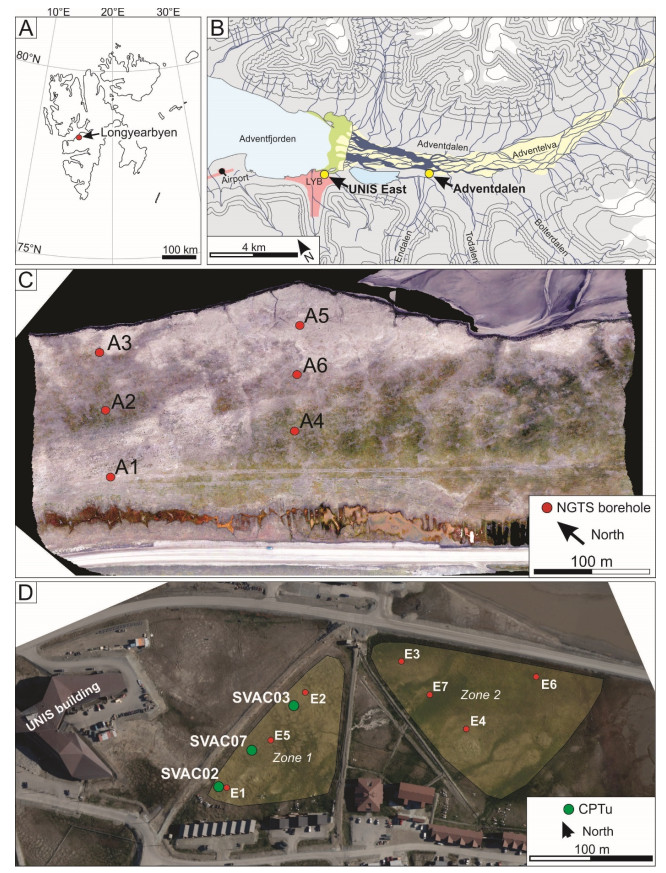
The Norwegian GeoTest Sites (NGTS) project has established five benchmark sites in Norway to test and verify innovative soil investigation methods and foundation solutions in different soil conditions [1]. In Svalbard, the NGTS project has developed two field sites: Adventdalen and UNIS East. The Adventdalen site is in the Advent Valley (Norwegian: Adventdalen), ca. 5 km east of the settlement of Longyearbyen. The UNIS East site is located east of the University Centre in Svalbard (UNIS). The locations of these sites are given in Figure 1. Svalbard is located within the continuous permafrost zone, meaning permafrost is spatially ubiquitous [2]. The Svalbard sites are included within the NGTS project to investigate topics including foundation methodology, site investigation techniques, embankment behavior, and artificial cooling systems in saline marine clays and intermediate permafrost soils. These sites were selected as they are representative of the soil conditions in Svalbard and other Arctic locations.
Saline permafrost is present in Arctic regions near to contemporary coasts and in environments where the land surface has been exposed during relative sea-level fall [3,4]. In these settings, pore water solutes are residual from the time of deposition, though salts may be redistributed during permafrost growth. The presence of salts complicates geotechnical conditions as pore water salinity influences the freezing temperature and mechanical behavior of the soils [5]. In some cases, the accumulation or concentration of pore water solutes permit the presence of cryopegs, zones of unfrozen cryotic soil. In Svalbard, marine deposits are typically found in valley bottoms, below the Holocene marine limit [6]. While previous investigations in Svalbard have determined the salt content of the near-surface permafrost [7], this is the first study to investigate pore water salinity to a depth of 30 m and to quantify the effect of soil salinity on the freezing-point depression.
The objective of this paper is to describe the soil stratigraphy and permafrost conditions at the NGTS research sites in Svalbard. The specific aims are to: (ⅰ) present the regional geology and sedimentary development at the two sites, (ⅱ) describe the soil stratigraphy as determined by field and laboratory testing, (ⅲ) analyze the effectiveness of rate-controlled piezocone penetration tests (CPTU) in saline, permafrost soil, and (ⅳ) present supplementary investigations and the potential future uses of the test sites in Svalbard. Saline permafrost and intermediate soils are widespread throughout the Arctic. The results of the NGTS project and forthcoming investigations will therefore be of interest to engineers and scientists working in these settings.
2.
Study region
2.1. Glacial history, geology, and permafrost formation
Svalbard was glaciated several times during the late Quaternary [8]. The last glaciation culminated during the Last Glacial Maximum, ca. 20 ka [9]. During this period, ice streams situated in the fjords and valleys removed most of the sedimentary record from previous interglacial and glacial periods [10]. Deglaciation commenced ca. 15 ka and proceeded rapidly [11]. The study area was ice free by ca. 11.3 ka [6].
Following deglaciation, sea level in the study region was ca. 62-70 m above present [12]. This marine limit demarcates the maximum elevation of marine sediments on land. Relative sea level declined exponentially during the Holocene as rates of isostatic rebound outpaced global eustatic sea-level rise. Contemporary sea level was reached ca. 5 ka [13].
The two sites are located within sediment filled former fjords. Fjords are incised bedrock valleys which are formed during glaciation and afterwards inundated by the sea. These depocenters are scoured by ice flow and accumulate subglacial deposits during glacial periods and are filled principally by fjord-head deltas during deglaciation and in post-glacial time [14,15]. The sedimentary and permafrost history of the study area has been described by [6]. A typical fjord-valley fill succession consists of a veneer of till overlain by marine deposits, an upwards-coarsening sequence of deltaic sediments, and fluvial deposits. The bulk of the fjord-valley fill is deposited into a marine setting. This is significant as: (ⅰ) residual solutes impact the behavior and strength of frozen soils and (ⅱ) portions of all settlements in Svalbard are located below the early Holocene marine limit. The response of saline permafrost to climate change is therefore of regional interest.
Permafrost grew downwards into the fjord-valley fill deposits following emergence [6]. This type of epigenetic permafrost is characteristically ice poor. In Adventdalen, the onset of permafrost growth coincided with the transition from fluvial to loess deposits. However, it is difficult to exclude the possibility that permafrost formed under shallow channels or bars in the fluvial domain. In either case, permafrost below the marine limit is a Holocene phenomenon. Syngenetic permafrost, enriched with segregated ice, grew upwards in an agammaading sedimentary unit. Ice-rich permafrost is restricted to the upper few meters of the soil stratigraphy in Adventdalen and it is this zone which is anticipated to undergo the greatest degree of geomorphic change in response to permafrost degradation.
2.2. Climate
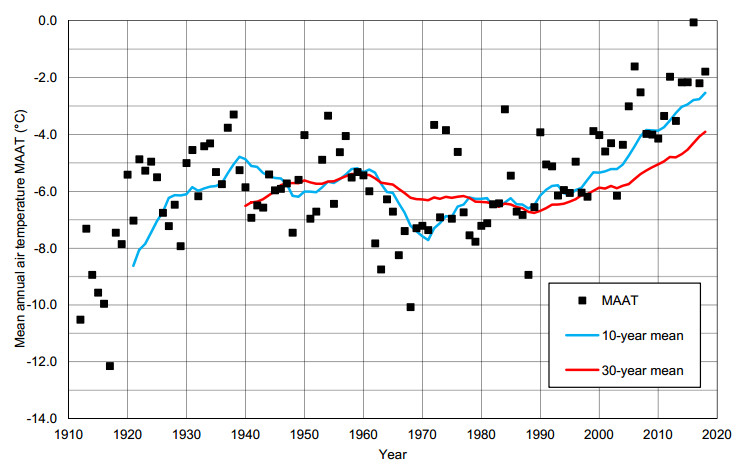
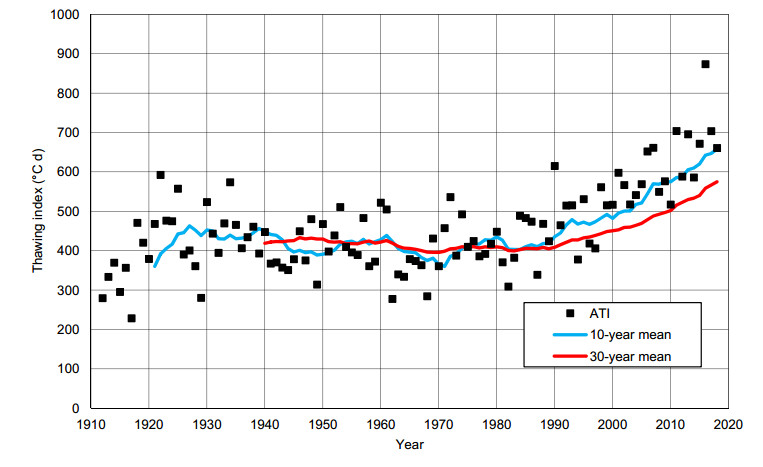
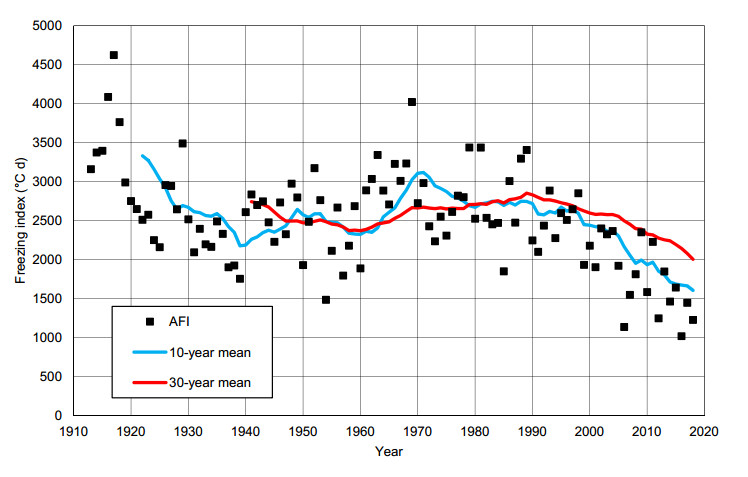
The mean annual air temperature in Svalbard has increased 3 ℃ to 5 ℃ during the last 40 to 50 years [16]. Figure 2 presents the mean annual air temperature and the running 10-year and 30-year mean annual air temperatures for Longyearbyen (modified from [17], data from the Norwegian Meteorological Institute [18]). The corresponding air thawing and air freezing indices are presented in Figures 3 and 4, respectively. It can be observed from the figures that the 30-year mean annual air temperature has increased from -6.8 ℃ in 1989 to -3.9 ℃ in 2018. During the same time period, the 30-year mean air thawing index has increased from approximately 400 ℃·days to 575 ℃·days, with a maximum of 873 ℃·days in 2016. The air freezing index has decreased from approximately 2850 ℃·days in 1989 to 2000 ℃·days in 2018. The continuous warming trend observed in Svalbard during the last 30 years is creating concerns related to the stability and durability of existing infrastructure on permafrost and uncertainties related to the design of new structures and infrastructure in the region [19]. It is, therefore, especially important to establish a reference field site for long-term geotechnical field-testing in permafrost in Svalbard.
3.
Field and laboratory investigations
3.1. Site descriptions
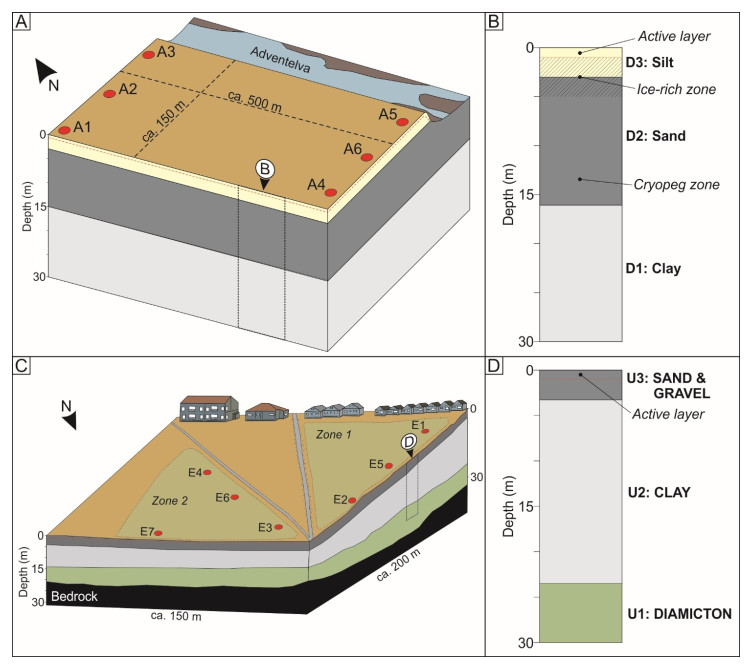
The Adventdalen site is in Adventdalen, ca. 5 km east of Longyearbyen at ca. 6 m a.s.l. (Figure 1). The site measures ca. 400 m × 200 m and is located on an agammaading loess terrace, elevated ca. 3-4 m above the Advent River (Norwegian: Adventelva), with ice wedges [20]. The loess cover is 3 m thick and is underlain by fluvial, deltaic, marine, and glacial deposits. Permafrost is primarily ice poor and epigenetic. Ice-enriched, syngeneic permafrost is restricted to the upper 3-4 m of the soil stratigraphy. The active-layer thickness is approximately 1 m and the ground temperature recorded at 10 m depth is -5 ℃ [2]. The depth to bedrock is ca. 60 m [6].
The UNIS East site (Figure 1) is located at 1 to 8 m a.s.l., between 0.1 km and 0.3 km southeast of the Svalbard Science Centre (UNIS building in Figure 1). The westernmost area (zone 1) is situated between 5 and 8 m a.s.l. and is routinely used for sampling of fine-grained soil by UNIS. The area furthest east (zone 2; Figure 1) is situated between ca. 1 and 4 m a.s.l. The site has a total area of ca. 50,000 m2.
3.2. Field investigations
Field investigations included drilling, core and sample retrieval, casing of boreholes, installation of temperature sensors, and CPTU. Samples were retrieved and casings were installed at 13 sites (Figure 1; Table 1).
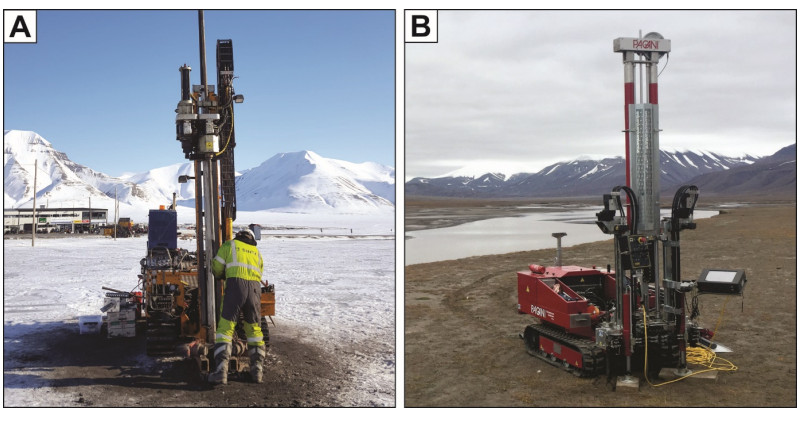
Several drilling methods were employed to retrieve samples for laboratory testing and install the casings for thermistor strings. Bag samples of cuttings were collected using a soil auger and down-the-hole (DTH) drill. Core sampling in frozen soil was conducted by SINTEF using a drill rig (Figure 5) equipped with a core barrel with flights and poly-crystalline diamond composite bit inserts. This core barrel is used without drilling fluids and obtains samples with a 47 mm diameter. Core sampling in the unfrozen, cryopeg zones was done using a 54 mm piston sampler from Geonor AS.
Boreholes were cased with plastic pipes (Ø = 50 mm) and instrumented with thermistor strings (GeoPrecision M-Log5W). Ground thermal monitoring allowed for the characterization of permafrost temperatures at each site. This instrumentation will also enable the monitoring of the ground thermal regime and assessment of the thermal response of permafrost to changes in climate and surface conditions over the lifespan of the NGTS project.
Collaboration with Pagani Geotechnical Equipment provided access to a CPTU rig (TG63-150; Figure 5). Measured parameters include cone resistance (qc; given in MPa), sleeve friction (fs, given in MPa), penetration pore pressure (u2, given in kPa), temperature, depth, rate of penetration, and inclination. Derived parameters include the cone resistance corrected for pore pressure effects (qt, given in MPa) and the friction ratio (Rf, given in %) (c.f. [21]). CPTU was performed at the UNIS East site in late August, 2018. The cone size was 10 cm2. The target rate of penetration was 20 mm s-1. Extension rods of 1 m length were used during testing. The tests were typically discontinued by 15 m depth as the force generated during testing exceeded the strength of the anchors. The application of these parameters in inferring the behavioral characteristics of the permafrost soils in Svalbard is currently being evaluated and preliminary results are presented here. These tests build on previous investigations using CPT in Svalbard [22]. Seismic piezocone penetration tests (SCPTU) and standard penetration tests (SPT) can also be performed using this rig.
Additional field activities, not contained herein, included electrical resistivity tomography (ERT) surveys, conducted in collaboration with the Norwegian Geotechnical Institute.
3.3. Laboratory investigations
Approximately 400 m of cores and bag samples were recovered from the 13 boreholes (Table 1). The soil samples were tested at the geotechnical laboratory at UNIS. Parameters measured during laboratory testing included: grain size distribution by wet sieving and hydrometer methods, water content and Atterberg limits, dry densities, total densities, density of solids, salinity of pore water, frozen and unfrozen thermal conductivities, and organic content. Derived parameters included the degree of saturation and porosity. This paper presents the laboratory index testing completed by December 2018.
4.
Stratigraphy and soil conditions
4.1. Adventdalen site
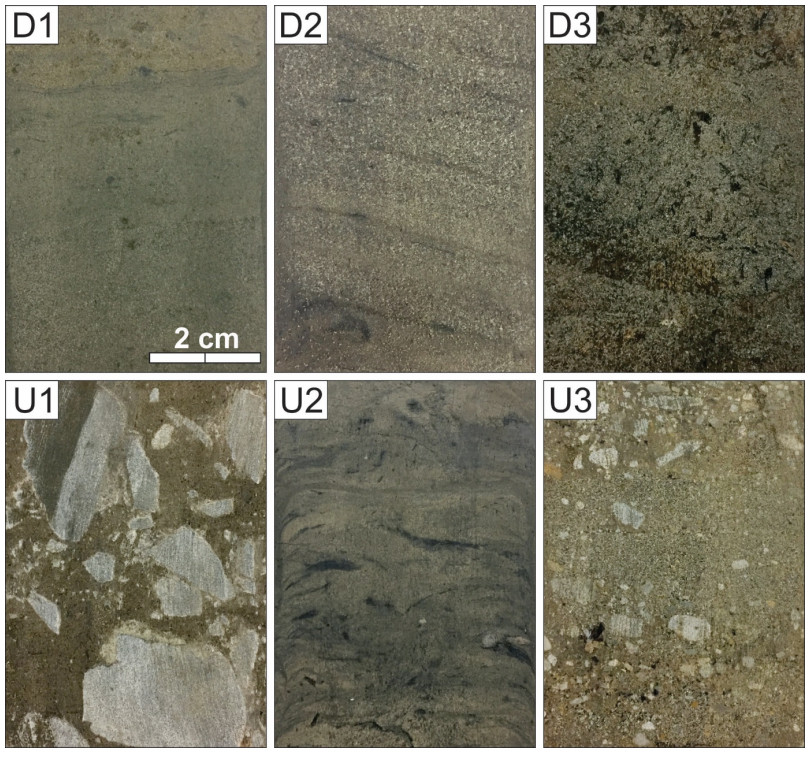
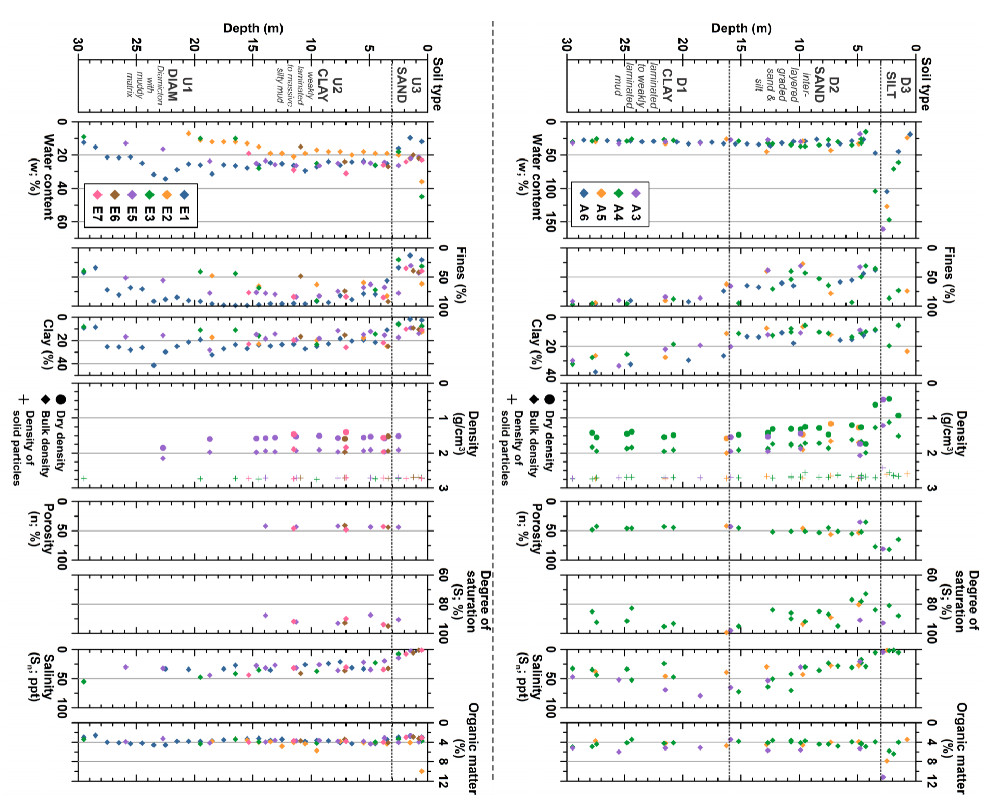
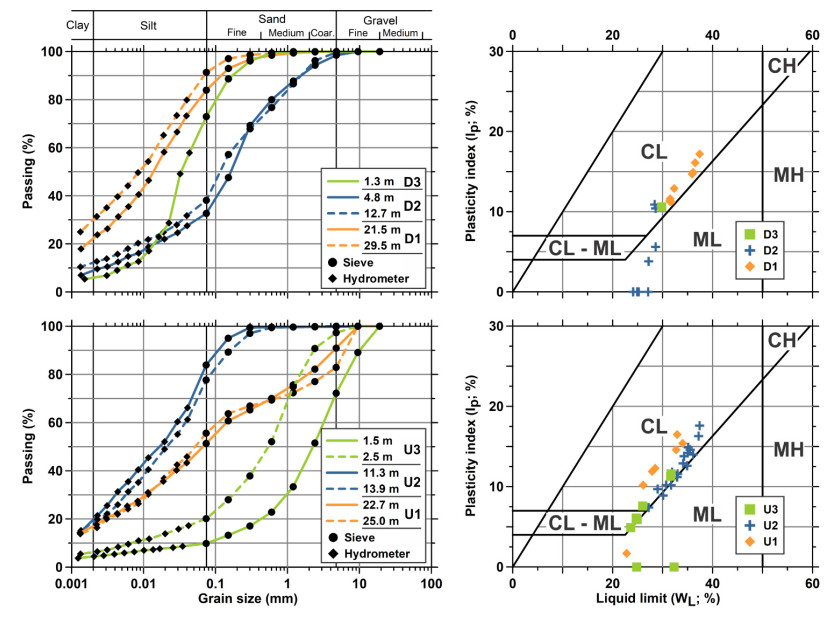
The soil stratigraphy at the Adventdalen site is comprised of a top layer of sandy clayey silt (Unit D3; terrain surface to ca. 3 m depth), followed by ca. 13 m of silty sand (Unit D2) over clay or silty clay (Unit D1; 16 m to 30 m depth). Example images of the soils units are presented in Figures 6 and the vertical distribution is indicated in Figure 7. Representative grain size distributions of each unit are plotted in Figure 8. Unit D3 is plant-bioturbated, sandy silt of aeolian origin (c.f. [20]). Unit D2 contains interlayered graded sands and silts. Unit D1 consists of laminated or weakly laminated muds. Units D2 and D1 correspond to the delta-slope and delta-foot deposits, respectively, described by Gilbert et al. [6]. A schematic representation of the site based on drill core information is presented in Figure 9 together with a simplified stratigraphy.
Ice-enriched permafrost characterizes the near surface, from the base of the active layer (1 m) to 4 m depth. The natural water content is highest in this interval, reaching values upwards of 150%. Water content values for the remainder of D2 and D1 range between 25% and 45% but are commonly between 28% and 35% (Figure 7). For D1, the liquid limit (WL) fell between 30% and 38%, plastic limits (WP) ranged from 20% to 22%, and plasticity data plotted above the A-line (Figure 8). Due to the high sand content, it was difficult to obtain realistic values for the Atterberg limits in Unit D2. As illustrated in Figure 8, WL values ranged between 25% and 30% while WP varied within the unit.
The pore water salinity profiles from the Adventdalen site are presented in Figure 7. Salinity was lowest in Unit D3 where it ranged from 1.0 ppt to 4.8 ppt. Salinity generally increased in a down core direction in Unit D2 reaching maximum values of 72 ppt at ca. 16 m depth. This pattern is likely explained by the downwards expulsion of pore water solutes in front of an advancing freezing front during permafrost growth. Salinity in Unit D1 varied between drillholes and ranged from 32 ppt to 79 ppt. Comparable soil salinity values of 20 ppt to 60 ppt were presented from the Svea Clay deposits at the head of Van Mijen Fjord, Svalbard [7].
4.2. UNIS East site
The soil stratigraphy at UNIS East consists of a top layer of gravelly silty sand (Unit U3; terrain surface to ca. 3 m depth) underlain by silty clay (Unit U2) over diamicton (Unit U1; sandy, silty, clay). The thickness of these units varies between drillholes. Images of the soil units from UNIS East are given in Figure 6 and the soil stratigraphy and the results of index testing are presented in Figure 7. Example grain size distribution plots are presented in Figure 8. The depth to bedrock at UNIS East ranges from 21 m to over 30 m. A schematic illustrating the thickness of each unit based on laboratory results and observations during drilling is presented in Figure 9.
Coarser deposits of sands and gravels in Unit U3 are concentrated near the surface and are believed to represent alluvial fan deposits. Unit U2 is described as weakly laminated to massive silty mud. In many cases the samples appear to have been nearly completely homogenized by bioturbation (Figure 6). Unit U2 is interpreted to have been deposited in a quiescent fjord environment and may be comparable to the glaciomarine deposits described by Gilbert et al. [6]. Unit U1, a diamicton with a muddy matrix, overlays bedrock and is interpreted to be glacial deposits on the basis of stratigraphy and sedimentological composition. This unit is comparable to the glacial deposits described by Gilbert et al. [6].
The natural water content varied between stratigraphic units at the UNIS East site but typically fell between 18% and 30%. Lower values were recorded in the diamicton of Unit U1 (10% to 21%). WL ranged from 24% to 32% in U3, 27% to 37% in U2, and 23% to 34% in U1. WP ranged from 18% to 20% in U3, 20% to 22% in U2, and 16% to 21% in U1. The plasticity index (IP) ranged from 5% to 11% in U3, 8% to 17% in U2, and 2% to 15% in U1.
Pore water salinity profiles for the drill sites at UNIS East are presented in Figure 7. The lowest values (1.0 ppt to 14 ppt) were found in Unit U3 with higher values at greater depth. In general, salinity increased in a down core direction through Unit U2, towards the base where it reached values of 40 ppt to 54 ppt. Salinity values of 30 ppt to 32 ppt were characteristic of Unit U1.
5.
Ground thermal regime and freezing-point depression
5.1. Ground thermal regime
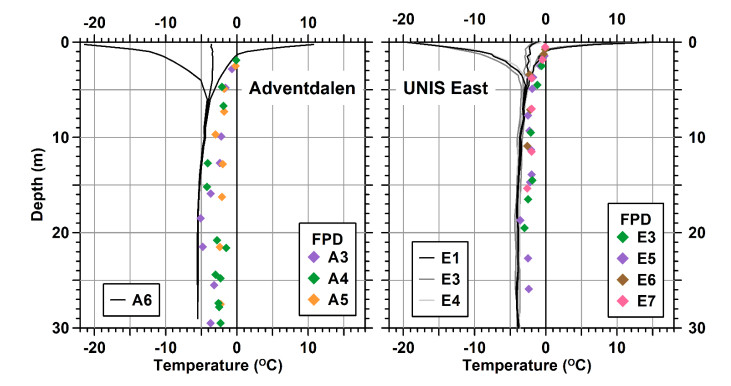
Ground temperatures at the Adventdalen and UNIS East sites are presented in Figure 10. The maximum-minimum curve constructed for the Adventdalen site was based on data measured at A6 from the period between 01/04/2018 and 31/03/2019. This is currently the longest time series available from the site. The three sets of curves presented for the UNIS East site (E1, E3, and E4) are constructed using data from the 2018 hydrological year (i.e. 01/09/2017-31/08/2018).
Ground temperatures at the depth of zero annual amplitude (8 m depth) at the Adventdalen site was ca. -4.0 ℃ while the mean temperature at the base of the borehole (29 m depth) was -5.5 ℃. At the UNIS East site, mean annual ground surface temperatures ranged from -1.6 ℃ (E3) to -0.4 ℃ (E4), illustrating the spatial variability over short distances. Mean annual temperature at the permafrost surface ranged from -2.8 ℃ (E3) to -2.2 ℃ (E1). The depth of zero annual amplitude was encountered at approximately 9 m at all sites where mean temperatures ranged from -3.7 ℃ (E3) to -3.6 ℃ (E4). Temperatures at the base of the boreholes varied from -3.9 ℃ (E3) to -3.7 ℃ (E4).
5.2. Freezing-point depression
Increased pore water salinity depresses the soil freezing point. The freezing-point depression (FPD) of the investigated soils is plotted together with the ground temperature profiles in Figure 10. As identified previously, measured salinities range from 1.0 ppt in D3 and U3 to upwards of 60 ppt in D2, D3, and U2. The FPD of these soils ranges from -0.1 ℃ to -5.1 ℃. Within the saline soils of Units D2, D3, U2, and U3, the FPD was commonly between -2 ℃ and -4 ℃. As is illustrated in Figure 10, ambient ground temperatures are typically within 1 ℃ to 2 ℃ of the FPD. The saline soils are therefore in an unfrozen or plastic frozen state and are poorly ice bonded at ambient ground temperatures of -3.5 ℃ to -5.5 ℃. At the Adventdalen site, field investigations have revealed the presence of cryopegs (pockets of cryotic, unfrozen ground) between ca. 12 m and 18 m depth. Cryopegs are also believed to be present at the UNIS East site.
5.3. Saline permafrost soils and climate change
The presence of saline soil conditions at both the UNIS East and Adventdalen sites is identified by field and laboratory investigations. While analysis of the chemical composition of the saline pore water is currently being undertaken, the salts are believed to be residual from the time of deposition. Localized redistribution and concentration of pore water solutes are likely related to pore water expulsion effects during the downwards growth of epigenetic permafrost at the sites. The saline soils (Units D1, D2, U1, and U2) have freezing points of between -1 ℃ to -5 ℃. This indicates that soils in relatively cold permafrost environments may be close to their freezing point due to the effects of pore water solutes. Saline permafrost near Longyearbyen-and probably elsewhere below the marine limit in Svalbard-is geotechnically similar to "warm" permafrost as it exists within a few degrees of the soil freezing point. Observations in Svalbard and elsewhere in the Arctic record steadily increasing ground temperatures. As ground temperatures in permafrost regions continue to warm in response to climate changes, sites with saline soils will experience a reduced rate of change about the freezing-point depression, as would a non-saline soil upon nearing 0 ℃.
6.
Piezocone penetration testing (CPTU)
6.1. CPTU testing at UNIS East
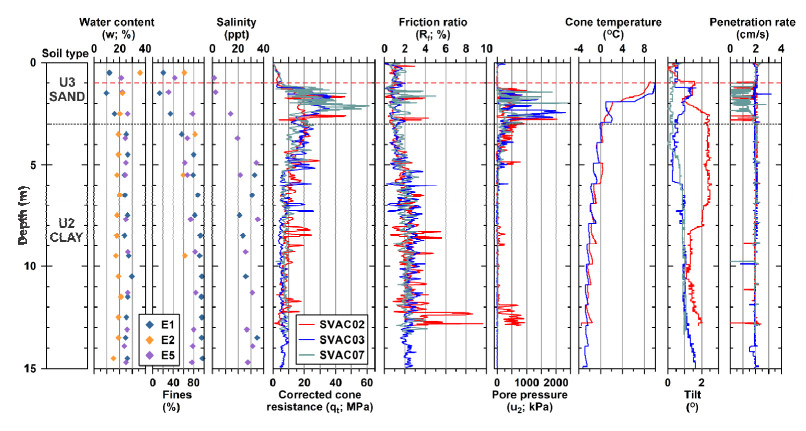
CPTU soundings were conducted to get a better understanding of the performance of this method in the frozen and unfrozen permafrost soils in Svalbard. The corrected cone resistance (qt), friction ratio (Rf), penetration pore pressure (u2), cone temperature, tilt, and rate of penetration data from CPTU trials at the UNIS East site are presented in Figure 11. The variations in these parameters permit the identification of three stratigraphic zones: the unfrozen active layer, frozen sands and gravels, and unfrozen, saline clays.
As testing was conducted in late August, the active layer was clearly identifiable in the CPTU data. In this layer, extending from the terrain surface to 1 m depth, corrected cone resistance values were less than 6 MPa and penetration pore pressure values were near to zero. An abrupt increase in the corrected cone resistance values was observed upon encountering the top of permafrost. This interval of frozen sands and gravels (Unit U3) extended from 1 m to ca. 3 m depth and was characterized by corrected cone resistance values of between 10 MPa and 60 MPa. The rate of penetration was intentionally kept lower through this zone to keep the testing parameters within the recommended limits, so as not to damage the instrumentation. Once testing reached the unfrozen, saline soils of Unit U2, it was possible to maintain a standard penetration rate of 20 mm s-1. Corrected cone resistance values typically ranged between 5 MPa and 20 MPa, with peaks as high as 30 MPa.
Penetration pore pressure values were low, ranging between 0 kPa and 200 kPa. Exceptions were noted in the near surface (1 m to 3 m), where values reached up to 2500 kPa. High values in this interval likely relate to frictional heating and melting of ice in the soil pores during penetration. The cone temperature sensor recorded values above 0 ℃ for this interval. An alternative interpretation could be that the penetration pore pressure sensor was responding to lenses of segregated ice however the water content data and visual inspection of the core samples do not support this. The test SVAC02 additionally records periodic increases in penetration pore pressure values, up to ca. 1000 kPa, at depths between 5 m and 15 m. In this case the increased values can possibly be explained by the presence of cryopegs (c.f. [23]).
6.2. CPTU in Arctic site investigations
The application of CPTU in Svalbard appears to be most useful in saline soils near to their freezing point. We believe it would not have been possible to conduct such extensive testing in solid frozen soils with this equipment. Existing soil behavioral classification frameworks are not optimized for CPTU data from permafrost soils. Work to develop a classification structure for frozen and plastic frozen soils is ongoing and at this stage we are only reporting on the application of CPTU in identifying soil stratigraphy at the UNIS East site. Measured parameters during CPTU allow the distinction between frozen and unfrozen layers. Penetration pore pressure records will likely permit the identification of ice-rich zones and cryopegs in the soil stratigraphy. The temperature sensor in the cone provides valuable information about the ground thermal regime and the quality of test data. Given the strong effect of temperature on frozen soil behavior, future tests should be paused at specified intervals to allow the cone temperature to equilibrate with the surrounding soil.
7.
Supplementary investigations and future use
Characterization of the NGTS project permafrost sites is ongoing. Forthcoming supplementary investigations will include: (1) uniaxial compression test programme to determine creep parameters for the soils, (2) triaxial compression testing to evaluate soil creep and strength, (3) pore pressure measurements in cryopegs and saline clays, (4) development of CPTU in saline soils, and (5) geophysical investigations to upscale borehole data and identify ground ice bodies such as wedge ice.
The focus of the NGTS project at these sites is to establish a geothermal monitoring system for three-dimensional modelling of the geothermal regime and soil strata and to investigate geotechnical index properties. The sites are well suited for future research including that related to:
● full-scale field testing of road embankments and foundation technology in saline permafrost soils,
● river erosion protection and river crossings,
● artificial cooling systems, and
● development and testing of new geotechnical equipment for site investigations in frozen soils.
8.
Summary
This paper has presented an overview of activities and soil characterization of the NGTS permafrost sites in Svalbard. The current investigation is summarized by the following points:
● Field investigations have utilized drilling, CPTU, and ground temperature monitoring in the upper 30 m of the soil stratigraphy. 400 m of samples were retrieved, some of which have been utilized in laboratory testing.
● Soil stratigraphy at the Adventdalen site consists of sandy clayey silt (0-3 m; D3), underlain by silty sand (3-16 m; D2) and clay or silty clay (16-30 m; D1). The top 2-3 m of permafrost are enriched with segregated ice lenses. Stratigraphy at the UNIS East site consists of gravely silty sand (0 m to 3 m; U3), underlain by silty clay (U2), overlaying diamicton (U1). A pronounced ice-rich zone is not identified in the near-surface coarse-grained soil at the UNIS East site.
● Saline permafrost is identified at both sites. Pore water salinity ranges from 1.0 ppt to 79 ppt. The soil freezing point ranges between -0.1 ℃ and -5.1 ℃. In many cases this is within 1 ℃ to 2 ℃ of the ambient ground temperatures.
● Standard rate CPTU was conducted to assess the application of the method for site investigations in Svalbard. These trials indicate that CPTU with a cone temperature sensor is an effective field investigation method for saline soils in Svalbard, providing valuable information about permafrost conditions. Preliminary analysis of CPTU results has permitted the identification of stratigraphic zones including: the active layer, frozen sands and gravels, and unfrozen or plastic frozen clays.
● From a geotechnical perspective, pore water salinity decreases the strength and increases the deformation susceptibility of permafrost and foundations in the investigated soil types. Earlier studies noted frozen saline soils are characterized by continuous long-term deformation. Saline soils at the NGTS permafrost sites provide an excellent opportunity to instrument and monitor installations over prolonged periods of time.
Acknowledgments
The authors wish to thank The Research Council of Norway for the infrastructure grant (Grant No. 245650/F50) to establish the Norwegian GeoTest Sites project. We are grateful to Pagani Geotechnical for providing access to the TG63-150 test rig and training.
Conflict of interest
All authors declare no conflicts of interest in this paper.


 DownLoad: