Loading [Contrib]/a11y/accessibility-menu.js
Research article Special Issues

Development of low temperature technology for the growth of wide band gap semiconductor nanowires

  • Received: 26 February 2016 Accepted: 06 April 2016 Published: 08 April 2016
  • In2Ge2O7, Ge3N4, In2O3 and germanium nanowires were synthesized by the developed hydrazine (N2H4)-based technology. Annealing of germanium or Ge+In sources in the vapor of N2H4+3 mol.% H2O caused the formation of volatile GeO and In2O molecules in the hot zone. These molecules were transferred to the Si substrate, which was placed in the could zone of a reactor. After interacting with hydrazine decomposition products (NH3, NH2, NH, H2, H) and water, Ge3N4 nanowires and nanobelts were produced on the Ge source in the temperature range of 500–520 ºC. The growth temperature of Ge3N4 nanowires in hydrazine vapor was by 350 ºC lower than the temperature reported in the literature. Using In+Ge source the tapered In2O3 nanowires were formed on the Si substrate at 400 ºC. At 420–440 ºC the mixture of In2O3 and Ge nanowires were synthesized, while at 450 ºC In2Ge2O7 nanowires were produced, with InN nanocrystals growing on their stems. The possible chemical reactions for the synthesis of these nanostructures were evaluated. The growth temperatures of both, In2Ge2O7 and InN nanostructures were by 50–150 ºC lower than that, reported in the literature. The results of this work clearly demonstrate the ability of hydrazine vapor to reduce the growth temperature of nitride and oxide nanomaterials.

    Citation: David Jishiashvili, Zeinab Shiolashvili, Archil Chirakadze, Alexander Jishiashvili, Nino Makhatadze, Kakha Gorgadze. Development of low temperature technology for the growth of wide band gap semiconductor nanowires[J]. AIMS Materials Science, 2016, 3(2): 470-485. doi: 10.3934/matersci.2016.2.470

    Related Papers:

    [1] Anne W Taylor, Zumin Shi, Eleonora Dal Grande, Creina Stockley . The Relationship between Alcohol Consumption and other Risk Factors Assessed Using An Ongoing Population-based Surveillance System. AIMS Public Health, 2016, 3(4): 985-1002. doi: 10.3934/publichealth.2016.4.985
    [2] Eduardo Sánchez-Sánchez, Nuria Trujillo-Garrido, Jara Díaz-Jimenez, Alejandro García-García, Miguel A Rosety, Manuel Bandez, Manuel Rosety-Rodriguez, Francisco J Ordonez, Ignacio Rosety, Antonio J Diaz . Attitudes and consumption habits of energy drinks among adolescents and young adults in a Spanish population. AIMS Public Health, 2025, 12(1): 16-32. doi: 10.3934/publichealth.2025002
    [3] Jorge de Andrés-Sánchez, Francesc Valls-Fonayet, Anna Sánchez-Aragón, Inma Pastor-Gosálbez, Angel Belzunegui-Eraso . Explanatory factors of polydrug use in mid-late teens and the relevance of information sources: Correlational and configurational assessment in Tarragona (Spain). AIMS Public Health, 2024, 11(3): 773-802. doi: 10.3934/publichealth.2024039
    [4] Kassidy C Colton, Stephanie A Godleski, Joseph S Baschnagel, Rebecca J Houston, Shine M DeHarder . Alcohol use during the COVID-19 pandemic: gender, parenthood, intimate partner violence, and stress. AIMS Public Health, 2023, 10(2): 360-377. doi: 10.3934/publichealth.2023027
    [5] Duong Minh Duc, Le Thi Vui, Hoang Ngoc Son, Hoang Van Minh . Smoking Initiation and Cessation among Youths in Vietnam: A Longitudinal Study Using the Chi Linh Demographic—Epidemiological Surveillance System (CHILILAB DESS). AIMS Public Health, 2017, 4(1): 1-18. doi: 10.3934/publichealth.2017.1.1
    [6] Behrad Pourmohammadi, Moahammad Ali Jalilvand . Prevalence of alcohol consumption and related factors among students of higher education centers in one of the northeastern cities of Iran. AIMS Public Health, 2019, 6(4): 523-533. doi: 10.3934/publichealth.2019.4.523
    [7] David Adzrago, Ikponmwosa Osaghae, Nnenna Ananaba, Sylvia Ayieko, Pierre Fwelo, Nnabuchi Anikpezie, Donna Cherry . Examining differences in suicidality between and within mental health disorders and sexual identity among adults in the United States. AIMS Public Health, 2021, 8(4): 636-654. doi: 10.3934/publichealth.2021051
    [8] Danny Mungai, Ronnie Midigo . Social and cultural determinants of health; understanding the persisting Alcohol Use Disorder (AUD) in the rural populations in central Kenya. AIMS Public Health, 2019, 6(4): 600-611. doi: 10.3934/publichealth.2019.4.600
    [9] Linna Tam-Seto, Patricia Weir, Shilpa Dogra . Factors Influencing Sedentary Behaviour in Older Adults: An Ecological Approach. AIMS Public Health, 2016, 3(3): 555-572. doi: 10.3934/publichealth.2016.3.555
    [10] Margo Barr, Raymond Ferguson, Jason van Ritten, Phil Hughes, David Steel . Summary of the Impact of the Inclusion of Mobile Phone Numbers into the NSW Population Health Survey in 2012. AIMS Public Health, 2015, 2(2): 210-217. doi: 10.3934/publichealth.2015.2.210
  • In2Ge2O7, Ge3N4, In2O3 and germanium nanowires were synthesized by the developed hydrazine (N2H4)-based technology. Annealing of germanium or Ge+In sources in the vapor of N2H4+3 mol.% H2O caused the formation of volatile GeO and In2O molecules in the hot zone. These molecules were transferred to the Si substrate, which was placed in the could zone of a reactor. After interacting with hydrazine decomposition products (NH3, NH2, NH, H2, H) and water, Ge3N4 nanowires and nanobelts were produced on the Ge source in the temperature range of 500–520 ºC. The growth temperature of Ge3N4 nanowires in hydrazine vapor was by 350 ºC lower than the temperature reported in the literature. Using In+Ge source the tapered In2O3 nanowires were formed on the Si substrate at 400 ºC. At 420–440 ºC the mixture of In2O3 and Ge nanowires were synthesized, while at 450 ºC In2Ge2O7 nanowires were produced, with InN nanocrystals growing on their stems. The possible chemical reactions for the synthesis of these nanostructures were evaluated. The growth temperatures of both, In2Ge2O7 and InN nanostructures were by 50–150 ºC lower than that, reported in the literature. The results of this work clearly demonstrate the ability of hydrazine vapor to reduce the growth temperature of nitride and oxide nanomaterials.


    In understanding lifelong patterns of alcohol consumption, the early formative period of late adolescent and early adulthood, commonly acknowledged as “transition to adulthood” is seen as a crucial period of life development [1][4]. The behaviours and patterns associated with alcohol consumption initiated during these years are important indicators for later stages of the lifespan [2],[3]. Negative social and health outcomes associated with excess alcohol consumption in these formative years include increased road accidents, violence, injuries and ramifications associated with unplanned sex. There are also the possibility of long-term alcohol problems and dependency [3].

    Many transformations, encompassing most components of life including academic, accommodation, relationships, and work/career options, occur during the transition to adulthood [3],[5]. Multi-factorial and complex beliefs, attitudes and motivations towards alcohol are also being developed. Identifying the motivating factors that influence people to drink, limit or abstain helps to understand alcohol consumption patterns during these formative years [6][9]. Although simplistic explanations have been highlighted, the motivations for drinking and not drinking alcohol are multifaceted. Complex interactional and situational factors have been presented in the research literature [10],[11]. Motivating factors for alcohol consumption primarily focus on aspects such as social influences, coping with stress, enhancement and conformity [6],[8],[12]. Motives for not consuming or limiting alcohol focus on harm avoidance, religion, upbringing, personal beliefs, fear of loss of control, and fear of adverse consequences [9][11],[13],[14]. Research highlights the important role social motives play in all facets of alcohol consumption from abstaining to heavy episodic drinking (HED), especially in the transition to adulthood age bracket of 18 to 34 years [6],[8],[12],[15][17]. Although negative outcomes associated with alcohol consumption are researched extensively, research into reasons and motives for abstaining or limiting alcohol consumption are less common.

    Attitudes and beliefs have been shown to be important predictors of alcohol consumption especially in this age group [18] and are seen as important areas for promotion and public health campaigns. In most instances positive attitudes and beliefs towards alcohol are reflected in higher alcohol consumption. Alcohol outcome expectations are acknowledged as important predictors of alcohol consumption, especially in this age group, with more positive attitudes also related to higher alcohol consumption [12],[19],[20].

    Together with motives and attitudes, socio-demographic and socio-economic variables are important indicators associated with drinking and alcohol consumption patterns [2],[21][26]. Age (alcohol consumption declining with age), gender (males drinking more alcohol than females), education (with differences by education level), work status (differences by employment status), and relationship status (with marriage/partnership and parenthood often reducing alcohol consumption rates), have been shown to be associated with patterns of alcohol consumption for those transitioning into adulthood.

    The aim of this study was to use a methodologically-sound database of face-to-face interviews with randomly selected people aged 18 to 34 years in four cities in four different continents to determine similarities and differences in factors associated with alcohol consumption;. In addition, the study aimed to highlight variables amenable to policy, preventive and control initiates by defining distinct sub-groups of people in terms of alcohol consumption patterns and to assess and identify similarities and differences across these international cities that will assist future public health endeavors internationally and locally. Many studies of attitudes towards, and motives for and against, alcohol consumption rely on information from current drinkers only [15],[27],[28]. This study incorporates these groups but also includes non-drinker—those who have never drunk alcohol or who have quit/ceased drinking. Furthermore, many studies of adolescents and emerging adults in this regard are limited to university or college populations and are often based on USA populations [27],[29],[30]. This study uses unique, international, community, population-wide samples, representative of adolescents and young adults aged 18 to 34 years, in the four international cities. To undertake this comparison, and to determine in greater depth the alcohol consumption patterns in the four cities, cluster and factor analysis were undertaken segmenting the population into groups that are homogeneous as possible. Factor and cluster analysis in alcohol consumption provides additional in-depth reflections on pathways to effective public health prevention and control activities.

    Four cities were chosen pragmatically based on diversity to be involved in the study. The city of Wuhan, capital of Hubei Province in China; Moscow, the capital and the largest city of Russia; Ilorin which is the administrative capital of Kwara State, Nigeria; and Montevideo, the capital of Uruguay. For each city, multistage random sampling was undertaken and was kept consistent across the four cities. In each randomly selected household, the person with the most recent birthday, aged between 18 and 34 years, and who had lived in the city for at least six months, was eligible and was invited to participate in the study.

    In Wuhan, ethical approval was obtained from the Hubei Provincial CDC (Hubei Provincial Society for Health Promotion and Cigarette-smoking Control, HBPHPandCCS-2014-01), in Moscow from the Ethics Committee on the NRC on Addictions, in Ilorin from the Ethics Research Committee of the University of Ilorin (UERC/ASN/2014/007) and in Montevideo from the Pro Humanities Ethics Committee.

    The questionnaire was forward-translated into the relevant languages (e.g. English to Chinese) and back-translated (e.g. Chinese to English) to ensure the questions were conceptually and culturally equivalent between the cities. Prior to the main survey, a pilot study of 25 to 50 interviews was conducted in each city. Data collection was interviewer-administered. The average length of interviews was 15 minutes. Response rates ranged from 48.4% in Moscow to 95.0% in Ilorin. The detailed methodology and demographic profile of respondents has previously been published [31].

    Each respondent was asked: 1) if they had ever consumed alcohol (excluding sips), 2) how often during the past 12 months they had drunk beer, wine, spirits (e.g., vodka, gin, whisky, brandy), and any other alcohol beverage, even in small amounts, and 3) during the past 12 months, how many alcoholic drinks they had on a typical day when they drank alcohol.

    Overall quantity (i.e. usual frequency of drinking by usual number of drinks consumed per drinking occasion) was calculated by multiplying the responses to the above two questions (how much and how many) with 25 or more drinks (coded as 25), 19–24 drinks (coded as 21.5), 16–18 drinks (coded as 17), 12–15 drinks (coded as 13.5), 9–11 drinks (coded as 10), 7–8 drinks (coded as 7.5), 5–6 drinks (coded as 5.5), 3–4 drinks (coded as 3.5), 2 drinks (coded as 2), 1 drink (coded as 1) and less than 1 full drink (coded as 0.5). The annual number of drinks was calculated by multiplying the responses to the question on how many days did they drink alcohol with the response from how many drinks did they have. The variables were recoded into four drinking status groups: 0 drinks = Abstainers; > 0 but less than 365 drinks/year = Light Drinkers; 365–729 drinks/year = Moderate Drinkers; 730 or more drinks/year = Heavier drinkers.

    Motivation against drinking alcohol included a question on how important the following reasons were: 1) pregnancy or trying to become pregnant (females only), 2) of taste, 3) don't like the effect it has, 4) have seen bad examples of what alcohol can do, 5) previously hurt by somebody's else drinking, 6) drinking could affect work or school performance, 7) drinking is too expensive or a waste of money, 8) religious reasons, 9) brought up not to drink, 10) had an alcohol problem or afraid of becoming an alcohol, 11) too young, 12) friends and/or family members disapprove, 13) health reasons, and 14) just not interested. Possible responses were very important, important, not very important, and not at all important. The questionnaire asked these attitude questions of current drinkers, and non-drinkers (both past drinkers and lifetime abstainers) as separate questions. The two questions were combined to make one data item for each alternative. Option 1 was asked only of females and was excluded.

    General attitude to alcohol use included whether respondents agreed that 1) having a drink is one of the pleasures of life, 2) having a drink with someone is a way of being friendly, 3) there is nothing good to be said about drinking. Response categories were strongly agree, agree, neither agree nor disagree, disagree, and strongly disagree.

    Respondents were also asked how many drinks people in certain situations should feel free to drink 1) as a mother, spending time with small children, 2) as a father, spending time with small children, 3) for a man out at a bar with fiends, 4) for a woman out at a bar with friends, 5) for a woman out with co-workers, 6) for a man out with co-workers, 7) for a man having dinner at home with spouse or partner, and 8) for a woman having dinner at home with spouse or partner. Responses options were: no drinks, some drinking but not enough to feel the effects (1 or 2 drinks), enough to feel the effects but not become drunk, getting drunk is sometimes alright, and getting drunk is always alright.

    Demographic questions included age, sex, marital status (recoded into married/not married), highest education obtained (secondary school or less/vocational, professional, non-university/university), employment status (employed/not employed), have any children (yes/no), and currently a student (yes/no).

    To eliminate/reduce potential biases and to ensure that the results accurately reflected the population of interest, the data were weighted by age, sex and probability of selection. Specific demographic/census databases were used for each city. Details on specific weighting methodology are contained in a previous publication [31]. Data were analysed using Statistical Package for the Social Sciences (SPSS) version 20 for Windows (Chicago, IL).

    As data on many individual motivational and attitudinal variables were collected, factor analysis was initially used to identify sets of variables for each city that were highly correlated and to simplify the analysis. Cluster analysis was then used to identify clusters and heterogeneity of groups of individuals.

    Since this analysis is purely exploratory, there was no need to randomly divide the sample into two halves in order to confirm the factor structure derived from one half of the dataset on the other half. For each city, an exploratory factor analysis (EFA) was conducted. All of the above data items were entered into the analysis. Details on specific analysis for each city are detailed below. The factor scores from the analysis for each city were saved, and used as an input into a cluster analysis, along with a derived variable regarding the drinking status of the respondent. Also included in the cluster analysis were the demographic data detailed previously. Hierarchical agglomerative clustering was employed using the squared Euclidean distance measure and Ward's method to form the clusters.

    In total, n=6235 interviews were undertaken (1391 in Ilorin, 1600 in Montevideo, 1604 in Moscow and 1640 in Wuhan). Missing and “don't know” responses were excluded from all analyses, with the final numbers included being 1144 for Ilorin, 981 for Montevideo, 1526 for Moscow, and 1150 for Wuhan. A demographic profile of respondents for each city is presented in Supplementary The proportion having ever consumed alcohol was 33.3% (95% CI 30.9–35.9) of respondents from Ilorin, 53.4% (95% CI 51.0–55.8) for Wuhan, 86.1% (95% CI 84.3–87.7) for Moscow, and 96.4% (95% CI 95.3–97.2) for Montevideo (Table 1).

    Various extraction and rotation options were tried, with the best solution being produced by principal components extraction with an oblique rotation. When all of the items were entered into an EFA, the questions regarding general attitudes and situations formed their own factors and did not add anything to the understanding of the data. When these were removed, and the EFA considered only motivations against drinking, two factors emerged. The first factor was a motivation because of intrinsic factors (e.g. dislike for the effects of alcohol). The second factor related to motivation because of extrinsic pressures (e.g. social pressure against drinking) (Supplementary Table 2).

    The approach to this analysis was the same as the analysis previously described for Ilorin. The final EFA considered only motivations against drinking where two factors emerged. The first factor was motivation by intrinsic personal pressures (e.g. about social pressure against drinking). The second factor was motivated by fear of effects (e.g. a dislike for the effects of alcohol) (Supplementary Table 3).

    When all items were entered into an EFA using maximum likelihood extraction and oblimin rotation (oblique rotation allowing for correlated factors), the questions regarding general attitudes, perceptions of situations, and motivations against drinking formed their own individual factors. Although this seems like an obvious result, it did not occur in the two previous factor analyses. The first factor was perceptions of drinking limits in different situations (e.g. for a woman out at a bar with friends), the second factor was motivation by fear (e.g. have been hurt by someone else's drinking), and the third factor was positive justification/perception of drinking (e.g. drinking is one of the pleasures of life) (Supplementary Table 4).

    When all items were entered into an EFA, principal axis factoring produced the best extraction results, which combined with oblimin rotation produced a two factor solution where the questions regarding motivations against drinking and general attitudes/perceptions of situations formed factors. The first factor was motivation by both intrinsic and extrinsic pressures against drinking (e.g. I have had alcohol problems/are afraid of being an alcohol; my friends and/or family disapprove of me drinking). The second factor was perceptions of drinking limits in different situations (e.g. for a woman having dinner at home with her spouse or partner) and a positive justification/attitude towards drinking (e.g. having a drink with someone is a way of being friendly) (Supplementary Table 5).

    When cluster analysis was undertaken, the dendogram and the agglomeration schedule both supported a three cluster solution encompassing 26.6%, 33.3% and 40.0% of the sample. Those clusters are detailed in Table 1. Members of Cluster 1 were more likely to be abstainers, former drinkers, older, university educated, married, employed females with children. Members of Cluster 2 were more likely to be younger than Cluster 1 and older then Cluster 3 members, unmarried with no children, who were current drinkers or HEDs. Members of Cluster 3 were all students, more likely to be young, who do not drink, are unmarried and do not have children. They were students, and they were therefore also less likely to be working. Differences by intrinsic and extrinsic pressures were apparent across the Clusters.

    The dendogram and the agglomeration schedule both supported a five cluster solution encompassing 15.5%, 14.3%, 36.3%, 22.7% and 11.2% of the sample. These clusters are detailed in Table 2. Cluster 1 were more likely to be current alcohol drinkers or HED, younger than the other Clusters, unmarried, not employed with no children. Cluster 2 were more likely to be current drinkers, university educated, employed, females without children, and also more likely to be students. Cluster 3 were more likely to be older than the other Clusters, married, employed with children and are current drinkers or HEDs, with a lower level of education than average. They were also less likely to be students. Cluster 4 are more likely to be employed, males with no children who are HEDs. Cluster 5 were more likely to be abstainers or past drinkers with 94.7% of this cluster not drinking, and those that did were light drinkers. They were more likely to have a low level of education. Differences by intrinsic and extrinsic pressures and fears of the effects of alcohol were apparent across the Clusters.

    A four cluster solution was indicated by the dendogram and agglomeration schedule encompassing 23.0%, 25.2%, 36.1% and 15.6% of the sample in this case. The clusters are detailed in Table 3. Cluster 1 were more likely to be older, current drinkers or HEDs, married with children, employed, and well educated. Cluster 2 members were younger than other Clusters, unmarried, less likely to have children, less likely to be employed, or have a degree qualification. They were more likely to be lifetime abstainers although all drinker types were represented in this group. Cluster 3 were more likely to be employed, well educated, unmarried with no children who were current drinkers or HEDs. Cluster 4 are more likely to be females and less likely to be students. They were abstainers or former drinkers. Differences in perception of acceptable drinking limits, justification for drinking and motivation against drinking were apparent across the Clusters.

    Hierarchical agglomerative clustering was employed using the squared Euclidean distance measure and Ward's method to form the clusters. This analysis did not result in clusters that discriminated drinking behaviour or attitudes. A number of different alternative extraction methods and factor solutions were tried, including reducing the factor analysis to just motivations against drinking as in Ilorin and Montevideo, but all suffered from the same problem. Eventually marital status, education status and number of children were omitted and a four cluster solution of acceptable quality was produced. The four cluster solution encompassed 36.3%, 33.2%, 21.6% and 8.8% of the sample. The clusters are detailed in Table 4. Cluster 1 were current drinkers who were employed, highly educated, and not likely to be a student. Cluster 2 were mostly non-drinkers (lifetime abstainers and former drinkers), more likely to be employed, not likely to be a student with high levels of education. Cluster 3 reflected a variety of levels of alcohol consumption patterns with the majority being current drinkers or lifetime abstainers. They were also more likely not to be married, not employed (100% students) and less likely to have children. Cluster 4 were a mixture of current drinkers and lifetime abstainers who were more likely to be not employed, non-university educated and not students. Differences in motivation against drinking and acceptable levels of drinking were apparent especially in Cluster 2.

    The results of this analysis from a random-population survey of 18 to 34 year olds in four distinct cities of the world highlighted the complexity associated with determining patterns of alcohol consumption in this important age group. Although results varied considerably across all four cities, some similarities between the cities in terms of alcohol consumption were apparent.

    Two of the three clusters for Ilorin were dominated by alcohol abstainers. This reflects the relatively low overall prevalence rates of alcohol consumption in Nigeria [32][35], although among those who do drink alcohol, large amounts are regularly consumed [34][37]. The abstainer cluster, predominately students, consisted of younger people whose extrinsic motivations against drinking was dominated by religious reasons or because they were brought up not to drink alcohol. Internationally, religion and the influence of upbringing have been shown to have important considerations for abstainers and low alcohol drinkers [11],[14],[23],[30]. In Nigeria, the practice of Muslim religion is widespread [14],[32],[36] and our previous research indicated that the Muslim respondents were significantly less likely to be current drinkers [31]. In all four cities at least one of the final clusters was predominately abstainers and ex-drinkers, but religion as a motive for not consuming alcohol was only prominent in Ilorin. Internationally religious convictions have been shown to be stronger in females [12] although in our analyses the Ilorin cluster that rated religion high was not dominated by females.

    Table 1.  Results of cluster analysis for Ilorin-Nigeria.
    Cluster 1 (n=261, 26.6%) Cluster 2 (n=327, 33.3%) Cluster 3 (n=392, 40.0%) Total
    (Abstaining females) (Heavy drinkers) (Abstaining young students) n=980
    Ilorin, Nigeria n % AR n % AR n % AR N % X2 Df P value
    Drinking status
    Lifetime abstainer 155 59.4 1.5 153 46.8 −3.8 235 59.9 2.3 543 55.4 24.336 6 <0.001
    Former drinker 41 15.7 −0.7 70 21.4 2.6 56 14.3 −1.9 167 17.0
    Current drinker 53 20.3 −1.4 82 25.1 0.9 94 24.0 0.4 229 23.4
    Heavy episodic drinker 12 4.6 0.4 22 6.7 2.8 7 1.8 −3.1 41 4.2
    Age (mean years) 30.05 24.74 22.29
    Gender
    Male 68 26.1 −8.3 195 59.6 5.1 209 53.3 2.6 472 48.2 72.503 2 <0.001
    Marital Status
    Married 259 99.2 30.3 10 3.1 −12.1 1 0.3 −15.6 270 27.5 917.453 2 <0.001
    Employment Status
    Employed 199 76.0 12.7 166 50.8 3.6 55 14.0 −14.9 420 42.8 258.616 2 <0.001
    Highest level of education
    Secondary school or less 152 58.2 −0.1 215 65.7 3.2 207 52.8 −3 574 58.6 162.965 4 <0.001
    Vocational/professional/Non–university tertiary education 37 14.2 −5.4 50 15.3 −5.8 177 45.2 10.5 264 26.9
    University degree or higher 72 27.6 7 62 19.0 2.8 8 2.0 −9 142 14.5
    Children?
    Yes 248 95.0 25.9 40 12.2 −9.1 20 5.1 −14.5 308 31.4 672.53 2 <0.001
    Student?
    Yes 3 1.1 −15.3 6 1.8 −17.6 392 100.0 30.7 401 40.9 943.37 2 <0.001
    Factor 1 – Intrinsic pressures (mean) a 0.34↓ 0.06 0.02
    Factor 2 – Extrinsic pressures (mean) 0.26 0.34 −0.09↑

    Note: The weighting of the data can lead to rounding discrepancies and totals not adding. (a) Uses Harmonic Mean Sample Size= 318.013; the group sizes are unequal. The harmonic mean of the group sizes is used; Type I error levels are not guaranteed. ↓ Less important ↑ More important.

     | Show Table
    DownLoad: CSV
    Table 2.  Results of cluster analysis for Montevideo-Uruguay.
    Cluster 1 Cluster 2 Cluster 3 Cluster 4 Cluster 5
    (n=237, 15.5%) (n=217, 14.3%) (n= 554, 36.3%) (n=347, 22.7%) (n=170, 11.2%) Total
    (Young drinkers) (Student drinkers) (Older married HED) (Male HED) (Abstainers) (n = 1525)
    n % AR n % AR n % AR n % AR n % AR n % X2 Df P value
    Drinking status
    Lifetime abstainer 0 0.0 −2.8 0 0.0 −2.7 2 0.4 −4.3 0 0.0 −3.6 40 23.5 17.6 42 2.8 1400.6 16 <0.001#
    Former drinker 0 0.0 −5.1 4 1.8 −3.8 3 0.5 −8.4 1 0.3 −6.2 121 71.2 31.2 129 8.5
    Very light drinker 7 3.0 0 5 2.3 −0.6 17 3.1 0.2 7 2.0 −1.2 9 5.3 1.9 45 3.0
    Current drinker 165 69.6 1.2 187 86.2 6.7 422 76.2 6.3 234 67.4 0.6 0 0.0 −19 1008 66.1
    Heavy episodic drinker 65 27.4 3.2 21 9.7 −4 110 19.9 0.1 105 30.3 5.6 0 0.0 −6.9 301 19.7
    Age (mean years) 21.64 25.60 28.12 25.41 25.55
    Gender
    Male 110 46.2 −1.1 3 1.4 −15.3 243 43.9 −3.3 330 95.1 19.3 69 40.6 −2.5 755 49.5 503.12 4 <0.001
    Marital Status
    Married 7 3.0 −15.0 104 47.7 0 420 75.8 16.6 103 29.7 −7.6 93 54.7 2.0 727 47.6 414.26 4
    Employment
    Employed 0 0.0 −24.7 196 90.3 7.5 404 72.9 2.8 341 98.6 13.7 102 60.0 −2.5 1043 68.4 718.08 4
    Highest level of education
    Secondary school or less 122 51.5 −2.1 56 25.7 −10.3 398 71.8 8.5 184 53.2 −1.9 118 69.0 3.2 878 57.5 243.48 8 <0.001
    Vocational/prof/Non–uni 102 43.0 3.4 94 43.1 3.2 130 23.5 −6.3 138 39.9 2.8 48 28.1 −1.6 512 33.6
    University degree 13 5.5 −2 68 31.2 12.5 26 4.7 −4.4 24 6.9 −1.5 5 2.9 −2.9 136 8.9
    Children?
    Yes 21 8.9 −11.5 36 16.5 −8.5 487 87.9 26.8 0 0.0 −18.4 111 65.3 6.3 655 42.9 927.55 4 <0.001
    Student?
    Yes 158 66.7 11.1 171 78.4 14.5 27 4.9 −18.7 136 39.2 1.8 43 25.3 −2.8 535 35.1 515.63 4 <0.001
    Factor 1–Intrinsic pressure (mean) a −0.03 0.13 0.18 −0.02 −0.37↑
    Factor 2–Fear of effects (mean) 0.11 −0.24↑ 0.07 0.14 −0.29↑

    Note: The weighting of the data can lead to rounding discrepancies and totals not adding. (a) Uses Harmonic Mean Sample Size =257.986; the group sizes are unequal. The harmonic mean of the group sizes is used; Type I error levels are not guaranteed. # 1 cell < 5. ↓ Less important ↑ More important.

     | Show Table
    DownLoad: CSV
    Table 3.  Results of cluster analysis for Moscow-Russia.
    Cluster 1 Cluster 2 Cluster 3 Cluster 4 Total (n= 1066)
    (n=245, 23.0%) (n=269, 25.2%) (n=385, 36.1%) (n=167, 15.6%)
    (Older drinkers) (Students) (Current drinkers) (Abstainers, females)
    n % AR n % AR n % AR N % AR n % X2 Df P value
    Drinking status
    Lifetime abstainer 0 0.0 −6.2 64 23.8 7.9 0 0.0 −8.6 52 31.3 9.2 116 10.9 528.728 12 <0.001 Cells < 5.
    Former drinker 1 0.4 −5.4 21 7.8 −0.9 5 1.3 −6.7 71 42.8 16.3 98 9.2
    Very light drinker 0 0.0 −0.5 1 0.4 1.7 0 0.0 −0.8 0 0.0 −0.4 1 0.1
    Current drinker 2128 86.5 6.0 173 64.3 −2.9 334 86.8 8.4 40 24.1 −14.6 759 71.3
    Heavy episodic drinker 32 13.1 2.9 10 3.7 −3.3 46 11.9 3.0 3 1.8 −3.4 91 8.5
    Age (mean years) 30.94 20.61 26.54 28.65
    Gender
    Male 132 53.9 1.3 131 48.7 0.3 205 53.2 3.3 43 25.7 −6.2 511 47.9 40.820 3 <0.001
    Marital Status
    Married 207 84.5 16.4 11 4.1 −13.7 85 22.1 −8.7 118 70.7 9.0 421 39.5 465.430 3 <0.001
    Employment
    Employed 244 99.6 11.0 57 21.2 −21.4 370 96.1 13.2 95 57.2 −4.6 766 71.9 564.995 3 <0.001
    Highest level of education
    Secondary school or less 11 4.5 −5.4 103 38.4 12.1 27 7.0 −5.7 23 13.9 −0.6 164 15.4 269.003 6 <0.001
    Vocational/prof/Non–uni 105 42.9 −0.3 155 57.8 5.4 143 37.1 −1.8 62 37.3 −1.8 435 40.9
    University degree or higher 129 52.7 4.3 10 3.7 −14.3 215 55.8 7.5 81 48.8 2.3 435 40.9
    Children?
    Yes 245 99.6 25.3 7 2.6 −12.3 3 0.8 −16.8 97 58.4 7.6 352 33.0 834.912 3 <0.001
    Student?
    Yes 1 0.4 −10.5 269 100.0 31.7 0 0.0 −14.7 11 6.6 −6.3 281 26.4 1007.935 3 <0.001
    Factor 1 – Situations (mean) a 0.28↑ −0.07 0.33↑ −0.58↓
    Factor 2 – Motivation by fear (mean) 0.17↓ −0.19↑ 0.20↓ −0.31↑
    Factor 3 – Positive justification (mean) −0.37↑ 0.18 −0.45 0.63↓

    Note: The weighting of the data can lead to rounding discrepancies and totals not adding; (a) Uses Harmonic Mean Sample Size = 243.870; the group sizes are unequal. The harmonic mean of the group sizes is used; Type I error levels are not guaranteed. ↓ Less important ↑ More important.

     | Show Table
    DownLoad: CSV
    Table 4.  Cluster analysis for Wuhan-China.
    Cluster 1 Cluster 2 Cluster 3 Cluster 4
    (n=412, 36.3%) (n=376, 33.2%) (n=245, 21.6%) (n=100, 8.8%) Total
    (Drinkers) (Abstainers) (Abstainers/former) (Unemployed) (n = 1133)
    n % AR n % AR n % AR n % AR n % X2 Df P value
    Drinking status
    Lifetime abstainer 36 8.8 −17.6 324 85.9 20.6 84 34.1 −3.2 45 44.6 0.3 489 43.1 667.791 12 <0.001
    Former drinker 5 1.2 −5.9 48 12.7 5.1 25 10.2 2.0 4 4.0 −1.3 82 7.2
    Very light drinker 10 2.4 −0.7 4 1.1 −2.6 18 7.3 4.7 1 1.0 −1.2 33 2.9
    Current drinker 321 78.1 18.2 1 0.3 −20.3 113 45.9 1.2 48 47.5 1.1 483 42.6
    Heavy episodic drinker 39 9.5 6.6 0 0.0 −5.0 6 2.4 −1.6 3 3.0 −0.7 48 4.2
    Age (mean years) 26.13 26.30 20.41 26.67
    Gender
    Male 247 60.0 4.5 185 49.2 −0.9 121 49.4 −0.6 27 27.0 −5.1 580 51.2 36.990 3 <0.001
    Marital Status
    Married 199 48.7 2.7 212 56.4 6.3 8 3.3 −14.3 70 70.0 5.6 489 43.3 220.003 3 0.008
    Employment
    Employed 412 100.0 16.3 376 100.0 15.2 15 6.1 −25.2 0 0 −16.3 803 70.9 1064.784 3 0.014
    Highest level of education
    Secondary school or less 37 9.0 1.2 34 9.0 1.1 0 0.0 −5.1 17 16.8 3.6 88 7.8 76.331 6 0.015
    Vocational/professional/Non–university 238 58.2 3.0 196 52.1 −0.0 99 40.4 −4.2 59 58.4 1.3 592 52.3
    University degree or higher 134 32.8 −3.7 146 38.8 −0.5 146 59.6 7.1 25 25.8 −3.3 451 39.9
    Children?
    Yes 147 36.2 0.8 163 44.1 4.6 11 4.7 −10.9 65 65.0 6.7 386 34.8 147.998 3 0.006
    Student?
    Yes 0 0.0 −13.4 0 0.0 −12.5 245 100.0 33.7 0 0.0 −5.5 245 21.6 1133.000 3 0.005
    Factor 1 – Intrinsic/Extrinsic (mean)(a) 0.25 −0.29↑ 0.14 0.05
    Factor 2 –Situations (mean) −0.45↑ 0.36↓ 0.12 0.13

    Note: The weighting of the data can lead to rounding discrepancies and totals not adding. (a) Uses Harmonic Mean Sample Size= 208.716; the group sizes are unequal. The harmonic mean of the group sizes is used; Type I error levels are not guaranteed. ↓ Less important ↑ More important.

     | Show Table
    DownLoad: CSV

    The other abstainers and former drinker cluster found in the Ilorin sample was dominated by married females. Less important for this cluster was motivation by intrinsic and extrinsic pressures such as disliking the effect of alcohol. This again reflects the dominant culture in Nigeria where females not consuming alcohol is the societal norm [32],[35],[37],[38], although this presumption is being challenged in recent times [38]. The third cluster for Ilorin was dominated by married men who were heavy drinkers again reflecting the dominant alcohol culture found in Nigeria [32],[35],[37][39].

    In the Montevideo analyses, five clusters were apparent. As a reflection of the higher alcohol consumption prevalence rates found in Montevideo [17],[25], only one cluster featured abstainers or former drinkers and only represented 11.2% of the total Montevideo sample. Although the mean age of this cluster (26 years) was not the lowest, this cluster's main motivation against drinking was because they were too young, because friends and family disapprove of their drinking and because they were brought up not to drink. The minimum legal age to purchase alcohol in Uruguay is 18 years, although there is no law related to age of consumption of alcohol, so the young age reflection must be self-perceived. Also included in this cluster, and which may explain the inclusion of the first factor, was the motivation against alcohol because of fear which included having seen bad examples of what alcohol can do, and having been hurt by somebody else's drinking. It should be noted that the majority in this cluster were ex-drinkers rather than abstainers per se, perhaps indicating previous bad experiences. Other research has shown the prominence of ‘being brought up not to drink’ as an important factor for abstainers [14]. Of note, the family/friends influence was more highly rated in the Montevideo factors than in other cities. Family and/or friend disapproval, in particular, is a common reason for limiting alcohol consumption, especially among younger people [11],[13],[17].

    The cluster patterns for Moscow consisted of one cluster where abstainers and former drinkers represented over 70% of the cluster group. Again, based on the high overall alcohol consumption rates [25],[40],[41], this cluster was smaller in number of respondents and was dominated by females. Higher rates of alcohol consumption for males is frequently acknowledged in Russia [39],[42]. Also important in this cluster was the motivation against alcohol consumption because of fear such as they had been hurt by somebody else's drinking, because of health reasons and because they had seen bad examples. This high rating of health reasons (whether current, perceived or possibly into the future) is unusual in this age group as the limiting of alcohol consumption because of health reasons are usually associated with older persons [13]. This could be the result of intensive alcohol reduction programs implemented in recent years by public health agencies that has resulted in changes in alcohol use [43],[44]. It has been suggested that alcohol campaigns aimed at limiting consumption should concentrate on broader issues than health outcomes, instead incorporating social and community issues such as crime rates, driving accidents, and economics [6]. Not surprising for Moscow was the domination of HEDs in each of the remaining two clusters. In both of these clusters the positive justification represented by a belief that having a drink is one of the pleasures of life was more common in line with previous studies [19],[45]. This factor was less likely to be present in the abstainer cluster which again has previously been reported [19],[45].

    It has been argued that alcohol consumption patterns in China do not always follow patterns of Western countries [28],[46]. Our results indicate this to be true with both initially the factor analysis, and then the cluster analysis, producing different patterns and results in Wuhan compared to the other three cities. While China has a long history of alcohol consumption [46], overall prevalence rates have been relatively low until recent times, especially for females. China's frequency of drinking alcohol and amount consumed at a population level is now approaching other countries levels [25],[46][48]. The transition is more notable in the age group of focus in this study [46]. Unsurprisingly, based on the lower overall alcohol prevalence rate, three of the four final clusters had higher rates of abstainers and former drinkers. The clusters consisted of two distinct groups with opposite levels of importance for the factors included. All the clusters had high levels of education. For the largest abstaining group (Cluster 2), the intrinsic/extrinsic factor associated with the motivation against alcohol ‘because they had alcohol problems’ or ‘were afraid they would become an alcoholic’, was stronger for this cluster.

    Although it would be expected that gender would play an important part in these results, separate clusters dominated by males and females were only found in two of the Montevideo clusters, one cluster for Wuhan and none for the other cities. In this instance the Montevideo male dominant cluster tended to be unmarried, employed males who were heavy drinkers and in the separate cluster females were more likely to be educated, employed and current drinkers. In the final Wuhan cluster, females represented 73% of the sample. Other important descriptive variables included, not being employed and not being students, indicating perhaps a stay-at-home mother (with over 65% having children). While different patterns of alcohol consumption have been historically important, as female's alcohol consumption rates increasingly head towards convergence with males, especially in this age group, it is expected that different patterns would become less prominent [24], although this merging of the female and male alcohol overall consumption rate is contested in the literature [21]. Of note, Loose and Acier [6] report lack of differences in motives for each sex in their French study of students as did Mezquita et al. [16] in their study of Spanish students.

    Weaknesses associated with this study include the fact that these analyses are limited to cross sectional studies with no cause or effect or long-term trends implied. We also did not take into account the economic and development status of each city/country, nor investigate relationships with other risk factors (such as smokers and drug intake) which are factors that are an important consideration for the age group we studied [2]. In addition, limiting our alcohol consumption measures to one measure (frequency/quantity) rather than multiple dimensions could be seen as a weakness. Furthermore, the lack of details on personality traits, an important consideration when assessing alcohol consumption patterns, is acknowledged [16],[29]. It is also acknowledged that alcohol consumption patterns within a community are a reflection of that location's political structure, laws and regulations, societal norms and traditions, dominance of anti-alcohol religious convictions, average income levels and economic standings, as well as motives, behaviors and beliefs. Many of these aspects were not addressed in this study. Additionally, it is generally accepted, in theory, that attitudes determine behaviours. Theory also has it that in some circumstances behaviours determine attitudes, (e.g. this is partly what smoking bans hope to achieve). Either way, the theory of factorial causation dictates that attitudes and behaviours should not be analysed in the same exploratory factor analysis (EFA), which we did undertake.

    This study, in its rigorous attention to pre-survey detail and cultural differences, has endeavored to overcome any major shortcomings. The strengths of this study include the diversity of the cities studied, the focus on the limited age range, the relatively large sample size, high response rates and the use of probability-based sampling methodology (stratified, clustered, systematic) in each city. In addition, often alcohol consumption is not recorded in many official statistics and this self-report methodology has been able to incorporate all levels of consumption. An additional strength of the study is the inclusion of both abstainers and ex-drinkers, a group often omitted from these types of analyses. Weighting of the data allowed for the estimates to be representative of the general population. A further strength was the use, as far as possible, of comparable measures of alcohol consumption and demographic variables and similar methodological aspects such as sample selection, protocols, and administration. This included city specific interviewing. The involvement of local communities and language specific interviewing with translation and back translation of all questionnaires are also strengths of the study. The use of pre-designed epidemiological-sound methodology, rather than post-data collection manipulation of already collected data, is seen as an additional strength.

    This research, addressing the need for more geographical based, methodologically-comparable studies especially in low and middle income countries [3],[48], has gone someway in satisfying Bloomfield et al's [49] call for descriptive epidemiological alcohol-related research across multiple regions of the world and calls for more studies on motivation associated with alcohol consumption and abstaining [10],[13]. Future research could address the effects of specific alcohol related policies, guidelines, legislation and economic development in each of these cities. In addition, the role and pattern of social interactions has been highlighted as an important component associated with alcohol consumption in this age group and further research into this aspect of life would be beneficial.

    In conclusion, specific groupings and characteristics regarding attitudes to, and motives against, alcohol consumption are likely to exist. This study identified up to five groups for each city examined, which provides greater understanding of the patterns of alcohol consumption in these communities and increased understanding of these key motivations for drinking alcohol. Knowledge and awareness of these patterns highlights opportunities to provide more targeted preventative education and communicative strategies. This research highlights how motivations and behaviours associated with alcohol consumption are closely connected to specific countries and cultures and the importance of socio-demographic indicators.

    [1] Tian W, Lu H, Li L (2015) Nanoscale ultraviolet photodetectors based on one-dimensional metal oxide nanostructures. Nano Res 8: 382–405. doi: 10.1007/s12274-014-0661-2
    [2] Liao M, Koide Y, Sang L (2014) Nanostructured Wide-bandgap Semiconductors for Ultraviolet Detection. Austin J Nanomed Nanotechnol 2: 1–2.
    [3] Sang L, Liao M, Sumiya M (2013) A Comprehensive Review of Semiconductor Ultraviolet Photodetectors: From Thin Film to One-Dimensional Nanostructures. Sensors 13: 10482–10518. doi: 10.3390/s130810482
    [4] Tsai1 DS, Lien WC, Lien DH, et al. (2013) Solar-Blind Photodetectors for Harsh Electronics. Sci Rep 4: 2628.
    [5] Zhai T, Fang X, Liao M, et al. (2009) A Comprehensive Review of One-Dimensional Metal-Oxide Nanostructure Photodetectors. Sensors 9: 6504–6529. doi: 10.3390/s90806504
    [6] 
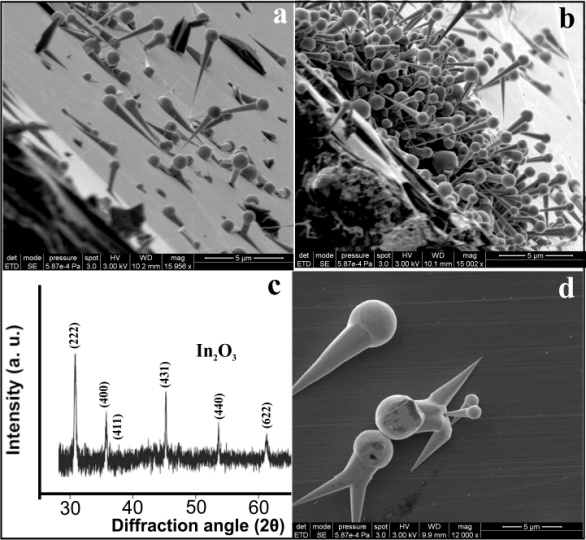
Berardan D, Guilmeau E, Maignan A, et al. (2008) In2O3:Ge, a promising n-type thermoelectric oxide composite. Solid State Commun 146: 97–101. doi: 10.1016/j.ssc.2007.12.033
    [7] Chen D, Zhang X, Lee AF (2015) Synthetic strategies to nanostructured photocatalysts for CO2 reduction to solar fuels and chemicals. J Mater Chem A 3: 14487–14516. doi: 10.1039/C5TA01592H
    [8] Liu Q, Zhou Y, Mae et al. (2012) Synthesis of highly crystalline In2Ge2O7 (En) hybrid sub-nanowireswith ultraviolet photoluminescence emissions and their selective photocatalytic reductionof CO2into renewable fuel. RSC Adv 2: 3247–3250.
    [9] Kim SS, Park JY, Kim HS, et al. (2011) Temperature-controlled synthesis of In2Ge2O7 nanowires and their photoluminescence properties. J Phys D Appl Phys 44: 025502. doi: 10.1088/0022-3727/44/2/025502
    [10] Jin C, Park S, Kim I, et al. (2014) Enhanced H2S gas-sensing properties of Pt- functionalized In2Ge207 nanowires. Appl Phys A 114: 591–595.
    [11] Gonkalves AP, Godart C (2014) New promising bulk thermoelectrics: intermetallics, pnictides and chalcogenides. Eur Phys J B 87: 42. doi: 10.1140/epjb/e2014-40989-3
    [12] Combe E, Bhame SD, Guilmeaua E, et al. (2012) Synthesis of In2-xGexO3 nanopowders for thermoelectric applications. J Mater Res 27: 500–505. doi: 10.1557/jmr.2011.386
    [13] Li L, Lee PS, Yan C, et al. (2010) Ultrahigh-Performance Solar-Blind Photodetectors Based on Individual Single-crystalline In2Ge2O7 Nanobelts. Adv Mater 22: 5145–5149. doi: 10.1002/adma.201002608
    [14] Kong XY, Ding Y, Yang R, et al. (2004) Single-Crystal Nanorings Formed by Epitaxial Self-Coiling of Polar Nanobelts. Science 303: 1348–1351. doi: 10.1126/science.1092356
    [15] Kirkham M, Wang ZL, Snyder RL (2008) In situ growth kinetics of ZnO nanobelts. Nanotechnology 19: 445708. doi: 10.1088/0957-4484/19/44/445708
    [16] Pan ZW, Dai ZR, Wang ZL (2001) Nanobelts of semiconducting oxides. Science 291: 1947–1949. doi: 10.1126/science.1058120
    [17] Vashioka S, Tokaynagi S (1967) Deposition of silicon nitride films by the silicon hydrazine process. J Electrochem Soc 114: 962–963. doi: 10.1149/1.2426791
    [18] Rzhanov AV (1982) Silicon nitride in electronics. Novosibirsk: Nauka, 200.
    [19] Santos LB, Ribeiro CA, Capela JMV, et al. (2013) Kinetic parameters for thermal decomposition of hydrazine. J Therm Anal Calorim 113: 1209–1216. doi: 10.1007/s10973-013-2968-8
    [20] Pakdehi S, Salim M, Rasoolzadeh M (2014) A Review on Decomposition of Hydrazine and Its Kinetics as a Novel Approach for CO-Free H2 Production. Res Appl Mech Eng 3: 21–25.
    [21] Dirtu D, Odochian L, Pui A, et al. (2006) Thermal decomposition of ammonia. N2H4-an intermediate reaction product. Centr EurJ Chem 4: 666–673.
    [22] Jishiashvili D, Shiolashvili Z, Makhatadze N, et al. (2015) Vapor-Solid growth of InP and Ga2O3 based composite nanowires. Eur Chem Bull 4: 24–29.
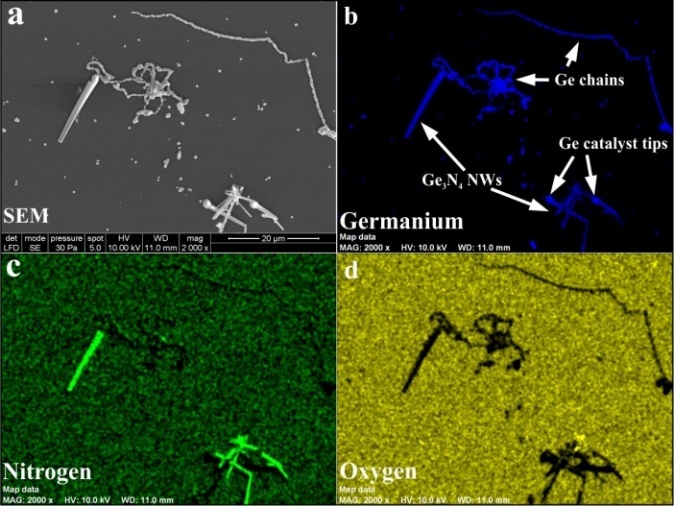
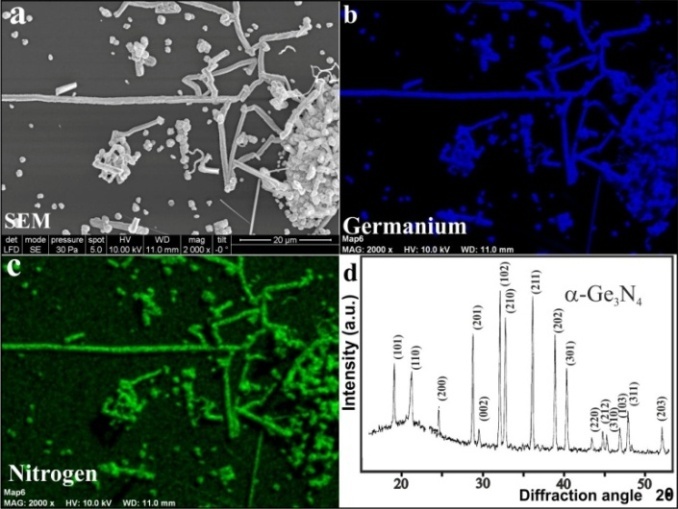
    [23] Jishiashvili D, Kiria L, Shiolashvili Z, et al. (2013) Formation of Germanium Nitride Nanowires on the Surface of Crystalline Germanium. J Nanosci 2013: 10.
    [24] Saleem U, Wang H, Peyrot D, et al. (2016) Germanium-catalyzed growth of single-crystal GaN nanowires. J Cryst Growth 439: 28–32.
    [25] Jumidali MM, Hashim MR, Sulieman KM (2010) Germanium catalyzed amorphous silicon dioxide nanowire synthesized via thermal evaporation method. International Conference on Enabling Science and Nanotechnology (ESciNano), Kuala Lumpur (1–3 Dec. 2010): 1–2.
    [26] Pan ZW, Dai Sh, Rouleau CM, et al. (2005) Germanium-Catalyzed Growth of Zinc Oxide Nanowires: A Semiconductor Catalyst for Nanowire Synthesis. Angewandte Chem 117: 278–282.
    [27] Gu Z, Liu F, Howe JY, et al. (2009) Germanium-catalyzed hierarchical Al2O3 and SiO2 nanowire bunch arrays. Nanoscale 1: 347–354. doi: 10.1039/b9nr00040b
    [28] Mullin JW (2001) Crystallization. Woburn: Reed Edu. & Prof. Publ. Ltd.
    [29] Gao YH, Bando Y, Sato T (2001) Nanobelts of the dielectric material Ge3N4. Appl Phys Lett 79: 4565–4567.
    [30] Xie T, Jiang Z, Wu G, et al. (2005) Characterization and growth mechanism of germanium nitride nanowires prepared by an oxide-assisted method. J Cryst Growth 283: 286–290.
    [31] Stoica T, Meijers R, Calarco R, et al. (2006) MBE growth optimization of InN nanowires. J Cryst Growth 290: 241–247.
    [32] Denker C, Malindretos J, Werner F, et al. (2008) Self-organized growth of InN-nanocolumns on p-Si(111) by MBE. Phys Stat Solidi (C) 5: 1706–1708.
    [33] Goff LE, Powell REL, Kent AJ, et al. (2014) Molecular beam epitaxy of InN nanorods on Si- and C-faces of SiC substrates. J Cryst Growth 386: 135–138. doi: 10.1016/j.jcrysgro.2013.09.049
    [34] Cai ZM, Ye F, Jing SY, et al. (2008) A systematic study of chemical vapor deposition growth of InN. Appl Surf Sci 255: 2153–2158. doi: 10.1016/j.apsusc.2008.07.051
    [35] Kao M, Erasmus RM, Moloto N, et al. (2015) UV-assisted synthesis of indium nitride nano and microstructures. J Mater Chem A 3: 5962–5970. doi: 10.1039/C4TA06848C
    [36] Rafique S, Han L, Zhao H (2015) Chemical vapor deposition of m-plane and c-plane InN nanowires on Si (100) substrate. J Cryst Growth 415: 78–83. doi: 10.1016/j.jcrysgro.2014.12.039
    [37] Madapu KK, Dhara S, Polaki S, et al. (2015) Growth of InN quantum dots to nanorods: a competition between nucleation and growth rates. Cryst Eng Comm 17: 3139–3147. doi: 10.1039/C5CE00053J
    [38] Tian W, Zhi C, Zhai T, et al. (2012) Ultrahigh quantum efficiency of CuO nanoparticle decorated In2Ge207 nanobelt deep-ultraviolet photodetectorst. Nanoscale 4: 6318–6324. doi: 10.1039/c2nr31791e
    [39] Liu Z, Huang H, Liang B, et al. (2012) Zn2GeO4 and In2Ge2O7 nanowire mats based ultraviolet photodetectors on rigid and flexible substrates. Opt Express 20: 2982–2991. doi: 10.1364/OE.20.002982
    [40] Yan C, Singh N, Lee PS (2009) Morphology Control of Indium Germanate Nanowires, Nanoribbons and Hierarchical Nanostructures. Cryst Growth Design 9: 3697–3701. doi: 10.1021/cg900406d
    [41] Chaoyi Y, See LP (2010) Synthesis of One-dimensional (ID) Ge-based Ternary Oxide Nanostructures. Nanoelectronics Conference (I NEC) Hong Kong: 408–409.
    [42] Zhan J, Bando Y, Hu J, et al. (2006) Hollow and polygonous microtubes of monocrystalline Indium Germanate. Angew Chem Int Ed 45: 228–231.
    [43] Bukowski TJ (2002) The optical and photoconductive response in germanium quantum dots and indium tin oxide composite thin film structures. Thesis. University of Florida.
    [44] Sarkisov PD (1971) Neorg Mater 7: 341–345.
    [45] Karazhanov SZ, Ravindran P, Grossner U (2011) First-principles study on electronic structure, phase stability, and optical properties of In2X2O7 (X═C, Si, Ge or Sn). Thin Solid Films 519: 6561–6567. doi: 10.1016/j.tsf.2011.04.221
    [46] Li H, Li Y, Li N, et al. (2015) A comparative study of high pressure behaviors of pyrochlore-type and thortveitite-type In2Ge2O7. RSC Adv 5: 44121–44127. doi: 10.1039/C5RA04587H
  • This article has been cited by:

    1. Ayotunde B. Omotoso, Alfred B. Makanjuola, Olatunji A. Abiodun, Recreational use of psychoactive substances among secondary school students in North-Central Nigeria, 2021, 26, 1465-9891, 73, 10.1080/14659891.2020.1779361
    2. N.B. Khalezova, A. Capasso, E.V. Boeva, L.V. Gutova, V.V. Rassokhin, N.G. Neznanov, N.A. Belyakov, J.L. Brown, R.J. DiClemente, Situational and motivational factors associated with unhealthy alcohol use among Russian women with HIV and hepatitis C Virus co-infection, 2022, 3, 27727246, 100053, 10.1016/j.dadr.2022.100053
  • Reader Comments
  • © 2016 the Author(s), licensee AIMS Press. This is an open access article distributed under the terms of the Creative Commons Attribution License (http://creativecommons.org/licenses/by/4.0)
通讯作者: 陈斌, bchen63@163.com
  • 1. 

    沈阳化工大学材料科学与工程学院 沈阳 110142

  1. 本站搜索
  2. 百度学术搜索
  3. 万方数据库搜索
  4. CNKI搜索

Metrics

Article views(7055) PDF downloads(1117) Cited by(1)

Figures and Tables

Figures(12)

/

DownLoad:  Full-Size Img  PowerPoint
Return
Return

Catalog