Citation: María del P. Pablo-Romero. Solar Energy: Incentives to Promote PV in EU27[J]. AIMS Energy, 2013, 1(1): 28-47. doi: 10.3934/energy.2013.1.28
| [1] | Jian Zhang, Alta Knizley, Heejin Cho . Investigation of existing financial incentive policies for solar photovoltaic systems in U.S. regions. AIMS Energy, 2017, 5(6): 974-996. doi: 10.3934/energy.2017.6.974 |
| [2] | Michael O. Dioha, Atul Kumar . Rooftop solar PV for urban residential buildings of Nigeria: A preliminary attempt towards potential estimation. AIMS Energy, 2018, 6(5): 710-734. doi: 10.3934/energy.2018.5.710 |
| [3] | Fadhil Khadoum Alhousni, Firas Basim Ismail, Paul C. Okonkwo, Hassan Mohamed, Bright O. Okonkwo, Omar A. Al-Shahri . A review of PV solar energy system operations and applications in Dhofar Oman. AIMS Energy, 2022, 10(4): 858-884. doi: 10.3934/energy.2022039 |
| [4] | Chiara D’Alpaos, Michele Moretto . Do smart grid innovations affect real estate market values?. AIMS Energy, 2019, 7(2): 141-150. doi: 10.3934/energy.2019.2.141 |
| [5] | Sabir Rustemli, Zeki İlcihan, Gökhan Sahin, Wilfried G. J. H. M. van Sark . A novel design and simulation of a mechanical coordinate based photovoltaic solar tracking system. AIMS Energy, 2023, 11(5): 753-773. doi: 10.3934/energy.2023037 |
| [6] | Chris Thankan, August Winters, Jin Ho Jo, Matt Aldeman . Feasibility of applying Illinois Solar for All (ILSFA) to the Bloomington Normal Water Reclamation District. AIMS Energy, 2021, 9(1): 117-137. doi: 10.3934/energy.2021007 |
| [7] | Jin H. Jo, Kadi Ilves, Tyler Barth, Ellen Leszczynski . Implementation of a large-scale solar photovoltaic system at a higher education institution in Illinois, USA. AIMS Energy, 2017, 5(1): 54-62. doi: 10.3934/energy.2017.1.54 |
| [8] | Amal Herez, Hassan Jaber, Hicham El Hage, Thierry Lemenand, Mohamad Ramadan, Mahmoud Khaled . A review on the classifications and applications of solar photovoltaic technology. AIMS Energy, 2023, 11(6): 1102-1130. doi: 10.3934/energy.2023051 |
| [9] | Jin H. Jo, Jamie Cross, Zachary Rose, Evan Daebel, Andrew Verderber, David G. Loomis . Financing options and economic impact: distributed generation using solar photovoltaic systems in Normal, Illinois. AIMS Energy, 2016, 4(3): 504-516. doi: 10.3934/energy.2016.3.504 |
| [10] | Nadwan Majeed Ali, Handri Ammari . Design of a hybrid wind-solar street lighting system to power LED lights on highway poles. AIMS Energy, 2022, 10(2): 177-190. doi: 10.3934/energy.2022010 |
In 2008, around 17% of the worldwide final energy consumption was used for electricity. This percentage is lower than the one for final energy for heat(47%) and transport(27%)[1]. The industrial sector used 41.5% of global final energy for electricity, other sectors(agriculture, commercial and public services, residential, and non-specified other)used 56.9% and transport used the rest [2]. Globally, fossil fuels(including coal)make up two-thirds of total electricity production(67.9% in 2011), while nuclear fusion generated 11% of electricity.
In 2011, according to the Observer report [3], the share of renewable in electricity total production of energy in the world was 20.2%, while it is expected to be up to one-third of total electricity output by 2035 [4]. In the EU-27, as pointed out by the Renewable Energy Council(EREC)[5], the share of renewable was expected to represent 34.3% of our electricity consumption according to the NREAPs in 2020. Nevertheless, according to the national RES industry roadmaps, renewable electricity(RES-E)can reach a higher share, that is, 42.3% electricity consumption by 2020. According to the NREAPs, wind energy will represent 14.1% of the electricity consumptions by 2020, hydropower 10.5%, biomass 6.5%, photovoltaic 2.35%, concentrated solar power 0.5%, geothermal energy 0.3% and ocean energy 0.15%.
By the end of 2012, the PV cumulative installed capacity in operation worldwide amounted to 102, 156 MWp(megawatt power). The vast majority of this capacity is installed in Europe(68.5%), Asian Pacific Countries(12%), North America(8.5%) and China(8.3%). As stated in Pinkse & Van den Buuse [6], the early development of this technology took place in the early 1970s, with governments investing in R&D to develop a solar alternative to fossil fuels [7]. From the mid-1980s to the mid-1990s, solar PV capacity started to grow with a modest growth rate of 15% [8], with an increasing importance for grid-connected systems after 1995 [9]. From 2000 onwards, investments in solar PV capacity have increased considerably and have become the fastest growing energy technology worldwide.
According to the European Photovoltaic Industry Association(EPIA)[10], Europe’s market has progressed rapidly over the past decade, from an annual market of less than 1 GWp(Gigawatt power)in 2003 to a market of over 13.6 GWp in 2010 and 22.4 GWp in 2011. But the record performance of 2011 was not repeatable in 2012 and the market went down to 17.2 GWp. For the first time in the last 12 years, the PV market in Europe decreased in terms of new connected capacity.
Although Europe leads the way in terms of global cumulative installed PV capacity and has shown strong growth in recent years, it still only represents a relatively small percentage of the overall provision of energy for electricity. Actually, according to EPIA [10] and based on the capacity installed at the end of 2012, PV can provide roughly 2.6% of the electricity dem and in Europe.
Along these years, the most significant barriers to install PV systems appear to be economic, basically related to the initial cost of implementing PV systems, which usually have made them uncompetitive compared to electricity generated from other fuels. The investment costs of PV systems are still relatively high, although they are decreasing rapidly as a result of technology improvements and economies of volume and scale. In 2012, there were large overcapacities. Greentech Media [11] estimated that in 2012 global PV module manufacturing capacityreached nearly 60 GWp. This represents roughly double the estimates of the 2012 PV market. Consequently, prices decreased. According to Solarbuzz [12], the lowest retail module prices in 2012 reached €0.78 per watt for multicrystalline silicon modules, €0.81 per watt for monocrystalline silicon modules and €0.62 per watt for thin film modules. Therefore, the energy generation costs, which depend on financing terms, solar irradiance and physical PV system price, also decreased. According to IEA [13], the current generation costs range from USD 155 per MWh(megawatt-hours)to USD 220 per MWh for large-scale systems and USD 185 per MWh to USD 260 per MWh for small-scale installations, depending on the solar resource.
Falling costs mean that PV is finally becoming cost-competitive without subsidies in some countries, so the support measures are changing. In sunny countries, solar PV can compete without any incentives in off-grid and isolated grid applications and in mature markets with high electricity prices, it can be competitive with retail electricity prices in commercial and residential installations [13].As stated by Bazilian et al. [14], Germany, Denmark, Italy and Spain have already reached socket parity, i.e. the point where a household can make 5% or more return on an investment in a PV system just by using the energy generated to replace household energy consumption.
Nevertheless, creating solar electricity is still among the most expensive renewable electricity generation technologies. According to IEA [13], the generation costs of large-scale bioenergy plants and bioenergy co-firing range between USD 110 per MWh to USD 240 per MWh, and USD 80 per MWh to USD 140 per MWh, respectively. The cost of electricity generation for CSP can range between USD 160-300 per MWh. The lowest generation costs for geothermal plants range from USD 35 per MWh to USD 80 per MWh, and the same costs for new hydropower plants often range between USD 50-100 per MWh. Finally, the generation costs of onshore and offshore wind power typically range from USD 50 per MWh to USD 140 per MWh, and USD 140 per MWh to USD 300 MWh, respectively.
The present work undertakes a complete review of the measures that are actually being used to promote PV in the EU-27. This analysis allows the effects of these actions to be assessed in relation to the objectives set for 2020.
The main information sources that we have taken into account are a range of reports reviewing these measures at a global level [15,16,17], the main EU Climate Policy Tracker 2011 report [18] and Financing Renewable Energy in the European Energy Market of Ecofys [19]. We also used EU Member States' progress reports from 2011 of overall renewable energy policy developments [20], as well as the Taxes in Europe database published by the European Commission [21]. Further, to study the manner in which these policy measures have been implemented in each EU-27 country, the EU Directives relating to this issue and their implementation into national legislation have also been analyzed. Additionally, we have taken into account recent related articles published in peer-reviewed journals(among them, Poullikkas et al [22], Poullikkas [23], Haas et al. [24,25], Campoccia et al.[26], Cansino et al. [27] and , Sarzynski and Shrimali [28]).
This work is structured as follows. In Section 2, the present situation of PV in the EU-27 region and the current objectives that have been established are analyzed. In Section 4, the subsidies adopted to promote PV use are examined. Furthermore, in Section 5, tax incentives for the same purpose are analyzed. Moreover, in Section 6, financial incentives and other measures are considered. Finally, in Section 7 the effects of these policies are discussed, following which conclusions are presented.
The EU is one of the most active developers of energy security assessment methods and assurance measures. Its initiatives are expressed in the form of “Directives” to increase the percentage that RES contribute to total energy dem and . The 2009/28/EC Directive on the promotion of the use of energy from renewable sources set an objective that RES should account for at least 20% of the EU’s final energy consumption by 2020. This Directive sets m and atory national targets for each Member State for the overall share of RES in gross final energy consumption as well as a m and atory share of 10% RES in the transport sector.
Following the implementation of Directive 2009/28/EC, every Member State was required to develop its own National Renewable Energy Action Plan(NREAP)that fixes specific objectives concerning the use of RES for each energy sector. These plans provide detailed roadmaps describing how each Member State expects to reach its legally binding 2020 target for the share of RES in their final energy consumption. Therefore, European countries have increased their capacity of renewable energy. As part of the planned renewable electricity capacities for 2020, solar photovoltaic panels are the third largest installed RES source, after hydroelectric capacity and wind capacity.
According to the NREAPs provided by each country, more than one third of our electricity consumption will come from renewable energy sources by 2020. This percentage is lower than that estimated by the national RES industry roadmaps [5], where renewable electricity can reach a higher share of 42.3% electricity consumption by 2020.
Table. 1 shows targets for PV set down in the NREAPs, with the last row in that table showing that the installed capacity by 2020 is expected to amount to 84381 MWp. Germany, Spain and Italy have set the highest targets, while Estonia does not include PV targets at all in its plans, and Latvia, Pol and , Irel and , Denmark, and Sweden provide extremely low targets. The PV installations estimated by Member State national RES industries is also shown in the table(column 3). Eighteen of the 27 EU countries expect to reach or exceed their domestic targets by 2020. PV installations by 2020 are expected to account for 135891 MWp in the EU-27, which is 62% higher than the NREAPs estimate. In this case, Germany, Italy and Spain also expect to consume the most of the energy of this form. There is no available data for Denmark, Irel and , Romania and Estonia. Moreover, the global market outlook report for PV by EPIA [10] pointed out that it is feasible for an installed capacity to be more than two times greater than the NREAPs target to be reached in 2017.
Table. 1 also presents data on the installed solar PV energy capacity for the years 2001 and 2012 [16]. The total installed PV capacity in EU-27 in 2012 was 68648 MWp. Germany has always been the country with the highest installed capacity, accounting for 32698 MWp in 2012, which represents almost 48% of the EU-27 total capacity. It is followed by Italy, Spain, France, Belgium and Czech Republic, according to figures from 2012, with all of these countries(including Germany)representing about 91% of EU total capacity. Figure 1 shows the share of installed capacity of PV.
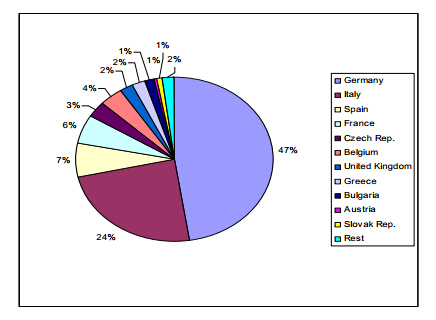 Figure 1. Share of solar PV energy installed capacity in EU-27(2012).
 In terms of capacity of PV installed per inhabitant, at the end of 2012 the EU-27 had a capacity of 135 kWp(kilowatt power)/1, 000 inhabitants. As shown in Figure 2, EU-27 countries with an above average installed capacity are led by Germany with 398 kWp/1, 000 inhabitants, followed by Italy(273 kWp/1, 000 inhab.), Belgium(241 kWp/1, 000 inhab.), Czech Republic(196 kWp/1, 000 inhab.) and Greece(144 kWp/1, 000 inhab.). The rest of the countries have a below-average installed solar PV capacity. Some of the countries with the lowest average are Estonia(0.1 kWp/1, 000 inhab.), Pol and (0.1 kWp/1, 000 inhab.), Finl and (0.20 kWp/1, 000 inhab.), Latvia(0.3 kWp/1, 000 inhab.), Hungary(0.4 kWp/1, 000 inhab.), and Irel and (1 kWp/1, 000 inhab.)[16].
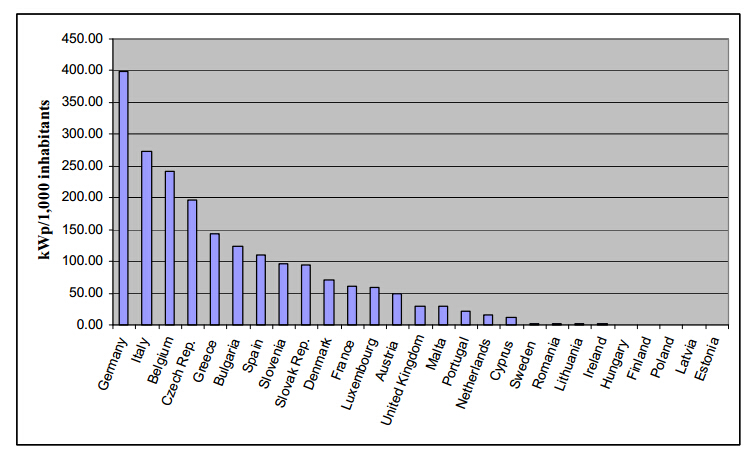 Figure 2. Solar PV installed capacity in EU-27 countries(2012)(kWp/1, 000 inhabitants).
The average annual growth rate in installed PV capacity in the period 2005-2012 was 41.2%(Table. 1). Bulgaria had the highest percentage growth rate, although its initial installed capacity was very low. The Czech Republic, Belgium, Slovenia, Slovakia, Malta and Portugal also had annual growth rates higher than 100%, while that of Italy, Greece, Lithuania and Latvia was around 70%. The lowest rates correspond to Irel and and Luxemburg. The market size in the EU-27 countries more than tripled between 2005 and 2012. This increase in solar PV installations is thanks largely to feed-in tariffs, which considerably reduce project risk. However, according to EurObserv'ER [16] data, in 2012 the newly connected capacity was 16.5 GWp, lesser to 22 GWp in 2011. It is a 25% slide. Some markets, such as Italy’s, have been living difficult economic times in recent years, while others, such as Germany’s, have continued to experience impressive growth.
Table. 1 also outlines the percentages of 2020 objectives already installed in 2012 with respect to NREAP and national RES industry roadmap targets, respectively. The last row shows that the EU-27 has already reached almost 82% of the NREAP target and 50% of the national RES industry roadmap target. Overall, eleven countries have already reached their NREAP target, while six are far from doing so. It is worth noting that only Slovenia has not yet reached the national RES industry roadmap previsions.
| NREAP Installed Capacity(MWp) | National Roadmap Installed Capacity(MWp) | Installed Capacity(MWp)2001 | Installed Capacity(MWp)2012 | Annual growth rate 2005-12 | % 2020 objective already installed NREAP | % 2020 objective already installed National Roadmap | |
| Source: Own elaboration from EPIA [10] and EurObserv'ER [16] | |||||||
| Germany | 51753 | 39500 | 195 | 32698 | 32.8 | 63.18 | 82.78 |
| Italy | 8000 | 26091 | 20 | 16361 | 79.8 | 204.51 | 62.71 |
| Spain | 8367 | 18625 | 16 | 4517 | 54.7 | 53.98 | 24.25 |
| France | 4860 | 5400 | 14 | 4028 | 65.4 | 82.87 | 74.59 |
| Czech Rep. | 1695 | 2400 | n.a. | 2022 | 129.4 | 119.32 | 84.27 |
| Belgium | 1340 | 3440 | 0.00 | 2650 | 104.7 | 197.76 | 77.03 |
| U. Kingdom | 2680 | 8000 | 3 | 1658 | 65.3 | 61.84 | 20.72 |
| Greece | 2200 | 3000 | 1 | 1543 | 75.9 | 70.15 | 51.44 |
| Bulgaria | 303 | 1510 | n.a. | 933 | 162.5 | 307.99 | 61.80 |
| Portugal | 1000 | 2000 | 1. | 229 | 54.4 | 22.88 | 11.44 |
| Austria | 322 | 6819 | 7 | 422 | 33.2 | 130.96 | 6.18 |
| Netherl and s | 722 | 7103 | 21 | 321 | 20.1 | 44.46 | 4.52 |
| Slovenia | 139 | 94 | n.a. | 217 | 103.3 | 156.37 | 231.22 |
| Slovak Rep. | 300 | 1040 | n.a. | 517 | 147.4 | 172.44 | 49.74 |
| Denmark | 6 | n.a. | 2 | 392 | 64.8 | 6528.33 | n.a. |
| Luxembourg | 84 | 363 | 2 | 47 | 7.2 | 56.15 | 13.01 |
| Sweden | 8 | 4000 | 3 | 24 | 18.8 | 297.83 | 0.60 |
| Cyprus | 192 | 87 | n.a. | 17 | 43.9 | 8.94 | 19.72 |
| Malta | 27 | 24 | n.a. | 19 | 104.0 | 67.37 | 75.22 |
| Finl and | 10 | 3374 | 3 | 11 | 10.8 | 111.70 | 0.33 |
| Hungary | 63 | 162 | n.a. | 4 | 37.9 | 5.93 | 2.31 |
| Pol and | 3 | 786 | n.a. | 3 | 27.0 | 113.17 | 0.43 |
| Romania | 260 | n.a. | n.a. | 6 | 51.6 | 2.46 | n.a. |
| Lithuania | 10 | 53 | n.a. | 6 | 80.1 | 61.00 | 11.51 |
| Irel and | 5 | n.a. | n.a. | 1 | 8.7 | 13.86 | n.a. |
| Latvia | 2 | 48 | n.a. | 2 | 77.0 | 75.50 | 3.17 |
| Estonia | 0 | n.a. | n.a. | 0 | 47.9 | n.a. | n.a. |
| EU 27 | 84381 | 135891 | n.a. | 68648 | 41.2 | 81.35 | 50.52 |
 DownLoad: CSV
Finally, according to EPIA [10], it is worth noting that the European PV market remains quite heterogeneous, with diverse segmentation from one country to another. In 2012, the commercial rooftop applications represented almost 32% of the market, the ground-mounted systems represented 28%, the residential applications almost 21% and the rest is represented by the industrial segment. Nevertheless, given the recent changes in regulatory frameworks, the ground-mounted segment will probably decline considerably in Europe in 2013, while the trend of the commercial and industrial rooftop segments is expected to continue.
The most known policy instruments for PV currently used in Europe are Feed-In Tariffs(FITs) and Feed-In Premiums(FIPs). Actually, 18 EU countries support electricity from PV installations with FITs or FIPs. Feed-in tariffs guarantee the generator a certain price per kWh at which electricity is bought, while Feed-in premiums are a premium given above market prices. Both are typically guaranteed for a long period, which differs from one country to another. In the EU-27 this period range is around 10-25 years. Tariffs are normally adjusted, in a decreasing manner, annually. Nevertheless, currently, seven countries have decided to accelerate this decrease rate in view of cost reduction of the installations and of higher efficiencies. Table. 2provides an overview of the use of these incentives.
| FIT or FIP | Duration years | Degression Frequency | Net Metering | ||
| Source: Own elaboration from ResLegal [17], EurObserver [16] and EPIA [15] | |||||
| Austria | ✓ | 13 | Not set | Since 2002, the Eco Electricity Act sets feed-in tariffs for different renewable energy sources. The levels of feed-in tariffs are annually adapted. Since 2012, only systems larger than 5 kWp are supported. The tariff for systems on buildings or noise barriers is18.12€Ct/kWh and for other systems is 16.59 €Ct/kWh. | |
| Belgium | ✓ | In Fl and ers and Wallonia regions, net-metering applies to installations with a capacity ≤ 10 kWp. In the Brussels-Capital region, it applies to installation with a capacity ≤ 5 kWp. | |||
| Bulgaria | ✓ | 20 | Not set | The tariff was cut in 2012 by around 50%, and now it is 121.20€/MWh for smaller solar power plants on the ground(from 200kWp to 10MWp) and €120.79€/MWh for larger plants(>10MWp). | |
| Cyprus | ✓ | 20 | Not set | The current feed-in tariff is 0.250€/KWh for smaller plants(up to 150kWp) and 0.21€/KWh for larger installations. | |
| Czech Rep. | ✓ | 20 | Not set | A feed-in tariff can be granted to operators of PV plants with an installed capacity up to 30 kWp on rooftops or facades. From July 1-December 31 2013, the tariff for systems of installed capacity up to 5 kWp is €ct 11.6 per kWh and for systems of installed capacity up to 30 kWp is €ct9.4 per kWh. Nevertheless, plant operators may decide that the electricity they generate should be supported through bonus payments of a statutorily set amount per MWh(systems up to 5 kWp, €ct11.1 per kWh and systems up to 30 kWp, €ct8.8 per kWh). | |
| Denmark | ✓ | 20 | Annually | ✓ | In systems connected to the grid after 21st April 2004, a fixed tariff of 8.0€cent/kWh for ten years and 5.3 €cent/kWh for the following ten years is guaranteed. If the systems have been connected in 2013, the fixed payment is 17€cent/kWh for individual systems, 19 €cent/kWh for collective and 8€cent/kWh for systems with a capacity of more than 400 kWp the first ten years and 5.3€cent/kWh the following ten years. Finally, if the systems are installed after 31st December 2013, the fixed tariff rates will be gradually lower depending on the year of installation. |
| Estonia | |||||
| Finl and | |||||
| France | ✓ | 20 | Quarterly | Electricity from PV installations on buildings lower than 100 kWp is supported through a feed-in tariff. Tariffs are adjusted quarterly based on requests received by the network managers. If the number of projects submitted is in accordance with the planned trajectory, the adjustment will be a decrease in the rate of purchase of 2.6%. If the flow of new projects is less important, the decline will be less pronounced or even zero.For installation on buildings that is higher than 100 kWp and for power ground, the device is based on tenders. Offers meeting this specification are selected on the criterion of energy prices proposed by the applicant. | |
| Germany | ✓ | 20 | Monthly | The Federal Network Agency regularly updates the amount of newly installed capacity and the revised feed-in tariffs and degression rates. Ground-mounted and rooftop systems > 10 MWp do not receive FIT support. For the rest of installations, FITs are adapted on a monthly basis. The degression of tariffs from February 2013 until/to April 2013 is 2.2% per month, if the installed capacity remains in the corridor(A yearly margin of 2, 500-3, 500 MWp newly installed capacity). If the installed capacity is inferior to that of the corridor, the monthly degression can be partially applied or the FIT can be increased. If the installed capacity is above that of the corridor, the degression can be increased. Only certain shares of the produced electricity are remunerated: 85 % for systems < 10 kWp and 90 % for systems > 10 kWp. | |
| Greece | ✓ | 20-25 | Semester | Since 2012, a decreasing rate was applied and it was adjusted in February and August. For each year from 2015 onwards, the tariffs will be established using the expression1.3*SMP(large interconnected systems) and 1.4*SMP(all other systems), where SMP is the System Marginal Price. | |
| Hungary | ✓ | variable | Not set | FIT level is very low. | |
| Irel and | ✓ | Not set | Not set | Only micro-generation installations countrywide are supported with FIT | |
| Italy | ✓ | 20 | Semester | ✓ | The so-called 5th feed-in scheme(5 Jul. 2012)redefines the rules on support for solar photovoltaic power generation. Now the Italian feed-in tariff scheme decreases each semester. There is a st and ard feed-in tariff for rooftop and ground-mounted systems, which depends on the size of the installation. And other st and ards feeding tariff for self-consumption, PV plants using innovative, technological, feed-in tariff, PV plants using innovative technological self-consumption tariff, concentrating PV plants feed-in tariff and concentrating PV plants self-consumption for PV plants with a nominal power over 1MWp, the Gestore dei Servizi Energeticidoes not purchase the electricity produced, but it pays a feed-in premium that is explained as the difference between the feed-in tariff above and the applicable average electricity market price. This feed-in premium should be increased by some increments. |
| Latvia | |||||
| Lithuania | ✓ | 12 | Not set | Feed-in tariffs for PV are 36€ct/kWh for installation < 30 kWp, 34€ct/kWh for installation between 30-100 kWp and 26€ct/kWh if the installation is higher than 100 kWp. | |
| Luxembourg | ✓ | 15 | Yearly | Only for on-grid rooftop installations. The tariff is 26.4 €ct/kWh. Since 2013, a degression rate was applied. | |
| Malta | ✓ | 20 | Not set | The tariffs for electricity generated during the first six months of 2013 are €0.17 per kWh for installations located outside residential or domestic premises, €0.18 per kWh for roof-mounted installations with an installed capacity of less than 1000 kWp, €0.17 per kWh for roof-mounted installations with an installed capacity of 1000 kWp or more, €0.17 per kWh for ground-mounted installations with an installed capacity of less than 1000 kWp and € 0.16 per kWh for ground-mounted installations with an installed capacity of 1000 kWp or more. | |
| Netherl and s | ✓ | ✓ | The SDE+ scheme grants a premium on top of the market price to the producers of renewable energy in order to compensate the difference between the wholesale price of electricity from fossil sources and the price of electricity from renewable sources. Only PV installations with a capacity greater than or equal to 15 kWp are eligible. The support is made available in 6 stages. The amount of support at stage 6 is €ct14.8 per kWh. | ||
| Pol and | |||||
| Portugal | ✓ | 15 | The indicative average rate is €257 per MWh. There are special tariffs for electricity generated from renewable sources by so-called microproduction units, for electricity combined with heating systems and for small power plants(miniproduction units), which use a single production technology. The reference tariff in 2013 for PV microproduction units is €196/MWh and for miniproduction units is €151/MWh. The tariffs for miniproduction and miniproduction units are subjected to a degression rate, they change after the first seven years. | ||
| Romania | |||||
| Slovak Rep. | ✓ | 15 | Not set | The feed-in tariff consists of two parts: the price of electricity for/regarding losses(market price) and a surcharge. For PV plants, the surcharge applies only to roof-top or facade-integrated plants up to 100 kWp.(€ct 11.911 per kWh). Since July 2013, the tariff only applies to installations up to 30 kWp. | |
| Slovenia | ✓ | 15 | Monthly | In Slovenia, PV power plants are eligible for a feed-in tariff if their capacity does not exceed 5 MWp and for a premium if the systems are larger than 5 MWp. The tariff rates and the amount of the premium tariff are calculated on a monthly basis, which implies a monthly degression of the reference cost by 2 %. | |
| Spain | M | 25 | Semester | Since 29th January 2012, a moratorium was set by the government and the registry is closed for the moment. The suspension will not affect plants that are already receiving payments, but it will suspend/stop the pre-allocation process. Since February 2013, the updating method of tariffsis retroactively linked to a specific index for all plants. | |
| Sweden | |||||
| Un. Kingdom | ✓ | 20 | Quarterly | Accredited producers whose plants have a capacity of less than 5 MWp can sell their electricity at fixed tariff rates. These rates depend on efficiency parameters(higher-middle and lower) and capacity. | |
DownLoad: CSVNet metering allows utility customers to offset some or all of their electricity use with self-produced electricity from PV systems [29]. Thus, at the end of a given period, the customer is billed only for the net electricity used. If more energy is produced than it is consumed, producers may receive benefits for this positive balance as the excess of energy sent to the utility can be sold back at retail price [23]. Currently, in EU-27, only four countries have implemented a net metering system. In Belgium, net metering is possible for all PV installations up to 10 kVA. In Denmark, the excess electricity may be sold to the grid. Individual PV systems connected to the grid in 2013 receive 17€cent/kWp while collective systems receive 19€cent/kWh. In Italy, net metering is also available, but since the 5th Conto Energia, only as an alternative to the FIT. In Netherl and s, only small consumers connected to the electricity grid(up to15 kWp -3 x 80 A consumers-)are entitled to net metering.
Nowadays, fifteen countries support PV through public subsidies in the EU-27. As an instrument of energy policy, subsidies have the interesting characteristic that they are easy to manage for public authorities. A simple scheme based on an application, a check-comparison with st and ard legal requirements, and a possible review by authorities is all that is required to implement this type of policy measure. Usually, the level of subsidy is fixed as a percentage of the total cost of the investment, with legal maximums settled in nominal terms.
The nature of the direct subsidy scheme can be very different among countries. In most cases, these subsidies are involved in promotion programs that are renewed annually. In other cases, the subsidies are included in specific programs with a specific date of expiration. Table. 3 offers an overview of subsidies for EU-27 countries.
| Member State | Subsidies/Direct Grant |
| Source: Own elaboration from ResLegal [17], EurObserver [16] and EPIA [15] | |
| Austria | The Eco Electricity Act enables an investment grant for roof-mounted systems of 30% of investment costs, with a maximum of 200€/kWp for systems bigger than 5 kWp. Systems smaller than 5 kWp are supported through the Climate and Energy Fund. The investment support fund for the smaller systems is exclusively targeting private households. Support levels are €300 kWp for rooftop or ground-mounted installations and €400 kWp for building integrated installations. |
| Belgium | There are different regional subsidies to promote PV. Among them, investment assistance for companies which develop environmental projects and energy efficient technologies as a percentage of the eligible costs; energy subsidies for residential, industrial and service sector buildings, and finally, the Walloon region provides subsidies to support initiatives to reduce the energy consumption of public buildings/institutions. |
| Bulgaria | The Operational Program "Environment"(OPE), which allocates investment grants from the Cohesion Fund to individual and large projects, grants subsidies to off-grid systems. The amounts of subsidies range between 100% of the expenses costs for public organizations and 50% for large enterprises. |
| Cyprus | Grants are allocated to encourage the installation of off-grid PV installations. Grants are 55% of the total investment for domestic and non-profit organizations and 40% for commercial public entities. |
| Czech Rep. | The OPE grants subsidize up to 85% of a project's total eligible expenditures for building-integrated PV installations. The Operational Program “Enterprise and Innovations”, which allocates investment grants from the European Regional Development Fund, grants subsidies for projects in the field of renewable energy and under calls for applications in developing regions. |
| Denmark | Subsidies are provided for small PV building integrated installations connected to the grid. |
| Finl and | A subsidy for PV systemscan be provided to private companies, municipalities or consortium of entities. The support level is up to 30% of the investment project costs and 40% of the assessment project costs. If the investment project involves a new technology then an additional 10% subsidy may be granted. Also an additional 10% may be granted if the assessment project is carried out by municipalities ormicro-companies. |
| Germany | Subsidies are regionally regulated. They are in place except for residential sector. |
| Hungary | The OPE grants all off-grid PV-installations and on-grid PV-installations up to 500 kWp. |
| Lithuania | Lithuanian Environment Investment Fund grants investments covering up to 80% of the entire eligible expenses for a project. |
| Luxembourg | The installation of solar systems in private households is incentivized/highlighted by investment grants. Since 2013, the grant is 20% per installation for roof or façade systems up to 30 kWp and to a maximum of €500/kWp. Companies may also receive grants for investments in renewable electricity generation for self-consumption up to 50% of the investment. For local authorities’ buildings, there is also a grant of 15% of investment cost up to €900/kWp. |
| Netherl and s | A subsidy for PV systemscan be provided to private households. Consumers will receive 15% on the hardware of solar systems from 2 July until the end of 2013, but not more than €650 per installation is subsidized. |
| Slovenia | The Ministry of Agriculture and the Environment supports investments tendering for “Diversification into non-agricultural activities”. Grants are subjected to a maximum of 70% of the investment costs in PV power plants. Also, The Ministry for Infrastructure and Spatial Planning awards subsidies, state aid and “de minimis” aid to cover some of the costs related to the use of renewable energy instead of traditional energy sources. |
| Sweden | Subsidy is given to all types of actors and all types of grid connected PV and hybrid PV-solarthermal systems. As of the 1st February, 2013, the subsidy can only make up 35 % of the investment cost. The investment cost upon which the subsidy is calculated is 4, 300€ per installed kWp peak capacity for PV systems. For hybrid PV-solar thermal systems, it is 10, 500€ per installed kWp. |
| Un. Kingdom | In Northern Irel and , There is a grant for the installation of PV systems, for SMEs(a companyemployingless than 250 employees and a turnover of less than €50 million). The(grant)offer is 20% of the relevant eligible costs of installation of a PV system up to a maximum of £3000.The fund is open for application forms as of the 1st April, 2013. |
DownLoad: CSVIn addition to FIT and subsidies, PV systems are also promoted through a range of tax incentives. The main tax incentives used by the EU-27 countries are deductions or tax credits, exemptions and reduced tax rates. Nowadays, twelve European countries offer different tax incentives to encourage the use of PV.
Reduced tax rates are applied in Bulgaria and France. In Bulgaria, VAT for PV revenues is reduced from 15% to 10%. In France, there is a reduced VAT rate(from 19.6% to 7%)on material and installation costs for residential customers if the PV system size is lower than 3 kWp. Also, reduced local tax rates may be applied in Spain when specifically approved by the municipality/local government.
Tax deductions or tax credits are applied in Belgium, Denmark, France, Germany, Irel and and Netherl and s. Tax deductions reduce the amount of taxable income while tax credits are a reduction of the tax due. In Belgium, there is a tax credit from income tax for energy-saving investments granted to individuals. The tax reduction rate is 40% of the investment, up to €3, 600. In France, residential customers get a tax credit of 11% of the material costs(with a limit of 3, 200 €/kWp and a maximum tax credit of 8, 000 € for a single person and 16, 000 € for a couple)from income tax. The capacity of the eligible plant shall not exceed 3 kWp. For installations above 3 kWp, the owner has to prove that the building consumes at least an equivalent of half of the PV production. In Denmark, private households’ own consumption is tax-free and the income from the net production is deducted 933€ from income tax and only 60% of the remainder of the income is taxed. Businesses are subjected to tax on their gross production, but the production is taxed only at the value 8.0€cent/kWh for ten years and 5.3 €cent/kWh for the following ten years. In Germany, for some commercial systems, which operate closely to producing or manufacturing facilities, a 12.5-27.5% of investment cost can be claimed as tax credit from corporate tax. In Irel and , there is a tax incentive for corporate investments in certain renewable energy projects, among them PV, to encourage companies to invest in energy saving. Companies that install PV systems are allowed by the Accelerated Capital Allowance, to permit full amortization of the purchase value of qualifying energy efficient equipment against their profit in the year of purchase. Finally, in the Netherl and s, enterprises are eligible for a tax credit for investments in renewable energy plants or energy-efficiency technologies, if they are published in the Energy List. The amount of tax credit may be up to 41.5% of the total investments made. Nevertheless, investments of less than 450 Euros are ineligible.
Finally, five countries implemented tax exemptions to promote PV. In the Netherl and s, generators of electricity from PV that use the electricity they consume(own consumption clause)may be exempt from the energy tax. In Pol and and Slovakia, electricity from renewable sources is exempt from consumption tax. In UK, electricity from renewable sources is exempt from Climate Change Levy, a climate protection tax. In Luxembourg, income from photovoltaic systems generating 1 to 4 kWp is exempt from income tax.
In Czech Republic, tax exemptions were abolished from 1st January 2011. Furthermore, a special charge was imposed on the electricity produced between 1st January 2011 to 31st December 2013 in some PV systems above 30 kWp.
Some countries also implemented other measures to promote PV systems. These include green certificates. With tradable green certificates, the power is sold to the normal market, but in addition, generators of renewable energy sources obtain a certain amount of green certificates that represent the renewable energy they generate. These certificates can be sold. There are also some entities forced to buy a certain amount of green certificates. Nowadays, five European countries implemented green certificate systems.
In Belgium, the green certificate trading system was implemented in electricity, for both Fl and ers and Wallonia regions. Producers of solar electricity obtain remuneration per Green Certificate coming from the grid operator for a period of 15 years. The remuneration is different for small and large systems and depends on the date of start of production/the date when they started producing it. In Pol and , a quota system was implemented in terms of a quota obligation combined with a certificate-trading scheme. Electricity generators and suppliers that provide electricity to customers are obliged to fulfill a specified quota of green certificates. Meanwhile, renewable electricity producers receive tradable green certificates for the electricity produced. Nevertheless, electricity generators and suppliers may pay a fee as an alternative, and the market price of these certificates is not guaranteed. Therefore, the system of green certificates is not effective.
In Romania, the system of green certificates obliges electricity suppliers and producers to present a certain number of green certificates, equal to a 14% of the total annual electricity sold, by the end of each trimester. In Sweden, since 2012, the green certificate system is a joint Norwegian-Swedish electricity certificate market. The renewable producers receive certificates from the authorities, which are sold to suppliers and certain electricity users.The quota obligation per MWh of electricity sold or consumed is 0.135.
Finally, in UK, electricity suppliers are obliged to supply a certain proportion of electricity coming from renewable sources. This means they have to prove that 0.206 ROC/MWh of electricity supplied was generated from renewable sources. This quota can be proved by presenting a certain number of green certificates. Meanwhile, a photovoltaic MWh generated may receive 1.7 green certificates in case of installation on a building, and 1.6 certificates in case of on ground installation. The quota system supports plants above 5 MWp, but plants between 50 kWp and 5 MWp may choose between FIT and this renewable obligation system.
Financial support measures are also used to promote PV, with five EU-27 countries having offered the possibility of reduced-interest loans to fund the implementation of these systems.
In Bulgaria, there are soft loans for PV installations up to 1000 KWp available from the European Bank for Reconstruction and Development. Also for Hungary, there are EU funds available for commercial applications to do net-metering PV projects, which started in February 2013. In Germany, there are some beneficial credits under the KfW programme Renewable Energy. There are loans for the construction, extension and purchase of systems generating electricity and for the export to the grid in pursuance of the EEG, up to 100% of eligible net investment cost. The interest rates depend on the amount of the loan and the credit period, and are actually in between 1% and 7.35%. In the Netherl and s, investors in electric green projects are eligible for a reduction of the interest rate on the order of 1% on the basis of a Green project declaration. Finally, in Slovenia, the Eco Fund assigns soft loans to PV investors through tendering. The loan can cover up to 90% of investment expense.
Table. 5 summarizes government-implemented measures that have been used to promote PV by the EU-27 countries, and the main outcomes derived for the period 2005-2012. Column 2 shows the countries which implemented FITs or FIPs. Column 3 shows those that used subsidies, Column 4 shows those that implemented tax incentives, Column 5 show green certificates and Column 6 explains the financial measures. Column 7 shows the installed capacity, Column 8 expresses the annual growth rate, and finally, Column 9 shows the percentage of installed capacity related to NREAP target.
| FITs, FIPs | subsidies | Tax Incentives | Green Certificates | Soft Loans | Installed Capacity(MWp)2012 | Annual growth rate 2005-12 | % 2020 objective already installed NREAP | |
| Source: Own elaboration | ||||||||
| Germany | ✓ | ✓ | ✓ | ✓ | 32698 | 32.8 | 63.18 | |
| Italy | ✓ | 16361 | 79.8 | 204.51 | ||||
| Spain | M | ✓ | 4517 | 54.7 | 53.98 | |||
| France | ✓ | ✓ | 4028 | 65.4 | 82.87 | |||
| Czech Rep. | ✓ | ✓ | 2022 | 129.5 | 119.32 | |||
| Belgium | ✓ | ✓ | ✓ | 2650 | 104.7 | 197.76 | ||
| U. Kingdom | ✓ | ✓ | ✓ | ✓ | 1657 | 65.3 | 61.84 | |
| Greece | ✓ | 1543 | 75.9 | 70.15 | ||||
| Bulgaria | ✓ | ✓ | ✓ | ✓ | 933 | 162.5 | 307.99 | |
| Portugal | ✓ | 229 | 54.4 | 22.88 | ||||
| Austria | ✓ | ✓ | 422 | 33.2 | 130.96 | |||
| Netherl and s | ✓ | ✓ | ✓ | ✓ | 321 | 20.2 | 44.46 | |
| Slovenia | ✓ | ✓ | ✓ | 217 | 103.3 | 156.37 | ||
| Slovak Rep. | ✓ | ✓ | 517 | 147.5 | 172.44 | |||
| Denmark | ✓ | ✓ | ✓ | 392 | 64.8 | 6528.33 | ||
| Luxembourg | ✓ | ✓ | ✓ | 47 | 7.2 | 56.15 | ||
| Sweden | ✓ | ✓ | 24 | 18.9 | 297.83 | |||
| Cyprus | ✓ | ✓ | 17 | 43.9 | 8.94 | |||
| Malta | ✓ | 19 | 104.0 | 67.37 | ||||
| Finl and | ✓ | 11 | 10.8 | 111.70 | ||||
| Hungary | ✓ | ✓ | ✓ | 4 | 37.9 | 5.93 | ||
| Pol and | ✓ | ✓ | 3 | 27.0 | 113.17 | |||
| Romania | ✓ | 6 | 51.6 | 2.46 | ||||
| Lithuania | ✓ | ✓ | 6 | 80.1 | 61.00 | |||
| Irel and | ✓ | ✓ | 1 | 8.7 | 13.86 | |||
| Latvia | 2 | 77.0 | 75.50 | |||||
| Estonia | 0 | 47.9 | n.a. | |||||
| EU-27 | 68647 | 41.2 | 81.35 | |||||
DownLoad: CSVIn general, it can be seen that measures designed to promote PV were not implemented in the same way by all 27 EU countries. Notable differences can be seen in terms, both in the regulations and in the fiscal and financial measures employed, which in some cases, are related to specific features. According to Campoccia et al. [26], the value of solar irradiation influences the value that can be assumed in the payback period, in the net present value, and in the internal rate of return for PV systems. In this sense, large differences in solar radiation energy can be found not only within the 27 EU Member States, but also within different regions of the same country. According to Šúri et al. [30], the highest potential for solar-based electricity generation is in Portugal, Malta, Cyprus, most parts of Spain, Italy, Croatia, southern France and Corsica, and Greece. In contrast, Scotl and , Sweden and Finl and have the least favorable conditions for the implementation of PV technologies. Nevertheless, not all of the main markets for PV installation benefit from good solar conditions currently. In that sense, as stated in Cherrelle [31], for countries like Germany, whose solar conditions are not so favorable, a re-observation is needed for its renewable policy. When PV does not produce sufficient electricity, other strategies would possibly be better to reduce CO2 emissions and cut the depe ndency on fossil fuels.
The first of the instruments used to promote PV in the EU-27 countries is FITs. Several authors state that the development of FITs has been effective in the promotion of renewable energies [24,25,32]. In general, countries which have introduced this mechanism since the first phases of the promotion of these technologies have increased significantly their installed capacity and their production of renewable energy.
However, authors such as S and ström [33] consider that the establishment of FITs has negative effects on the economy in the form of runaway costs for states, and , in some cases, bubbles where profit-maximizing companies quickly exploit the regulatory systems. In that sense, Frondel et al. [34,35] show that Germany’s principal mechanism of supporting renewable technologies through FITs, in fact, imposes high costs without any of the alleged positive impacts on emissions reductions, employment, energy security, or technological innovation.According to Cherrelle [31], PV with decreasing costs combined with attractive tariffs(FITs)without a fixed cap might lead to unexpected installed capacities, raising policy costs to questionable levels. Thus, as stated by Calzada Alvarez et al. [36], in Spain such artificial subsidy schemes caused a bubble and encouraged massive inefficiencies, which increased the economic cost. For 2008, the mean sale price of electricity generated through solar photovoltaic power was 7 times higher than the mean price of the pool.
Therefore, policy should be designed for adapting to changes in system costs. In that sense, several countries have decided to apply diminishing rates linked to deployment volumes in view of cost reduction of the installations and the higher efficiencies. But other countries reacted on this sudden policy costs growth by taking retroactive measures to control them. The effects of such “stop- and -go” policy measures include significant market contraction with attendant business closures and job losses. Therefore, other financially interesting schemes should be considered, such as power purchase agreements or net-metering systems. Nevertheless, electricity prices may reflect real costs to make profitable these alternatives. Furthermore, according to Frondel et al. [35], government intervention can also serve to support renewable energy technologies through funding for research and development(R&D), which may compensate for under-investment from the private sector, owing to positive externalities. Also, Capros el al. [37] state that the trading of renewable obligations between Member States can induce moderate changes in renewable energy production.
The second of the instruments used to promote PV in the EU-27 countries is the concession of subsidies. According to Cansino et al. [27], the main reason for the use of subsidies is that, by reducing the high costs of investment in a straightforward manner, they encourage the adoption of specific technologies that are usually capital intensive. This is in tune with the results of Sarzynski et al. [28] for the USA, where the importance of the concession of subsidies for the establishment of new technological systems is encouraged due to the reduced costs involved. It is perhaps for this reason that, currently subsidies are the main global instrument used for promoting the implementation of solar-based energy [38].
Subsidies also have the advantage that governments can adapt them to their own territorial characteristics, permitting each government to promote solar energy implementation in the way they best fit. However, subsidies have the disadvantage of being closely linked to budgetary resources and therefore to budgetary constraints. In most EU countries, subsidies for renewable energy for PV are being lowered.
Besides subsidies, EU countries also adopted tax deductions or tax credits, although to a lesser extent. Only twelve countries adopted tax measures. As noted in Sarzynski and Shrimali [28], the use of tax incentives appears to have less capacity to stimulate the implementation of solar installations than subsidies do. In this sense, Pablo-Romero et al. [39], consider that several reasons may be behind this occurrence. First, tax deductions involve the need to make a previous investment, for which there may not be sufficient liquidity. Second, tax deductions are not sufficiently attractive because they are quantitatively meager. And finally, if tax incentives have any effect, they must remain in operation for a sufficient period of time.
Finally, low-interest loans and green certificates were used sparingly by EU countries. Nevertheless, some authors consider that green certificates are good instruments to promote solar energy. In that sense, Poullikkas et al. [22] state that an example of a more effective combination of instruments could be a hybrid scheme consisting of FITs with tradable green certificates measures, which will increase the RES penetration and eliminate some possible technical problems.
After analyzing the energy policies of EU-27 countries, we identified 25 countries that have adopted measures to promote PV. The most widespread measure to promote PV use is FITs. The way in which this instrument was implemented recently changed. Several countries decided to apply for diminishing rates linked to the deployment of volumes, in view of the cost reduction of the installations and the higher efficiencies.
The second instrument used to promote PV in the EU-27 countries is the concession of subsidies. In our opinion, subsidies encourage the adoption of specific technologies by reducing the high costs of investment and can be adapted to the specific characteristics of each country and region therein. Nevertheless, subsidies are conditioned by budgetary constraints, meaning that the continuous support for such measures becomes difficult within the current global financial context. As such, EU-27 countries need to be pro-active in looking for new, budget-independent support for the on-going implementation of PV. Their continuity also depends on the severity of budgetary constraints. Therefore, other financially interesting schemes should be considered. For example, the power purchases agreements or the net-metering systems. Twelve EU-27 countries adopted tax measures. Low-interest loans and green certificate systems were only sparingly used.
The author acknowledges the financial support received by the Cátedra de la Economía de la Energía y del Medio Ambiente(Chair of Energy and Environmental Economics)of the Fundació Roger Torné.
The authors declare that there are no conflicts of interest related to this study.
| [1] | Veerapen J., Beerepoot M. (2011) Co-Generation and Renewables. Paris: OECD/IEA. |
| [2] | IEA. (2012) Key World Energy Statistics. Paris: OECD/IEA. |
| [3] | Observer. (2012) Worldwide Electricity Production from Renewable Energy Sources. Paris: Observer. |
| [4] | IEA. (2012) World energy outlook 2012. Renewable energy outlook. Paris: OECD/IEA. |
| [5] | EREC. (2011) Mapping Renewable Energy Pathways towards 2020. Belgium: EREC. |
| [6] |
Pinkse J., Van den Buuse D. (2012) The development and commercialization of solar pv technology in the oil Industry. Energy Policy 40: 11-20. doi: 10.1016/j.enpol.2010.09.029

|
| [7] |
Tsur, Y., Zemel A. (2000) Long-term perspective on the development of solar energy. Solar Energy 68: 379-392. doi: 10.1016/S0038-092X(00)00018-9
|
| [8] |
Gross R., Leach M., Bauen A. (2003). Progress in renewable energy. Environ Int. 29: 105-122. doi: 10.1016/S0160-4120(02)00130-7
|
| [9] | World Energy Assessment. (2000) Energy and the Challenge of Sustainability. New York: United Nations Publications. |
| [10] | EPIA (European Photovoltaic Industry Association). (2013) Global Market Outlook. For Photovoltaics. 2013-1017. Brussels: EPIA. |
| [11] | Greentech Media. (2013) U.S. Solar Market Insight Report - Q1 2013 San Francisco: Greentech Media, Inc. and Solar Energy Industries Association. |
| [12] | Solarbuzz. Module pricing: Retail Price Summary - March 2012 Update, Available from: http://www.solarbuzz.com/facts-and-figures/retail-price-environment/module-prices |
| [13] | IEA. (2012) Renewable Energy. Market Trends and Projections to 2017. Medium-Term 2012 Market Report. Paris: OECD/IEA. |
| [14] |
Bazilian M., Onyeji I., Liebreich M., et al. (2013) Re-considering the economics of photovoltaic power. Renewable Energy 53: 329-338. doi: 10.1016/j.renene.2012.11.029
|
| [15] | EPIA (European Photovoltaic Industry Association). (2013) European Pv Support Schemes Overview. Brussels: EPIA. |
| [16] | EurObserv'ER. (2013) EurObserv’ER database. Paris: EurObserv'ER. |
| [17] | RESLegal. Renewable Energy Policy Database and Support Available from: http://www.res-legal.eu/home/ |
| [18] | Höhne N., Geurts F., Teckenburg E. et al. (2011) EU climate policy tracker 2011. Belgium: Ecofys. |
| [19] | De Jager J., Klessmann C., Stricker E. et al. (2011) Financing Renewable Energy in the European Energy Market Belgium: Ecofys. |
| [20] | European Commision. (2013) Members States' progress reports. 2011 European Belgium: Commission. |
| [21] | European Commission. (2013) Taxes in Europe. Database. Belgium: European Comisión. |
| [22] | Poullikkas A., Kourtis G., Hadjipaschalis I. (2012) An overview of the EU Member States support schemes for the promotion of renewable energy sources, Int J Energy Environ 4: 553-566. |
| [23] | Poullikkas A. (2013) A comparative assessment of net metering and feed in tariff schemes for residential PV systems, Sustain Energy Technol Assess 3: 1-8. |
| [24] |
Haas R., Panzer C., Resch G.., Ragwitz M., Reece G., Held A. (2011) A historical review of promotion strategies for electricity from renewable energy sources in EU countries. Renew Sustain Energy Rev 15: 1003-1034. doi: 10.1016/j.rser.2010.11.015
|
| [25] |
Haas R., Resch G., Panzer C., Busch S., Ragwitz M., Held A. (2011) Efficiency and effectiveness of promotion systems for electricity generation from renewable energy sources - Lessons from EU countries. Energy 36: 2186-2193. doi: 10.1016/j.energy.2010.06.028
|
| [26] |
Campoccia A., Dusonchet L., Telaretti E., Zizzo G. (2009) Comparative analysis of different supporting measures for the production of electrical energy by solar PV and Wind systems: Four representative European cases. Solar Energy 83: 287-297. doi: 10.1016/j.solener.2008.08.001
|
| [27] |
Cansino J. M., Pablo-Romero M.D.P., Román R., et al. (2010) Tax incentives to promote green electricity: An overview of EU-27 countries. Energy Policy 38: 6000-6008. doi: 10.1016/j.enpol.2010.05.055
|
| [28] |
Sarzynski A., Shrimali J. (2012) The impact of state financial incentives on market deployment of solar technology. Energy Policy 46: 550-557. doi: 10.1016/j.enpol.2012.04.032
|
| [29] |
Darghouth N.R., Barbose G., Wiser R. (2011) The impact of rate design and net metering on the bill savings from distributed PV for residential customers in California. Energy Policy 39: 5243-5253. doi: 10.1016/j.enpol.2011.05.040
|
| [30] |
Šúri M., Huld T.A, Dunlop E.D. et al. (2007) Potential of solar electricity generation in the European Union Member States and candidate countries. Solar Energy 81: 1295-1305. doi: 10.1016/j.solener.2006.12.007
|
| [31] | Cherrelle. (2012) Solar Photovoltaic Energy Policy in Europe: Losing Sight of What is Right. Paris: l’Ifri. |
| [32] | García-Alvarez M.T., Mariz-Pérez R.M. (2012) Analysis of the Success of Feed-in Tariff for Renewable Energy Promotion Mechanism in the EU: Lessons from Germany and Spain, Procedia Soc Behav Sci 65: 52-57. |
| [33] | Sandström C. (2013) Are Green Jobs Promising the Moon? Sweden: Timbro. |
| [34] |
Frondel M., Ritter N., Schmidt C.M. (2008) Germany's Solar Cell Promotion: Dark Clouds on the Horizon. Energy Policy 36: 4198-4204. doi: 10.1016/j.enpol.2008.07.026
|
| [35] |
Frondel M., Ritter N., Schmidt C.M, Vance C. (2010) Economic Impacts from the Promotion of Renewable Energy Technologies: The German Experience. Energy Policy 38: 4048-4056. doi: 10.1016/j.enpol.2010.03.029
|
| [36] | Calzada Alvarez G., Jara R.M., Julian J.R.R., Bielsa J.I.G. (2009) Study of the effects on employment of public aid to renewable energy sources, Spain, Universidad Rey Juan Carlos. |
| [37] | Capros P., Mantzos L., Parousos L., Tasios N., Klaassen G.,Van Ierland T. (2011) Analysis of the EU policy package on climate change and renewables, Energy Policy 39: 1476-1485. |
| [38] |
Timilsina G.R, Kurdgelashvili L, and Narbel P.A. (2012) Solar energy: Markets, economics and policies. Renew Sustain Energy Rev 16: 449- 465. doi: 10.1016/j.rser.2011.08.009
|
| [39] |
Pablo-Romero M.P., Sanchez-Braza A., Perez M. (2013) Incentives to promote solar thermal energy in Spain. Renew Sustain Energy Rev 22:198-208. doi: 10.1016/j.rser.2013.01.034
|
| 1. | María del P. Pablo-Romero, Antonio Sánchez-Braza, Jesús Salvador-Ponce, Natalia Sánchez-Labrador, An overview of feed-in tariffs, premiums and tenders to promote electricity from biogas in the EU-28, 2017, 73, 13640321, 1366, 10.1016/j.rser.2017.01.132 | |
| 2. | Sebastian Klaudiusz Tomczak, Anna Skowrońska-Szmer, Jan Jakub Szczygielski, Is Investing in Companies Manufacturing Solar Components a Lucrative Business? A Decision Tree Based Analysis, 2020, 13, 1996-1073, 499, 10.3390/en13020499 | |
| 3. | Mustafa Özcan, Mehmet Yıldırım, The Impact of Capital Subsidy Incentive on Renewable Energy Deployment in Long-Term Power Generation Expansion Planning, 2018, 1, 2636-8129, 1, 10.35377/saucis.01.03.468380 | |
| 4. | Sebastian Klaudiusz Tomczak, Anna Skowrońska-Szmer, Jan Jakub Szczygielski, Is It Possible to Make Money on Investing in Companies Manufacturing Solar Components? A Panel Data Approach, 2021, 14, 1996-1073, 3406, 10.3390/en14123406 | |
| 5. | Fabian Feger, Nicola Pavanini, Doina Radulescu, Welfare and Redistribution in Residential Electricity Markets with Solar Power, 2022, 89, 0034-6527, 3267, 10.1093/restud/rdac005 | |
| 6. | Zhuo Song, Comparative Application Research of Wind Energy and Solar Energy, 2024, 111, 2791-0210, 400, 10.54097/m3rbk085 | |
| 7. | Hongwei Zhang, Zongzhen Li, Huiling Song, Wang Gao, Insight into clean energy market’s role in the connectedness between joint-consumption metals, 2024, 302, 03605442, 131831, 10.1016/j.energy.2024.131831 | |
| 8. | Renato Luise, Annabelle Brisse, Catherine Azzaro-Pantel, Paving the way for low-carbon hydrogen supply chain deployment by exploring the potential of renewable energies and multisectoral hydrogen demand: Case study of France, 2024, 50, 17550084, 100613, 10.1016/j.ref.2024.100613 |


Figures(2) / Tables(4)

María del P. Pablo-Romero. Solar Energy: Incentives to Promote PV in EU27[J]. AIMS Energy, 2013, 1(1): 28-47. doi: 10.3934/energy.2013.1.28

| NREAP Installed Capacity(MWp) | National Roadmap Installed Capacity(MWp) | Installed Capacity(MWp)2001 | Installed Capacity(MWp)2012 | Annual growth rate 2005-12 | % 2020 objective already installed NREAP | % 2020 objective already installed National Roadmap | |
| Source: Own elaboration from EPIA [10] and EurObserv'ER [16] | |||||||
| Germany | 51753 | 39500 | 195 | 32698 | 32.8 | 63.18 | 82.78 |
| Italy | 8000 | 26091 | 20 | 16361 | 79.8 | 204.51 | 62.71 |
| Spain | 8367 | 18625 | 16 | 4517 | 54.7 | 53.98 | 24.25 |
| France | 4860 | 5400 | 14 | 4028 | 65.4 | 82.87 | 74.59 |
| Czech Rep. | 1695 | 2400 | n.a. | 2022 | 129.4 | 119.32 | 84.27 |
| Belgium | 1340 | 3440 | 0.00 | 2650 | 104.7 | 197.76 | 77.03 |
| U. Kingdom | 2680 | 8000 | 3 | 1658 | 65.3 | 61.84 | 20.72 |
| Greece | 2200 | 3000 | 1 | 1543 | 75.9 | 70.15 | 51.44 |
| Bulgaria | 303 | 1510 | n.a. | 933 | 162.5 | 307.99 | 61.80 |
| Portugal | 1000 | 2000 | 1. | 229 | 54.4 | 22.88 | 11.44 |
| Austria | 322 | 6819 | 7 | 422 | 33.2 | 130.96 | 6.18 |
| Netherl and s | 722 | 7103 | 21 | 321 | 20.1 | 44.46 | 4.52 |
| Slovenia | 139 | 94 | n.a. | 217 | 103.3 | 156.37 | 231.22 |
| Slovak Rep. | 300 | 1040 | n.a. | 517 | 147.4 | 172.44 | 49.74 |
| Denmark | 6 | n.a. | 2 | 392 | 64.8 | 6528.33 | n.a. |
| Luxembourg | 84 | 363 | 2 | 47 | 7.2 | 56.15 | 13.01 |
| Sweden | 8 | 4000 | 3 | 24 | 18.8 | 297.83 | 0.60 |
| Cyprus | 192 | 87 | n.a. | 17 | 43.9 | 8.94 | 19.72 |
| Malta | 27 | 24 | n.a. | 19 | 104.0 | 67.37 | 75.22 |
| Finl and | 10 | 3374 | 3 | 11 | 10.8 | 111.70 | 0.33 |
| Hungary | 63 | 162 | n.a. | 4 | 37.9 | 5.93 | 2.31 |
| Pol and | 3 | 786 | n.a. | 3 | 27.0 | 113.17 | 0.43 |
| Romania | 260 | n.a. | n.a. | 6 | 51.6 | 2.46 | n.a. |
| Lithuania | 10 | 53 | n.a. | 6 | 80.1 | 61.00 | 11.51 |
| Irel and | 5 | n.a. | n.a. | 1 | 8.7 | 13.86 | n.a. |
| Latvia | 2 | 48 | n.a. | 2 | 77.0 | 75.50 | 3.17 |
| Estonia | 0 | n.a. | n.a. | 0 | 47.9 | n.a. | n.a. |
| EU 27 | 84381 | 135891 | n.a. | 68648 | 41.2 | 81.35 | 50.52 |
DownLoad: CSV| FIT or FIP | Duration years | Degression Frequency | Net Metering | ||
| Source: Own elaboration from ResLegal [17], EurObserver [16] and EPIA [15] | |||||
| Austria | ✓ | 13 | Not set | Since 2002, the Eco Electricity Act sets feed-in tariffs for different renewable energy sources. The levels of feed-in tariffs are annually adapted. Since 2012, only systems larger than 5 kWp are supported. The tariff for systems on buildings or noise barriers is18.12€Ct/kWh and for other systems is 16.59 €Ct/kWh. | |
| Belgium | ✓ | In Fl and ers and Wallonia regions, net-metering applies to installations with a capacity ≤ 10 kWp. In the Brussels-Capital region, it applies to installation with a capacity ≤ 5 kWp. | |||
| Bulgaria | ✓ | 20 | Not set | The tariff was cut in 2012 by around 50%, and now it is 121.20€/MWh for smaller solar power plants on the ground(from 200kWp to 10MWp) and €120.79€/MWh for larger plants(>10MWp). | |
| Cyprus | ✓ | 20 | Not set | The current feed-in tariff is 0.250€/KWh for smaller plants(up to 150kWp) and 0.21€/KWh for larger installations. | |
| Czech Rep. | ✓ | 20 | Not set | A feed-in tariff can be granted to operators of PV plants with an installed capacity up to 30 kWp on rooftops or facades. From July 1-December 31 2013, the tariff for systems of installed capacity up to 5 kWp is €ct 11.6 per kWh and for systems of installed capacity up to 30 kWp is €ct9.4 per kWh. Nevertheless, plant operators may decide that the electricity they generate should be supported through bonus payments of a statutorily set amount per MWh(systems up to 5 kWp, €ct11.1 per kWh and systems up to 30 kWp, €ct8.8 per kWh). | |
| Denmark | ✓ | 20 | Annually | ✓ | In systems connected to the grid after 21st April 2004, a fixed tariff of 8.0€cent/kWh for ten years and 5.3 €cent/kWh for the following ten years is guaranteed. If the systems have been connected in 2013, the fixed payment is 17€cent/kWh for individual systems, 19 €cent/kWh for collective and 8€cent/kWh for systems with a capacity of more than 400 kWp the first ten years and 5.3€cent/kWh the following ten years. Finally, if the systems are installed after 31st December 2013, the fixed tariff rates will be gradually lower depending on the year of installation. |
| Estonia | |||||
| Finl and | |||||
| France | ✓ | 20 | Quarterly | Electricity from PV installations on buildings lower than 100 kWp is supported through a feed-in tariff. Tariffs are adjusted quarterly based on requests received by the network managers. If the number of projects submitted is in accordance with the planned trajectory, the adjustment will be a decrease in the rate of purchase of 2.6%. If the flow of new projects is less important, the decline will be less pronounced or even zero.For installation on buildings that is higher than 100 kWp and for power ground, the device is based on tenders. Offers meeting this specification are selected on the criterion of energy prices proposed by the applicant. | |
| Germany | ✓ | 20 | Monthly | The Federal Network Agency regularly updates the amount of newly installed capacity and the revised feed-in tariffs and degression rates. Ground-mounted and rooftop systems > 10 MWp do not receive FIT support. For the rest of installations, FITs are adapted on a monthly basis. The degression of tariffs from February 2013 until/to April 2013 is 2.2% per month, if the installed capacity remains in the corridor(A yearly margin of 2, 500-3, 500 MWp newly installed capacity). If the installed capacity is inferior to that of the corridor, the monthly degression can be partially applied or the FIT can be increased. If the installed capacity is above that of the corridor, the degression can be increased. Only certain shares of the produced electricity are remunerated: 85 % for systems < 10 kWp and 90 % for systems > 10 kWp. | |
| Greece | ✓ | 20-25 | Semester | Since 2012, a decreasing rate was applied and it was adjusted in February and August. For each year from 2015 onwards, the tariffs will be established using the expression1.3*SMP(large interconnected systems) and 1.4*SMP(all other systems), where SMP is the System Marginal Price. | |
| Hungary | ✓ | variable | Not set | FIT level is very low. | |
| Irel and | ✓ | Not set | Not set | Only micro-generation installations countrywide are supported with FIT | |
| Italy | ✓ | 20 | Semester | ✓ | The so-called 5th feed-in scheme(5 Jul. 2012)redefines the rules on support for solar photovoltaic power generation. Now the Italian feed-in tariff scheme decreases each semester. There is a st and ard feed-in tariff for rooftop and ground-mounted systems, which depends on the size of the installation. And other st and ards feeding tariff for self-consumption, PV plants using innovative, technological, feed-in tariff, PV plants using innovative technological self-consumption tariff, concentrating PV plants feed-in tariff and concentrating PV plants self-consumption for PV plants with a nominal power over 1MWp, the Gestore dei Servizi Energeticidoes not purchase the electricity produced, but it pays a feed-in premium that is explained as the difference between the feed-in tariff above and the applicable average electricity market price. This feed-in premium should be increased by some increments. |
| Latvia | |||||
| Lithuania | ✓ | 12 | Not set | Feed-in tariffs for PV are 36€ct/kWh for installation < 30 kWp, 34€ct/kWh for installation between 30-100 kWp and 26€ct/kWh if the installation is higher than 100 kWp. | |
| Luxembourg | ✓ | 15 | Yearly | Only for on-grid rooftop installations. The tariff is 26.4 €ct/kWh. Since 2013, a degression rate was applied. | |
| Malta | ✓ | 20 | Not set | The tariffs for electricity generated during the first six months of 2013 are €0.17 per kWh for installations located outside residential or domestic premises, €0.18 per kWh for roof-mounted installations with an installed capacity of less than 1000 kWp, €0.17 per kWh for roof-mounted installations with an installed capacity of 1000 kWp or more, €0.17 per kWh for ground-mounted installations with an installed capacity of less than 1000 kWp and € 0.16 per kWh for ground-mounted installations with an installed capacity of 1000 kWp or more. | |
| Netherl and s | ✓ | ✓ | The SDE+ scheme grants a premium on top of the market price to the producers of renewable energy in order to compensate the difference between the wholesale price of electricity from fossil sources and the price of electricity from renewable sources. Only PV installations with a capacity greater than or equal to 15 kWp are eligible. The support is made available in 6 stages. The amount of support at stage 6 is €ct14.8 per kWh. | ||
| Pol and | |||||
| Portugal | ✓ | 15 | The indicative average rate is €257 per MWh. There are special tariffs for electricity generated from renewable sources by so-called microproduction units, for electricity combined with heating systems and for small power plants(miniproduction units), which use a single production technology. The reference tariff in 2013 for PV microproduction units is €196/MWh and for miniproduction units is €151/MWh. The tariffs for miniproduction and miniproduction units are subjected to a degression rate, they change after the first seven years. | ||
| Romania | |||||
| Slovak Rep. | ✓ | 15 | Not set | The feed-in tariff consists of two parts: the price of electricity for/regarding losses(market price) and a surcharge. For PV plants, the surcharge applies only to roof-top or facade-integrated plants up to 100 kWp.(€ct 11.911 per kWh). Since July 2013, the tariff only applies to installations up to 30 kWp. | |
| Slovenia | ✓ | 15 | Monthly | In Slovenia, PV power plants are eligible for a feed-in tariff if their capacity does not exceed 5 MWp and for a premium if the systems are larger than 5 MWp. The tariff rates and the amount of the premium tariff are calculated on a monthly basis, which implies a monthly degression of the reference cost by 2 %. | |
| Spain | M | 25 | Semester | Since 29th January 2012, a moratorium was set by the government and the registry is closed for the moment. The suspension will not affect plants that are already receiving payments, but it will suspend/stop the pre-allocation process. Since February 2013, the updating method of tariffsis retroactively linked to a specific index for all plants. | |
| Sweden | |||||
| Un. Kingdom | ✓ | 20 | Quarterly | Accredited producers whose plants have a capacity of less than 5 MWp can sell their electricity at fixed tariff rates. These rates depend on efficiency parameters(higher-middle and lower) and capacity. | |
DownLoad: CSV| Member State | Subsidies/Direct Grant |
| Source: Own elaboration from ResLegal [17], EurObserver [16] and EPIA [15] | |
| Austria | The Eco Electricity Act enables an investment grant for roof-mounted systems of 30% of investment costs, with a maximum of 200€/kWp for systems bigger than 5 kWp. Systems smaller than 5 kWp are supported through the Climate and Energy Fund. The investment support fund for the smaller systems is exclusively targeting private households. Support levels are €300 kWp for rooftop or ground-mounted installations and €400 kWp for building integrated installations. |
| Belgium | There are different regional subsidies to promote PV. Among them, investment assistance for companies which develop environmental projects and energy efficient technologies as a percentage of the eligible costs; energy subsidies for residential, industrial and service sector buildings, and finally, the Walloon region provides subsidies to support initiatives to reduce the energy consumption of public buildings/institutions. |
| Bulgaria | The Operational Program "Environment"(OPE), which allocates investment grants from the Cohesion Fund to individual and large projects, grants subsidies to off-grid systems. The amounts of subsidies range between 100% of the expenses costs for public organizations and 50% for large enterprises. |
| Cyprus | Grants are allocated to encourage the installation of off-grid PV installations. Grants are 55% of the total investment for domestic and non-profit organizations and 40% for commercial public entities. |
| Czech Rep. | The OPE grants subsidize up to 85% of a project's total eligible expenditures for building-integrated PV installations. The Operational Program “Enterprise and Innovations”, which allocates investment grants from the European Regional Development Fund, grants subsidies for projects in the field of renewable energy and under calls for applications in developing regions. |
| Denmark | Subsidies are provided for small PV building integrated installations connected to the grid. |
| Finl and | A subsidy for PV systemscan be provided to private companies, municipalities or consortium of entities. The support level is up to 30% of the investment project costs and 40% of the assessment project costs. If the investment project involves a new technology then an additional 10% subsidy may be granted. Also an additional 10% may be granted if the assessment project is carried out by municipalities ormicro-companies. |
| Germany | Subsidies are regionally regulated. They are in place except for residential sector. |
| Hungary | The OPE grants all off-grid PV-installations and on-grid PV-installations up to 500 kWp. |
| Lithuania | Lithuanian Environment Investment Fund grants investments covering up to 80% of the entire eligible expenses for a project. |
| Luxembourg | The installation of solar systems in private households is incentivized/highlighted by investment grants. Since 2013, the grant is 20% per installation for roof or façade systems up to 30 kWp and to a maximum of €500/kWp. Companies may also receive grants for investments in renewable electricity generation for self-consumption up to 50% of the investment. For local authorities’ buildings, there is also a grant of 15% of investment cost up to €900/kWp. |
| Netherl and s | A subsidy for PV systemscan be provided to private households. Consumers will receive 15% on the hardware of solar systems from 2 July until the end of 2013, but not more than €650 per installation is subsidized. |
| Slovenia | The Ministry of Agriculture and the Environment supports investments tendering for “Diversification into non-agricultural activities”. Grants are subjected to a maximum of 70% of the investment costs in PV power plants. Also, The Ministry for Infrastructure and Spatial Planning awards subsidies, state aid and “de minimis” aid to cover some of the costs related to the use of renewable energy instead of traditional energy sources. |
| Sweden | Subsidy is given to all types of actors and all types of grid connected PV and hybrid PV-solarthermal systems. As of the 1st February, 2013, the subsidy can only make up 35 % of the investment cost. The investment cost upon which the subsidy is calculated is 4, 300€ per installed kWp peak capacity for PV systems. For hybrid PV-solar thermal systems, it is 10, 500€ per installed kWp. |
| Un. Kingdom | In Northern Irel and , There is a grant for the installation of PV systems, for SMEs(a companyemployingless than 250 employees and a turnover of less than €50 million). The(grant)offer is 20% of the relevant eligible costs of installation of a PV system up to a maximum of £3000.The fund is open for application forms as of the 1st April, 2013. |
DownLoad: CSV| FITs, FIPs | subsidies | Tax Incentives | Green Certificates | Soft Loans | Installed Capacity(MWp)2012 | Annual growth rate 2005-12 | % 2020 objective already installed NREAP | |
| Source: Own elaboration | ||||||||
| Germany | ✓ | ✓ | ✓ | ✓ | 32698 | 32.8 | 63.18 | |
| Italy | ✓ | 16361 | 79.8 | 204.51 | ||||
| Spain | M | ✓ | 4517 | 54.7 | 53.98 | |||
| France | ✓ | ✓ | 4028 | 65.4 | 82.87 | |||
| Czech Rep. | ✓ | ✓ | 2022 | 129.5 | 119.32 | |||
| Belgium | ✓ | ✓ | ✓ | 2650 | 104.7 | 197.76 | ||
| U. Kingdom | ✓ | ✓ | ✓ | ✓ | 1657 | 65.3 | 61.84 | |
| Greece | ✓ | 1543 | 75.9 | 70.15 | ||||
| Bulgaria | ✓ | ✓ | ✓ | ✓ | 933 | 162.5 | 307.99 | |
| Portugal | ✓ | 229 | 54.4 | 22.88 | ||||
| Austria | ✓ | ✓ | 422 | 33.2 | 130.96 | |||
| Netherl and s | ✓ | ✓ | ✓ | ✓ | 321 | 20.2 | 44.46 | |
| Slovenia | ✓ | ✓ | ✓ | 217 | 103.3 | 156.37 | ||
| Slovak Rep. | ✓ | ✓ | 517 | 147.5 | 172.44 | |||
| Denmark | ✓ | ✓ | ✓ | 392 | 64.8 | 6528.33 | ||
| Luxembourg | ✓ | ✓ | ✓ | 47 | 7.2 | 56.15 | ||
| Sweden | ✓ | ✓ | 24 | 18.9 | 297.83 | |||
| Cyprus | ✓ | ✓ | 17 | 43.9 | 8.94 | |||
| Malta | ✓ | 19 | 104.0 | 67.37 | ||||
| Finl and | ✓ | 11 | 10.8 | 111.70 | ||||
| Hungary | ✓ | ✓ | ✓ | 4 | 37.9 | 5.93 | ||
| Pol and | ✓ | ✓ | 3 | 27.0 | 113.17 | |||
| Romania | ✓ | 6 | 51.6 | 2.46 | ||||
| Lithuania | ✓ | ✓ | 6 | 80.1 | 61.00 | |||
| Irel and | ✓ | ✓ | 1 | 8.7 | 13.86 | |||
| Latvia | 2 | 77.0 | 75.50 | |||||
| Estonia | 0 | 47.9 | n.a. | |||||
| EU-27 | 68647 | 41.2 | 81.35 | |||||
DownLoad: CSV| NREAP Installed Capacity(MWp) | National Roadmap Installed Capacity(MWp) | Installed Capacity(MWp)2001 | Installed Capacity(MWp)2012 | Annual growth rate 2005-12 | % 2020 objective already installed NREAP | % 2020 objective already installed National Roadmap | |
| Source: Own elaboration from EPIA [10] and EurObserv'ER [16] | |||||||
| Germany | 51753 | 39500 | 195 | 32698 | 32.8 | 63.18 | 82.78 |
| Italy | 8000 | 26091 | 20 | 16361 | 79.8 | 204.51 | 62.71 |
| Spain | 8367 | 18625 | 16 | 4517 | 54.7 | 53.98 | 24.25 |
| France | 4860 | 5400 | 14 | 4028 | 65.4 | 82.87 | 74.59 |
| Czech Rep. | 1695 | 2400 | n.a. | 2022 | 129.4 | 119.32 | 84.27 |
| Belgium | 1340 | 3440 | 0.00 | 2650 | 104.7 | 197.76 | 77.03 |
| U. Kingdom | 2680 | 8000 | 3 | 1658 | 65.3 | 61.84 | 20.72 |
| Greece | 2200 | 3000 | 1 | 1543 | 75.9 | 70.15 | 51.44 |
| Bulgaria | 303 | 1510 | n.a. | 933 | 162.5 | 307.99 | 61.80 |
| Portugal | 1000 | 2000 | 1. | 229 | 54.4 | 22.88 | 11.44 |
| Austria | 322 | 6819 | 7 | 422 | 33.2 | 130.96 | 6.18 |
| Netherl and s | 722 | 7103 | 21 | 321 | 20.1 | 44.46 | 4.52 |
| Slovenia | 139 | 94 | n.a. | 217 | 103.3 | 156.37 | 231.22 |
| Slovak Rep. | 300 | 1040 | n.a. | 517 | 147.4 | 172.44 | 49.74 |
| Denmark | 6 | n.a. | 2 | 392 | 64.8 | 6528.33 | n.a. |
| Luxembourg | 84 | 363 | 2 | 47 | 7.2 | 56.15 | 13.01 |
| Sweden | 8 | 4000 | 3 | 24 | 18.8 | 297.83 | 0.60 |
| Cyprus | 192 | 87 | n.a. | 17 | 43.9 | 8.94 | 19.72 |
| Malta | 27 | 24 | n.a. | 19 | 104.0 | 67.37 | 75.22 |
| Finl and | 10 | 3374 | 3 | 11 | 10.8 | 111.70 | 0.33 |
| Hungary | 63 | 162 | n.a. | 4 | 37.9 | 5.93 | 2.31 |
| Pol and | 3 | 786 | n.a. | 3 | 27.0 | 113.17 | 0.43 |
| Romania | 260 | n.a. | n.a. | 6 | 51.6 | 2.46 | n.a. |
| Lithuania | 10 | 53 | n.a. | 6 | 80.1 | 61.00 | 11.51 |
| Irel and | 5 | n.a. | n.a. | 1 | 8.7 | 13.86 | n.a. |
| Latvia | 2 | 48 | n.a. | 2 | 77.0 | 75.50 | 3.17 |
| Estonia | 0 | n.a. | n.a. | 0 | 47.9 | n.a. | n.a. |
| EU 27 | 84381 | 135891 | n.a. | 68648 | 41.2 | 81.35 | 50.52 |
| FIT or FIP | Duration years | Degression Frequency | Net Metering | ||
| Source: Own elaboration from ResLegal [17], EurObserver [16] and EPIA [15] | |||||
| Austria | ✓ | 13 | Not set | Since 2002, the Eco Electricity Act sets feed-in tariffs for different renewable energy sources. The levels of feed-in tariffs are annually adapted. Since 2012, only systems larger than 5 kWp are supported. The tariff for systems on buildings or noise barriers is18.12€Ct/kWh and for other systems is 16.59 €Ct/kWh. | |
| Belgium | ✓ | In Fl and ers and Wallonia regions, net-metering applies to installations with a capacity ≤ 10 kWp. In the Brussels-Capital region, it applies to installation with a capacity ≤ 5 kWp. | |||
| Bulgaria | ✓ | 20 | Not set | The tariff was cut in 2012 by around 50%, and now it is 121.20€/MWh for smaller solar power plants on the ground(from 200kWp to 10MWp) and €120.79€/MWh for larger plants(>10MWp). | |
| Cyprus | ✓ | 20 | Not set | The current feed-in tariff is 0.250€/KWh for smaller plants(up to 150kWp) and 0.21€/KWh for larger installations. | |
| Czech Rep. | ✓ | 20 | Not set | A feed-in tariff can be granted to operators of PV plants with an installed capacity up to 30 kWp on rooftops or facades. From July 1-December 31 2013, the tariff for systems of installed capacity up to 5 kWp is €ct 11.6 per kWh and for systems of installed capacity up to 30 kWp is €ct9.4 per kWh. Nevertheless, plant operators may decide that the electricity they generate should be supported through bonus payments of a statutorily set amount per MWh(systems up to 5 kWp, €ct11.1 per kWh and systems up to 30 kWp, €ct8.8 per kWh). | |
| Denmark | ✓ | 20 | Annually | ✓ | In systems connected to the grid after 21st April 2004, a fixed tariff of 8.0€cent/kWh for ten years and 5.3 €cent/kWh for the following ten years is guaranteed. If the systems have been connected in 2013, the fixed payment is 17€cent/kWh for individual systems, 19 €cent/kWh for collective and 8€cent/kWh for systems with a capacity of more than 400 kWp the first ten years and 5.3€cent/kWh the following ten years. Finally, if the systems are installed after 31st December 2013, the fixed tariff rates will be gradually lower depending on the year of installation. |
| Estonia | |||||
| Finl and | |||||
| France | ✓ | 20 | Quarterly | Electricity from PV installations on buildings lower than 100 kWp is supported through a feed-in tariff. Tariffs are adjusted quarterly based on requests received by the network managers. If the number of projects submitted is in accordance with the planned trajectory, the adjustment will be a decrease in the rate of purchase of 2.6%. If the flow of new projects is less important, the decline will be less pronounced or even zero.For installation on buildings that is higher than 100 kWp and for power ground, the device is based on tenders. Offers meeting this specification are selected on the criterion of energy prices proposed by the applicant. | |
| Germany | ✓ | 20 | Monthly | The Federal Network Agency regularly updates the amount of newly installed capacity and the revised feed-in tariffs and degression rates. Ground-mounted and rooftop systems > 10 MWp do not receive FIT support. For the rest of installations, FITs are adapted on a monthly basis. The degression of tariffs from February 2013 until/to April 2013 is 2.2% per month, if the installed capacity remains in the corridor(A yearly margin of 2, 500-3, 500 MWp newly installed capacity). If the installed capacity is inferior to that of the corridor, the monthly degression can be partially applied or the FIT can be increased. If the installed capacity is above that of the corridor, the degression can be increased. Only certain shares of the produced electricity are remunerated: 85 % for systems < 10 kWp and 90 % for systems > 10 kWp. | |
| Greece | ✓ | 20-25 | Semester | Since 2012, a decreasing rate was applied and it was adjusted in February and August. For each year from 2015 onwards, the tariffs will be established using the expression1.3*SMP(large interconnected systems) and 1.4*SMP(all other systems), where SMP is the System Marginal Price. | |
| Hungary | ✓ | variable | Not set | FIT level is very low. | |
| Irel and | ✓ | Not set | Not set | Only micro-generation installations countrywide are supported with FIT | |
| Italy | ✓ | 20 | Semester | ✓ | The so-called 5th feed-in scheme(5 Jul. 2012)redefines the rules on support for solar photovoltaic power generation. Now the Italian feed-in tariff scheme decreases each semester. There is a st and ard feed-in tariff for rooftop and ground-mounted systems, which depends on the size of the installation. And other st and ards feeding tariff for self-consumption, PV plants using innovative, technological, feed-in tariff, PV plants using innovative technological self-consumption tariff, concentrating PV plants feed-in tariff and concentrating PV plants self-consumption for PV plants with a nominal power over 1MWp, the Gestore dei Servizi Energeticidoes not purchase the electricity produced, but it pays a feed-in premium that is explained as the difference between the feed-in tariff above and the applicable average electricity market price. This feed-in premium should be increased by some increments. |
| Latvia | |||||
| Lithuania | ✓ | 12 | Not set | Feed-in tariffs for PV are 36€ct/kWh for installation < 30 kWp, 34€ct/kWh for installation between 30-100 kWp and 26€ct/kWh if the installation is higher than 100 kWp. | |
| Luxembourg | ✓ | 15 | Yearly | Only for on-grid rooftop installations. The tariff is 26.4 €ct/kWh. Since 2013, a degression rate was applied. | |
| Malta | ✓ | 20 | Not set | The tariffs for electricity generated during the first six months of 2013 are €0.17 per kWh for installations located outside residential or domestic premises, €0.18 per kWh for roof-mounted installations with an installed capacity of less than 1000 kWp, €0.17 per kWh for roof-mounted installations with an installed capacity of 1000 kWp or more, €0.17 per kWh for ground-mounted installations with an installed capacity of less than 1000 kWp and € 0.16 per kWh for ground-mounted installations with an installed capacity of 1000 kWp or more. | |
| Netherl and s | ✓ | ✓ | The SDE+ scheme grants a premium on top of the market price to the producers of renewable energy in order to compensate the difference between the wholesale price of electricity from fossil sources and the price of electricity from renewable sources. Only PV installations with a capacity greater than or equal to 15 kWp are eligible. The support is made available in 6 stages. The amount of support at stage 6 is €ct14.8 per kWh. | ||
| Pol and | |||||
| Portugal | ✓ | 15 | The indicative average rate is €257 per MWh. There are special tariffs for electricity generated from renewable sources by so-called microproduction units, for electricity combined with heating systems and for small power plants(miniproduction units), which use a single production technology. The reference tariff in 2013 for PV microproduction units is €196/MWh and for miniproduction units is €151/MWh. The tariffs for miniproduction and miniproduction units are subjected to a degression rate, they change after the first seven years. | ||
| Romania | |||||
| Slovak Rep. | ✓ | 15 | Not set | The feed-in tariff consists of two parts: the price of electricity for/regarding losses(market price) and a surcharge. For PV plants, the surcharge applies only to roof-top or facade-integrated plants up to 100 kWp.(€ct 11.911 per kWh). Since July 2013, the tariff only applies to installations up to 30 kWp. | |
| Slovenia | ✓ | 15 | Monthly | In Slovenia, PV power plants are eligible for a feed-in tariff if their capacity does not exceed 5 MWp and for a premium if the systems are larger than 5 MWp. The tariff rates and the amount of the premium tariff are calculated on a monthly basis, which implies a monthly degression of the reference cost by 2 %. | |
| Spain | M | 25 | Semester | Since 29th January 2012, a moratorium was set by the government and the registry is closed for the moment. The suspension will not affect plants that are already receiving payments, but it will suspend/stop the pre-allocation process. Since February 2013, the updating method of tariffsis retroactively linked to a specific index for all plants. | |
| Sweden | |||||
| Un. Kingdom | ✓ | 20 | Quarterly | Accredited producers whose plants have a capacity of less than 5 MWp can sell their electricity at fixed tariff rates. These rates depend on efficiency parameters(higher-middle and lower) and capacity. | |
| Member State | Subsidies/Direct Grant |
| Source: Own elaboration from ResLegal [17], EurObserver [16] and EPIA [15] | |
| Austria | The Eco Electricity Act enables an investment grant for roof-mounted systems of 30% of investment costs, with a maximum of 200€/kWp for systems bigger than 5 kWp. Systems smaller than 5 kWp are supported through the Climate and Energy Fund. The investment support fund for the smaller systems is exclusively targeting private households. Support levels are €300 kWp for rooftop or ground-mounted installations and €400 kWp for building integrated installations. |
| Belgium | There are different regional subsidies to promote PV. Among them, investment assistance for companies which develop environmental projects and energy efficient technologies as a percentage of the eligible costs; energy subsidies for residential, industrial and service sector buildings, and finally, the Walloon region provides subsidies to support initiatives to reduce the energy consumption of public buildings/institutions. |
| Bulgaria | The Operational Program "Environment"(OPE), which allocates investment grants from the Cohesion Fund to individual and large projects, grants subsidies to off-grid systems. The amounts of subsidies range between 100% of the expenses costs for public organizations and 50% for large enterprises. |
| Cyprus | Grants are allocated to encourage the installation of off-grid PV installations. Grants are 55% of the total investment for domestic and non-profit organizations and 40% for commercial public entities. |
| Czech Rep. | The OPE grants subsidize up to 85% of a project's total eligible expenditures for building-integrated PV installations. The Operational Program “Enterprise and Innovations”, which allocates investment grants from the European Regional Development Fund, grants subsidies for projects in the field of renewable energy and under calls for applications in developing regions. |
| Denmark | Subsidies are provided for small PV building integrated installations connected to the grid. |
| Finl and | A subsidy for PV systemscan be provided to private companies, municipalities or consortium of entities. The support level is up to 30% of the investment project costs and 40% of the assessment project costs. If the investment project involves a new technology then an additional 10% subsidy may be granted. Also an additional 10% may be granted if the assessment project is carried out by municipalities ormicro-companies. |
| Germany | Subsidies are regionally regulated. They are in place except for residential sector. |
| Hungary | The OPE grants all off-grid PV-installations and on-grid PV-installations up to 500 kWp. |
| Lithuania | Lithuanian Environment Investment Fund grants investments covering up to 80% of the entire eligible expenses for a project. |
| Luxembourg | The installation of solar systems in private households is incentivized/highlighted by investment grants. Since 2013, the grant is 20% per installation for roof or façade systems up to 30 kWp and to a maximum of €500/kWp. Companies may also receive grants for investments in renewable electricity generation for self-consumption up to 50% of the investment. For local authorities’ buildings, there is also a grant of 15% of investment cost up to €900/kWp. |
| Netherl and s | A subsidy for PV systemscan be provided to private households. Consumers will receive 15% on the hardware of solar systems from 2 July until the end of 2013, but not more than €650 per installation is subsidized. |
| Slovenia | The Ministry of Agriculture and the Environment supports investments tendering for “Diversification into non-agricultural activities”. Grants are subjected to a maximum of 70% of the investment costs in PV power plants. Also, The Ministry for Infrastructure and Spatial Planning awards subsidies, state aid and “de minimis” aid to cover some of the costs related to the use of renewable energy instead of traditional energy sources. |
| Sweden | Subsidy is given to all types of actors and all types of grid connected PV and hybrid PV-solarthermal systems. As of the 1st February, 2013, the subsidy can only make up 35 % of the investment cost. The investment cost upon which the subsidy is calculated is 4, 300€ per installed kWp peak capacity for PV systems. For hybrid PV-solar thermal systems, it is 10, 500€ per installed kWp. |
| Un. Kingdom | In Northern Irel and , There is a grant for the installation of PV systems, for SMEs(a companyemployingless than 250 employees and a turnover of less than €50 million). The(grant)offer is 20% of the relevant eligible costs of installation of a PV system up to a maximum of £3000.The fund is open for application forms as of the 1st April, 2013. |
| FITs, FIPs | subsidies | Tax Incentives | Green Certificates | Soft Loans | Installed Capacity(MWp)2012 | Annual growth rate 2005-12 | % 2020 objective already installed NREAP | |
| Source: Own elaboration | ||||||||
| Germany | ✓ | ✓ | ✓ | ✓ | 32698 | 32.8 | 63.18 | |
| Italy | ✓ | 16361 | 79.8 | 204.51 | ||||
| Spain | M | ✓ | 4517 | 54.7 | 53.98 | |||
| France | ✓ | ✓ | 4028 | 65.4 | 82.87 | |||
| Czech Rep. | ✓ | ✓ | 2022 | 129.5 | 119.32 | |||
| Belgium | ✓ | ✓ | ✓ | 2650 | 104.7 | 197.76 | ||
| U. Kingdom | ✓ | ✓ | ✓ | ✓ | 1657 | 65.3 | 61.84 | |
| Greece | ✓ | 1543 | 75.9 | 70.15 | ||||
| Bulgaria | ✓ | ✓ | ✓ | ✓ | 933 | 162.5 | 307.99 | |
| Portugal | ✓ | 229 | 54.4 | 22.88 | ||||
| Austria | ✓ | ✓ | 422 | 33.2 | 130.96 | |||
| Netherl and s | ✓ | ✓ | ✓ | ✓ | 321 | 20.2 | 44.46 | |
| Slovenia | ✓ | ✓ | ✓ | 217 | 103.3 | 156.37 | ||
| Slovak Rep. | ✓ | ✓ | 517 | 147.5 | 172.44 | |||
| Denmark | ✓ | ✓ | ✓ | 392 | 64.8 | 6528.33 | ||
| Luxembourg | ✓ | ✓ | ✓ | 47 | 7.2 | 56.15 | ||
| Sweden | ✓ | ✓ | 24 | 18.9 | 297.83 | |||
| Cyprus | ✓ | ✓ | 17 | 43.9 | 8.94 | |||
| Malta | ✓ | 19 | 104.0 | 67.37 | ||||
| Finl and | ✓ | 11 | 10.8 | 111.70 | ||||
| Hungary | ✓ | ✓ | ✓ | 4 | 37.9 | 5.93 | ||
| Pol and | ✓ | ✓ | 3 | 27.0 | 113.17 | |||
| Romania | ✓ | 6 | 51.6 | 2.46 | ||||
| Lithuania | ✓ | ✓ | 6 | 80.1 | 61.00 | |||
| Irel and | ✓ | ✓ | 1 | 8.7 | 13.86 | |||
| Latvia | 2 | 77.0 | 75.50 | |||||
| Estonia | 0 | 47.9 | n.a. | |||||
| EU-27 | 68647 | 41.2 | 81.35 | |||||


