


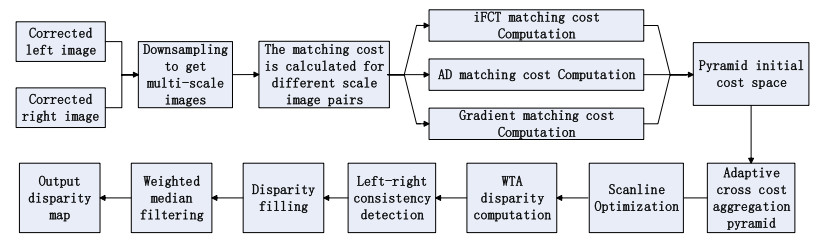
Figure 1.
Overall process of the iFCTACP algorithm.
Citation: Sonia Shastri, Ravichandra Vemuri, Nuri Gueven, Madhur D. Shastri, Rajaraman Eri. Molecular mechanisms of intestinal inflammation leading to colorectal cancer[J]. AIMS Biophysics, 2017, 4(1): 152-177. doi: 10.3934/biophy.2017.1.152
| [1] | Quanjun Wu, Zhu Zhang, Ranran Li, Yufan Liu, Yuan Chai . Regulatory role of excitatory interneurons by combining electrical stimulation for absence seizures in the coupled thalamocortical model. Electronic Research Archive, 2024, 32(3): 1533-1550. doi: 10.3934/era.2024070 |
| [2] | Bojian Chen, Wenbin Wu, Zhezhou Li, Tengfei Han, Zhuolei Chen, Weihao Zhang . Attention-guided cross-modal multiple feature aggregation network for RGB-D salient object detection. Electronic Research Archive, 2024, 32(1): 643-669. doi: 10.3934/era.2024031 |
| [3] | Asma Maiza, Raouf Ziadi, Mohammed A. Saleh, Abdulgader Z. Almaymuni . An improved conjugate gradient algorithm by adapting a new line search technique. Electronic Research Archive, 2025, 33(4): 2148-2171. doi: 10.3934/era.2025094 |
| [4] | Chao Ma, Hong Fu, Pengcheng Lu, Hongpeng Lu . Multi-objective crashworthiness design optimization of a rollover protective structure by an improved constraint-handling technique. Electronic Research Archive, 2023, 31(7): 4278-4302. doi: 10.3934/era.2023218 |
| [5] | Liping Fan, Pengju Yang . Load forecasting of microgrid based on an adaptive cuckoo search optimization improved neural network. Electronic Research Archive, 2024, 32(11): 6364-6378. doi: 10.3934/era.2024296 |
| [6] | Zhenyue Wang, Guowu Yuan, Hao Zhou, Yi Ma, Yutang Ma, Dong Chen . Improved YOLOv7 model for insulator defect detection. Electronic Research Archive, 2024, 32(4): 2880-2896. doi: 10.3934/era.2024131 |
| [7] | Jinjiang Liu, Yuqin Li, Wentao Li, Zhenshuang Li, Yihua Lan . Multiscale lung nodule segmentation based on 3D coordinate attention and edge enhancement. Electronic Research Archive, 2024, 32(5): 3016-3037. doi: 10.3934/era.2024138 |
| [8] | Rongrong Bi, Liang Guo, Botao Yang, Jinke Wang, Changfa Shi . 2.5D cascaded context-based network for liver and tumor segmentation from CT images. Electronic Research Archive, 2023, 31(8): 4324-4345. doi: 10.3934/era.2023221 |
| [9] | Denghui Wu, Zhen-Hui Bu . Multidimensional stability of pyramidal traveling fronts in degenerate Fisher-KPP monostable and combustion equations. Electronic Research Archive, 2021, 29(6): 3721-3740. doi: 10.3934/era.2021058 |
| [10] | Jinmeng Wu, HanYu Hong, YaoZong Zhang, YanBin Hao, Lei Ma, Lei Wang . Word-level dual channel with multi-head semantic attention interaction for community question answering. Electronic Research Archive, 2023, 31(10): 6012-6026. doi: 10.3934/era.2023306 |
The topic of stereo matching has witnessed an upsurge in popularity in the field of computer vision, and has been widely applied in 3D reconstruction [1], 3D object detection [2], autonomous driving [3], and so on. The process of stereo matching includes obtaining disparity information from the left and right images taken by the binocular stereo camera and then deducing depth information, etc. Currently, there are a number of stereo matching algorithms. According to the differences in constraint range, these algorithms can be divided into two categories: local stereo matching algorithms and global stereo matching algorithms. Local stereo matching algorithms estimate the disparity based on the local information in the pixel window and compute the local optimal solutions to the disparity. They are characterized by good real-time performance. The commonly used local stereo matching algorithms include Variable Support Window (VSW), Adaptive Support Weight (ASW), and multi-window algorithm [4]. Different from the local stereo matching, global stereo matching algorithms compute the disparity value by finding the minimum value of the constructed global energy function with a high degree of matching accuracy but are computationally complex. Common global stereo matching algorithms encompass belief propagation (BP) [5,6], dynamic programming (DP) [7], and graph cut (GC) algorithms [8]. Scharstein and Szeliski [9] summarized the previous stereo matching algorithms and proposed that their process be divided into four steps: matching cost computation, cost aggregation, disparity computation, and disparity refinement. Among them, cost computation and cost aggregation contribute to the accuracy of matching.
The matching cost is to measure the correlation between the pixels to be matched and the candidate pixels. Kok and Rajendran [10] made detailed comments on frequently-used measures: sum of squares difference (SSD), sum of absolute difference (SAD), normalized cross-correlation (NCC), and rank transform (RT). By means of these methods, we can presume that each left-image pixel and its corresponding right-image pixel have the same intensity values. Therefore, they cannot be utilized for outdoor images with remarkable differences in lighting intensity. Hirschmuller [11] used the probability distribution function as a matching measure to compute the matching cost. But the disadvantages are obvious due to the complex principle, the computing inefficiency, and the poor anti-interference performance. Stein [12] showed that using census transform (CT) to compute the matching cost can effectively improve the anti-interference performance in the cost volume, but the matching effect in the weak texture region is not satisfactory. Mei et al. [13] proposed a method combining the SAD and CT. This method overcomes the poor matching effect of the CT in the weak texture regions because it combines the advantages of the SAD and the CT and guarantees high matching accuracy.
The fundamental purpose of cost aggregation is to ensure the cost value to accurately reflect the correlation between pixels. The aggregation cost of local stereo matching is deeply affected by the aggregation window. The large window easily leads to error matching in the regions with discontinuous depth, while the small one results in error matching in the weak texture regions. To solve those problems, Zhang et al. [14] proposed forming a local cross adaptive window for cost aggregation through double thresholds of color and distance, which is less effective in matching in weak texture regions but is less time-consuming. Although the window of the filter window proposed by Hosni et al. [15] is fixed, its advantage is that the computational complexity is independent of the window size. By analyzing those cost aggregation methods, it can be found that they only perform cost aggregation on a single scale layer, without considering that the feature information of the obtained object is a coarse-to-fine process, which results in a higher error matching rate in the weak texture region as a whole. Therefore, Zhang et al. [16] simulated the human visual system and proposed to build a cross-scale cost aggregation (CSCA) framework to incorporate the cost volume of multiple scales to obtain the target cost volume. Although this framework contributes to a good disparity map, the demerits of the high error matching rate in weak texture regions and the time-consuming process still remain. Later, Pang et al. [17] proposed an adaptive multi-scale cost body construction and aggregation stereo matching algorithm, which has strong adaptability to different texture regions and good robustness, but the matching accuracy of this algorithm in the parallax discontinuity region needs to be improved.
Although research on stereo matching algorithms have made great progress in recent years [18,19,20,21], matching at the correct disparity is challenging in real life due to the photometric and geometric distortions introduced by the change of viewpoint and by ambiguities caused by low texture or repetitive patterns in the scene. To solve the above problems, a novel algorithm, iFCTACP, which multiple matching cost measurement methods and an adaptive cross pyramid structure is proposed. The algorithm first implements the fusion of truncated color absolute difference, truncated gradient absolute difference, and the iFCT (an improved four-moded census transform proposed in this paper). Second, in ACP (an adaptive cross pyramid structure proposed in this paper), gradient information is used to distinguish between weak texture regions and rich texture regions, and a new adaptive window is constructed by using a variable color threshold according to the region of pixels.
In summary, the contributions of this paper are threefold:
1) A novel cost metric, iFCT, is presented, which is robust to noise such as illumination and exposure. It can not only improve the matching accuracy but also effectively solve the problem of center pixel distortion. It is a supplement and amendment to the traditional cost metric methods.
2) A multi-layer adaptive cross pyramid (ACP) structure is proposed for cost aggregation. The ACP can realize the cross-regional connection and information transmission, significantly reducing the possibility of mismatch due to lack of corresponding matching information. This is an improvement on the shortcomings of traditional cross, especially in weak texture regions.
3) Qualitative and quantitative experiments demonstrate the effectiveness of the algorithm, iFCTACP. The optimal parameters are also explored for different situations.
The input of the proposed algorithm is an epipolar corrected image. The process consists of four steps: 1) Downsample the input image to obtain multi-scale image, and compute the cost of each scale image by the absolute difference of intensity (AD), iFCT, and gradient fusion, to generate the pyramid initial cost volume. 2) Carry out adaptive cross cost aggregation based on the initial pyramid cost volume. Then, apply the regularization term to optimize the consistency problem of adjacent scales of the pyramid. 3) Conduct scanning linear optimization to further improve the accuracy of the cost aggregation and reduce the matching errors. Then, the initial disparity value of each pixel point is computed using winner-takes-all (WTA) strategy. 4) Optimize the unreliable disparity by disparity refinement (left-right consistency check, disparity filling, weighted median filtering). Finally, output the disparity map.
The overall process of the iFCTACP algorithm is shown in Figure 1.
The purpose of matching cost computation is to measure the correlation between the pixel in the left image and the pixel to be matched in the right image under different disparities. The CT matching cost has been widely used due to its robustness to weak texture regions. It constructs the description code of the center pixel point by comparing the gray value of the center pixel and its neighborhood. The Hamming distance between the codes is used as the matching cost, as defined in Eq (2.1).
| {ξ(p,q)={1,Ip<Iq0,elseB(p)=⊗q∈Npξ(p,q)Ccen(p,d)=Hamming[BL(p),BR(pd)], | (2.1) |
where p is a pixel in the left image whose coordinates are (x,y); q is a pixel in the neighborhood of p, and Ip and Iq are the gray values of p and q; pd represents the corresponding pixel of p with disparity d in the right image, and the coordinates are (x−d,y); Np is the neighborhood of p; ⊗ indicates bitwise connection; B(p) represents the census code of p; Ccen(p,d) denotes the Hamming distance between the codes of pixels, p and pd.
The definition above reflects that CT transform is highly dependent on the gray value of the central pixel and cannot completely describe the information within the rectangular transform window. In real life, it is inevitable that the image captured by camera will be affected by noise, which will definitely affect the accuracy of the final matching result. To address this problem, Ma et al. [22] proposed the MCT, which replaces the central pixel value with the mean value of the pixels in the window. To a certain extent, the noise robustness of CT is improved. Nevertheless, the mean value is susceptible to the maximum and minimum value of pixels in the window. MRCT, presented by Lai et al. [23], replaces the original gray value of the neighborhood pixel whose relative distance is greater than one unit from the central pixel with the values interpolation of the four pixels surrounding the neighborhood pixel. Although the error matching of MRCT is reduced to some degree, the anti-interference ability is still poor. Lee et al. [24] proposed the SCT, which compares the luminance of pixels at a certain distance along the symmetric pattern within the matching window. The anti-interference ability has been improved, but the algorithm is more complex.
In this paper, we propose iFCT as shown in Algorithm 1 with pseudo-code. It not only improves the matching accuracy, but also effectively solves the central pixel distortion problem. These two improvements benefit from taking the mean pixel value ˉI(px,py) (Algorithm 1, Lines 5∼12) within the m×n window of the center pixel p as another constraint, and using the intensity of the matched pixels within the window to compare with the center pixel value I(px,py) and the average value of its neighborhood ˉI(px,py) (Algorithm 1, Lines 13∼28), as shown in Figure 2. In this way, a new census transform is built. We assign the value of ˉI(px,py) as:
| ˉI(px,py)=∑m2i=−m2∑n2j=−n2I(px+i,py+j)m×n, | (2.2) |
where I(px,py) is the center pixel of the window, and I(px+i,py+j) is the intensity of each pixel in the window. The I(px+i,py+j) is compared with I(px,py) and ˉI(px,py). The new census transform is expressed as:
| T(px,py)=⊗i∈m⊗j∈nξ(I(px,py),I(px+i,py+j),ˉI(px,py)), | (2.3) |
where the operator ⊗ is a bit concatenation operation, and the auxiliary function ξ, which has four modes, is defined as:
| ξ(a,b,c)={01,ifa<b<c;10,ifa>b>c;00,ifb≤min(a,c);11,ifb≥max(a,c). | (2.4) |
| Algorithm 1: Pseudocode for iFCT method |
| Data: The initial image I; Result: Bit string, census(x, y); 1 for y=M to I.height−M do 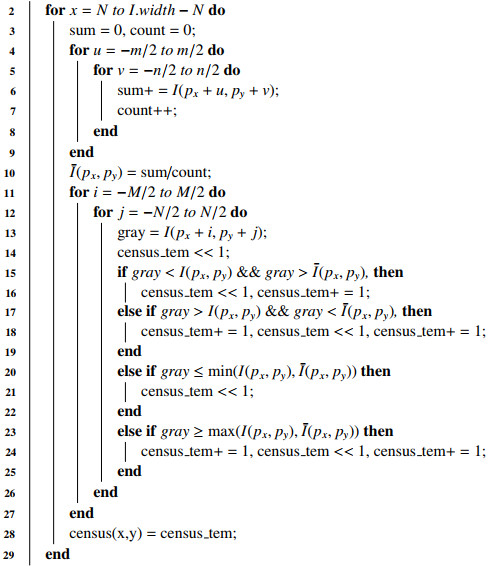 30 end |

We call the improved four-mode census transform as iFCT.
Figure 3 shows the calculation process of iFCT and CT with a neighborhood window of 5×5, where m, n is taken as 3. When the center pixel is affected by noise and changed from 72 to 120, the conventional CT transform code changes significantly, while the iFCT transform code remains unchanged thereby, the anti-interference performance is improved.

In spite of the simplicity and speed of the cost computation of AD, its sensitivity to noise and many error matchings in the obtained disparity map are the lingering problems. In contrast, gradient and CT have better robustness to noise. To improve the matching accuracy and the robustness under noisy conditions, this paper integrates iFCT with the method proposed by Hosni et al. [25], which can be expressed as the following equation:
| C′(i,d)=(1−α)min(||I(i)−I′(id)||,τAD)+α⋅min(||∇xI(i)−∇xI′(id)||,τGrad), | (2.5) |
where i is the pixel in left image, id is the matching pixel of i in right image, d is the disparity between i and id; I(i) and I′(id) denote the color vectors of i and id; τAD denotes the color intensity truncation value, τGrad is the gradient truncation value; α denotes the balance factor between intensity and gradient; and C′(i,d) is the matching cost volume formed by the combination of the absolute differences of truncated color and truncated gradient. Inspired by the idea of normalized fusion [13], this paper uses a variant fusion equation integrates C′(i,d) to compute the initial matching cost value, as follows:
| C(i,d)=(1−eCcenλcen)+(1−eC′λ′), | (2.6) |
where λcen and λ′ are the weights composed of different costs, which can be adjusted to get better matching effect, and C(i,d) is the final matching cost volume.
Figure 4 shows two final disparity maps with the Middlebury teddy data set [26]. One is the results of the cost computation combined with the absolute differences of truncated color and truncated gradient proposed by Hosni et al. [25]. The other is the result of the cost computation fused with iFCT. In order to make the results more convincing, we do not do any other post-processing. The comparisons show that the latter produces better disparity maps than those of the former in the repeating texture regions (marked with red circle) and weak texture regions (marked with yellow ellipse).

Currently, most matching cost aggregation methods process the original resolution of the image directly. They can obtain high-quality disparity values in rich texture regions, but in weak texture regions they are prone to mismatch. In order to combine multi-scale information and make full use of coarse-scale information, Zhang et al. [16] proposed a cross-scale model to aggregate the multi-scale matching cost by downsampling to obtain multi-scale information. This model added a generalized L2 regularization term to the optimization goal to make the matching cost consistent on adjacent scales.
One of the essential difficulties in building crossed-based support windows is how to define appropriate rules to include pixels with similar disparity values in the same window. Zhang et al. [14] constructed cross-based support windows by using color similarity and a constant color similarity threshold. However, it cannot handle both discontinuous depth regions and weak texture regions simultaneously. To tackle this problem, Mei et al. [13] analyzed the shortcomings of the cost aggregation method of the cross window proposed by Zhang et al. [16] and improved the matching accuracy in the disparity discontinuous region by setting stricter constraints to determine the arm length of the cross window. However, its fixed threshold setting has a deep impact on the matching accuracy. These methods do not adjust the color and spatial thresholds depending on the type of area where the pixel is located, resulting in an over-extended window arm and more false disparity information in weak texture areas and edge areas.
Therefore, we present a multi-layer adaptive cross pyramid (ACP) structure for cost aggregation. The proposed cost aggregation method is summarized in Algorithm 2. The arm length of the cross window is determined by gradient information and variable color threshold, and its structure is shown in Figure 5. At first, the gradient threshold is set to classify whether the pixel belongs to the weak texture region or the edge region. For weak texture regions, larger color and distance thresholds are set to obtain more correct disparity information. For the edge regions, the color and distance thresholds are reduced to prevent obtaining too much incorrect disparity information. The improved window arm length constraint for the weak texture regions can be formulated as:
| {G(p)<βDs(pl,p)<L1Dc(pl,p)<τ1,Dc(pl,pl+(1,0))<τ1Dc(pl,p)<τ2,ifL2<Ds(pl,p)<L1, | (2.7) |
where, β is the gradient threshold to determine whether the pixel belongs to the weak texture region or the edge region; Ds(pl,p) is the spatial distance between pixel pl and pixel p; Dc(pl,p) is the RGB color difference between pixel pl and pixel p; τ1 and τ2 are color thresholds and τ2<τ1; L1 and L2 are distance thresholds and L2<L1; and τ2 is a variable color threshold. When L2<Ds(pl,p)<L1, the τ2 is strictly limited to prevent including more pixels with different depths. It changes nonlinearly with the current color and arm length. The longer the arm length is, the more strictly the color threshold τ2 is set. It is defined as follows:
| τ2=−e(−(L1−Ds(pl,p))λL)⋅τ2+τ2, | (2.8) |
where λL is the adjustment parameter that regulates the effect of Ds(pl,p) on the final τ2. For the edge and discontinuous regions, it is necessary to set stricter color and distance thresholds to avoid excessive extension of the arm length which leads to an increase in the error matching rate in the edge region. The window arm length constraints are updated as:
| {G(p)>βDs(pl,p)<λ1⋅L1Dc(pl,p)<τ1,Dc(pl,pl+(1,0))<τ1Dc(pl,p)<λ3⋅τ2,ifλ2⋅L2<Ds(pl,p)<λ1⋅L1, | (2.9) |
where the coefficients λ1, λ2, and λ3 are the reduction factors of L1, L2, and τ2, respectively. With the constrains mentioned above, the length of the left, right, upper, and lower arms {h−p,h+p,v+p,v−p} can be determined by linear extension from center pixel p, pixel by pixel. Therefore, a cross composed of horizontal line segment H(p) and vertical line segment V(p) is constructed as the local window of cost aggregation. To speed up aggregation, we further use an orthogonal integral image (OII) technique [14] for fast cost aggregation over any arbitrarily shaped windows in constant time. First, we build a horizontal integral image SH(x,y) to store the cumulative row sum as:
| SH(x,y)=SH(x−1,y)+C(x,y). | (2.10) |
| Algorithm 2: Pseudocode for ACP method |
| Data: The initial image Is, different scales of initial cost volume Cs, s∈{0,1,...,S}. Result: Final cost volume ∼Cs. 1: for s=0 to S do 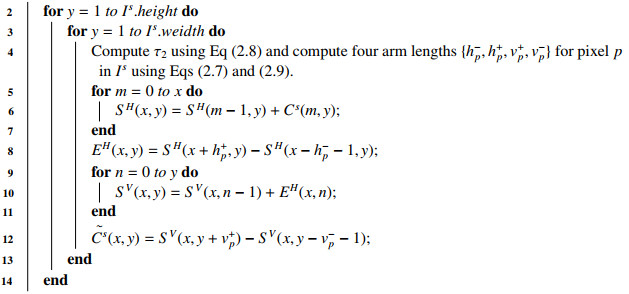 15 end |

The SH(x,y) can be calculated from SH(x−1,y) with only one addition. When x=0,SH(−1,y)=0, we calculate the horizontal integral EH(x,y), using the horizontal integral image SH(x,y) as follows:
| EH(x,y)=SH(x+h+p,y)−SH(x−h−p−1,y). | (2.11) |
Taking the calculated horizontal matching cost EH(x,y) as the input, we create a vertical integral image SV(x,y). It stores the cumulative column sum as:
| SV(x,y)=SV(x,y−1)+EH(x,y). | (2.12) |
Also, only one addition is needed to calculate SV(x,y). When y=0,SH(x,−1)=0, the fully aggregated matching cost ∼C(x,y) can be derived from the following equation:
| ∼C(x,y)=SV(x,y+v+p)−SV(x,y−v−p−1). | (2.13) |
Then, the error matching rate is further decreased by scan-line optimization in four directions.
Figure 6 shows an example of the support window generated by the improved cost aggregation. It can be found that our support window includes fewer invalid pixels in the discontinuous depth region, which reduces the error matching rate.

After cost aggregation, the cost volume is rectified. It is followed by disparity computation. The initial disparity of a pixel is computed by WTA strategy whose implementation is as follows: The corresponding disparity of the smallest cost value within the maximum disparity Lmax search range is taken as the initial disparity value. The process can be expressed as follows:
| dini(p)=argmind∈D[S(p,d)], | (2.14) |
where D is the disparity searching range, dini(p) is the initial disparity of pixel p, and S(p,d) is the matching cost after the cost aggregation. Generally, the minimum cost is selected to represent the optimal matching relationship. During disparity refinement, the outliers are picked up by left-right consistency detection. If the difference of disparity value between the pixel whose disparity is in the left image and the corresponding matching pixel whose disparity is in the right image satisfies the constraint:
| |d1−d2|>Th, | (2.15) |
where Th is a default disparity threshold, generally set to 1, then p(x,y) is treated as an anomaly point for subsequent processing or will be retained. To correct the anomaly point p, two non-anomaly points, pl and pr, are picked up on the left and right directions of point p, respectively. The minimum disparity value between pl and pr is selected as the corrected disparity value of p, which can be expressed by the following equation:
| d(p)=min(d(pl),d(pr)). | (2.16) |
As there may be random noise and discontinuous error matching pixel in the disparity map, the median filter is used to smooth the disparity map, and consequently a high-quality disparity map is obtained.
The experimental environment: C++ Compiler with OpenCV3.4 library, Windows 10 × 86 operating system, Intel(R) Core(TM) i5-7200U CPU and 4 GB RAM, and Middlebury stereo datasets [26] were used to evaluate the proposed iFCTACP. In the following experiments, the best results among the compared algorithms are marked in bold. In this paper, the percentage of bad pixels in the estimated stereo pair difference is used as the evaluation criterion. The disparity error threshold is set to 1.0 pixel. The error matching rate is calculated for non-occluded regions by dividing the sum of all the mismatch points by the sum of the overall effective disparity points. The parameters used in the experiments are shown in Table 1.
| Parameters | α | τAD | τGrad | λcen | λ′ | L1 | L2 |
| Values | 0.1 | 7 | 2 | 25 | 700 | 34 | 7 |
| Parameters | τ1 | τ2 | β | λ1 | λ2 | λ3 | λL |
| Values | 20 | 6 | 0.6 | 0.15 | 0.25 | 0.5 | 3 |
 DownLoad:
CSV
DownLoad:
CSV
We use six sets of images with ground truth provided by the Middlebury dataset [26] (Art, Dolls, Flowerpots, Moebius, Reindeer, and Cloth1) and set three illuminations (0, 1, 2) and three exposures (0, 1, 2). For simplicity, we only take the Art set as an example hereafter. Figure 7 shows the left images of Art under three different illuminations (the exposure is the same) and the left images of Art under three different exposures (the illumination is the same). In order to verify the effectiveness and noise robustness of iFCT, the iFCT and the other four transforms, CT, MCT, SCT, and MRCT, are respectively fused to the cost calculation method, which is composed of the truncated color absolute difference and the truncated gradient absolute difference for the comparative experiment. To verify the superiority of iFCT, all disparity maps are produced with the same cost aggregation method.

Figures 8 to 11 show the disparity map in four kinds of conditions: different illumination, different exposure, 5% salt-and-pepper noise, and Gaussian noise with σ=5, respectively. In these figures, (a)–(c) show the left image of Art, the right image of Art, and the ground truth disparity map, respectively; (d)–(h) show the disparity map obtained by the cost computation method, which uses the truncated color absolute difference and the truncated absolute gradient difference to fuse five different census transform of iFCT, CT, MCT, SCT, and MRCT, respectively. In Figure 8, the left and right image are taken under illumination 2 and illumination 1, respectively, both under exposure 0. In Figure 9, the left image is taken under the condition of exposure 1, the right image is taken under the condition of exposure 2, and both images are taken under illumination 0. In Figure 10, 5% salt-and-pepper noise is added to the left and right images. In Figure 11, Gaussian noise with σ=5 is added to the left and right images. Qualitatively, comparing Figure 8(d) with Figure 8(e)–(h), shows that the fused iFCT is more robust to image illumination changes. Also, comparing Figure 9(d) with Figure 9(e)–(h), the disparity map of Figure 9(d) show fewer artifacts than those of Figure 9(e)–(h). Comparing Figure 10(d) with Figure 10(e)–(h), it is found that Figure 10(e), which is added 5% salt-and-pepper noise, performs better than Figure 10(d), which is obtained by fusing iFCT. The disparity maps obtained by fusing the above five different census transforms under the condition of Gaussian noise with the σ=5 are shown in Figure 11, and showing the effect of the disparity map in Figure 11(f) outperforms the others.


Under the four conditions above, the truncated color absolute difference and truncated gradient absolute difference fuse those five different census transforms mentioned above. The error matching rates of the disparity maps are shown in Tables 2 to 5. For comparison, the disparity map without any noise is also measured in this paper, and the results are shown in Table 6. In Tables 2 and 3, among six pairs of stereo images, those fused with iFCT have the lowest error matching rate and the lowest average error matching rate, which indicates that the iFCT is more robust to illumination change and exposure change than the other four census transforms. Table 4 shows, under the condition of 5% salt-and-pepper noise, that the average error matching rate of the fused CT is the lowest and that of the fused iFCT is at the middle level. In Table 5, the fused iFCT has the lowest error matching rate in 3 pairs of stereo images: Art, Reindeer, and Cloth1. The average error matching rate is only 0.1% than the optimal MCT, indicating that the fused iFCT is more robust to Gaussian noise. In Table 6, the fused iFCT achieves the best average error matching rate, which indicates that the iFCT is effective for noise-free matching. From the above analysis, we can see that iFCT exhibits excellent performance under illumination changes, exposure changes, and free noise. It also has good noise immunity to salt-and-pepper noise and Gaussian noise. In order to test the real-time performance of the algorithm, we test the execution time of it. The measured time is the average of 20 separate runs and the results are shown in Figure 12.
| Algorithms | Art | Dolls | Flowerpots | Moebius | Reindeer | Cloth1 | Avg |
| iFCT | 10.12 | 7.55 | 5.36 | 8.56 | 10.09 | 0.36 | 7.00 |
| CT | 10.53 | 9.21 | 5.60 | 8.92 | 10.59 | 0.37 | 7.54 |
| MCT | 12.34 | 9.84 | 5.99 | 9.28 | 10.86 | 0.42 | 8.12 |
| SCT | 14.13 | 11.60 | 6.94 | 10.68 | 15.80 | 0.54 | 9.95 |
| MRCT | 44.4 | 39.46 | 8.66 | 33.08 | 60.21 | 14.31 | 33.36 |
DownLoad:
CSV
| Algorithms | Art | Dolls | Flowerpots | Moebius | Reindeer | Cloth1 | Avg |
| iFCT | 14.35 | 7.25 | 14.85 | 9.94 | 10.77 | 0.63 | 9.63 |
| CT | 14.99 | 7.72 | 15.20 | 10.99 | 10.74 | 0.68 | 10.05 |
| MCT | 16.69 | 8.88 | 16.78 | 12.26 | 12.80 | 0.79 | 11.37 |
| SCT | 18.52 | 13.29 | 22.45 | 13.45 | 13.50 | 1.26 | 13.75 |
| MRCT | 60.45 | 61.64 | 59.90 | 49.78 | 62.04 | 22.12 | 52.66 |
DownLoad:
CSV
| Algorithms | Art | Dolls | Flowerpots | Moebius | Reindeer | Cloth1 | Avg |
| iFCT | 7.67 | 3.72 | 7.21 | 7.42 | 3.68 | 0.41 | 5.01 |
| CT | 6.74 | 3.14 | 6.51 | 7.21 | 3.38 | 0.41 | 4.57 |
| MCT | 6.77 | 4.98 | 11.81 | 10.47 | 6.63 | 0.34 | 6.83 |
| SCT | 6.77 | 3.06 | 8.17 | 7.43 | 3.28 | 0.36 | 4.85 |
| MRCT | 7.77 | 3.48 | 9.37 | 8.90 | 3.93 | 1.00 | 5.74 |
DownLoad:
CSV
| Algorithms | Art | Dolls | Flowerpots | Moebius | Reindeer | Cloth1 | Avg |
| iFCT | 17.90 | 12.34 | 33.54 | 16.84 | 24.35 | 0.47 | 17.57 |
| CT | 19.83 | 13.12 | 33.61 | 17.30 | 25.40 | 0.53 | 18.30 |
| MCT | 18.55 | 11.90 | 32.81 | 16.53 | 24.68 | 0.48 | 17.49 |
| SCT | 22.30 | 14.86 | 35.82 | 19.10 | 29.78 | 0.78 | 20.44 |
| MRCT | 35.06 | 23.87 | 48.78 | 30.23 | 45.88 | 5.95 | 31.63 |
DownLoad:
CSV
| Algorithms | Art | Dolls | Flowerpots | Moebius | Reindeer | Cloth1 | Avg |
| iFCT | 5.81 | 2.88 | 5.36 | 5.60 | 3.34 | 0.24 | 3.87 |
| CT | 6.07 | 2.69 | 5.60 | 5.89 | 3.12 | 0.23 | 3.93 |
| MCT | 7.59 | 3.35 | 5.99 | 6.74 | 4.17 | 0.24 | 4.68 |
| SCT | 6.06 | 2.69 | 6.94 | 6.39 | 3.11 | 0.26 | 4.24 |
| MRCT | 6.80 | 2.96 | 8.66 | 8.90 | 3.55 | 0.63 | 5.25 |
DownLoad:
CSV

To verify the matching accuracy in weak texture regions, six groups of typical weak texture images, Lampshade1, Lampshade2, Midd1, Midd2, Monopoly, and Plastic, are selected from Middlebury for comparing the cost aggregation method based on ACP with four classical methods, AD-Census [13], GF [25], PPEP-GF [27], and Z2ZNCC [28]. All of them use the same cost computation method, iFCT, which was shown to be more robust than other combined cost computation methods in Section 3.1. The stereo matching results of six pairs of weak texture stereo images are shown in Figure 13, and the error matching points are marked in red. Comparing the disparity map of ACP in Figure 13(c) with those of the four classical methods (AD-Census, GF, PPEP-GF, Z2ZNCC) in Figure 13(d)–(g), it can be concluded that the ACP method is smoother in weak texture regions, the edges are better maintained, the obtained disparity maps are generally of high quality, and the error matching rate is much lower than that of the other classical methods.

The matching results and percentage of bad pixels are shown in Table 7. ACP cost aggregation method is applied to six pairs of weak texture stereo images, of which five pairs (Lampshade1, Lampshade2, Midd2, Monopoly, Plastic) show more remarkable results than the four classical cost aggregation methods. In addition, except for the stereo matching images, Plastic and Midd2, the mismatching rates of the other three pairs are less than 4%. Compared with AD-Census, GF, PPEP-GF, and Z2ZNCC, the aggregation error of ACP is reduced by 5.58%, 7.64%, 2.49%, and 6.68%, respectively. From the visual comparison of the original disparity map in Figure 13(b), it can be found that AD-Census performs worse than ACP and Z2ZNCC in the weak texture regions, because AD-Census adopts the same matching cost aggregation method in both the weak texture regions and the edge areas with rich textures and fails to utilize the regional characteristics of pixels in the image. GF and PPEP-GF have high mismatching rate in the weak texture region, because the linear coefficient of the guide filter is affected by the selected regularization parameters, the cost aggregation effect is not ideal, and the accuracy of the final disparity map is affected. On the whole, the cost aggregation method of ACP obviously outperforms the four classical cost aggregation methods in weak texture regions and obtains disparity maps with a more correct area. The ACP achieves the lowest average error matching rate. At the same time, the running time of the above five cost aggregation methods is measured, as shown in Figure 14. To achieve a fair comparison, all of the algorithms are run on the same testing platform, and no parallelism technique is used. Seen from Figure 14, it takes both the AD-Census and ACP methods approximately 4 seconds. The GF method takes a little longer, while the PPEP-GF and Z2ZNCC methods take a little less time.
| Algorithms | Lampshade1 | Lampshade2 | Midd1 | Midd2 | Monopoly | Plastic | Avg |
| ACP | 2.41 | 3.12 | 14.34 | 10.53 | 3.95 | 14.58 | 8.12 |
| AD-census | 10.34 | 10.69 | 11.82 | 12.35 | 5.44 | 32.07 | 13.79 |
| GF | 4.66 | 9.89 | 26.54 | 19.28 | 12.01 | 22.16 | 15.76 |
| PPEP-GF | 2.58 | 6.24 | 18.79 | 13.09 | 6.85 | 16.13 | 10.61 |
| Z2ZNCC | 3.12 | 9.56 | 24.12 | 17.75 | 11.44 | 22.80 | 14.8 |
DownLoad:
CSV

To objectively evaluate the overall performance of the iFCTACP, the experiments were carried out on 25 pairs of stereo images from the Middlebury dataset. It was not only compared with the AD-census algorithm [19] but also with other recently proposed methods: the AEGF [29], OLT [30], and DDL algorithms [31]. The quantitative evaluation results are shown in Table 8. Compared with the ther four algorithms, the IFCTACP algorithm has the lower average error rate and better effect on most stereo images. As shown in the paper, 17 out of 25 pairs of stereo images have the lowest error matching rate. Compared with AD-Census algorithm, AEGF algorithm, OLT algorithm and DDL algorithm, the average matching error of ACP algorithm in this paper is reduced by 4.97%, 2.25%, 2.09%, and 1.34%, respectively, showing more stable performance in processing different scenarios. This is due to the fact that DDL learns a discriminant dictionary for stereo matching and has non-local aggregation capability, which can cope well with low-texture regions, but is less effective for high-texture regions. AEGF and OLT do not perform as well as IFCTACP in low-texture areas because their cascaded filters only use fixed-size windows and have no spatial adaptability. The AD-Census algorithm is not ideal when determining the support domain, and the matching accuracy is not high in the weak texture region. In contrast, the parallax map obtained by iFCTACP not only contains less noise, but also has better performance in the weak texture region and high texture region.
| Datasets | AD-census | AEGF | OLT | DDL | iFCTACP |
| Cones | 8.61 | 2.01 | 3.42 | 4.27 | 2.96 |
| Teddy | 6.48 | 5.21 | 7.69 | 6.59 | 7.45 |
| Tsukuba | 8.04 | 1.32 | 2.06 | 2.63 | 3.92 |
| Venus | 2.92 | 0.26 | 0.54 | 0.69 | 1.34 |
| Aloe | 5.18 | 5.25 | 2.91 | 5.28 | 2.83 |
| Art | 11.58 | 7.58 | 6.91 | 9.47 | 5.81 |
| Baby1 | 5.56 | 3.18 | 4.03 | 2.78 | 1.79 |
| Baby2 | 8.27 | 4.15 | 4.86 | 2.84 | 1.89 |
| Baby3 | 4.21 | 4.34 | 4.89 | 3.19 | 2.24 |
| Books | 11.05 | 8.05 | 8.07 | 8.16 | 6.87 |
| Bowling1 | 18.77 | 13.33 | 14.52 | 4.38 | 3.12 |
| Bowling2 | 13.27 | 7.13 | 6.11 | 4.43 | 2.69 |
| Cloth1 | 0.20 | 0.49 | 0.11 | 0.25 | 0.24 |
| Cloth2 | 4.15 | 2.88 | 1.30 | 2.14 | 1.17 |
| Cloth3 | 1.68 | 1.31 | 0.93 | 1.80 | 0.93 |
| Cloth4 | 1.32 | 1.54 | 0.74 | 1.21 | 0.77 |
| Dolls | 5.61 | 5.36 | 3.79 | 5.58 | 2.88 |
| Flowerpots | 17.26 | 5.36 | 11.35 | 6.80 | 5.36 |
| Lampshade1 | 12.27 | 11.43 | 8.27 | 5.66 | 2.41 |
| Lampshade2 | 15.23 | 16.98 | 12.20 | 4.08 | 3.12 |
| Laundry | 14.71 | 14.32 | 11.98 | 12.00 | 11.92 |
| Moebius | 9.97 | 8.71 | 8.25 | 9.60 | 5.60 |
| Reindeer | 16.70 | 3.57 | 4.11 | 5.40 | 3.34 |
| Rocks1 | 2.54 | 3.25 | 1.27 | 4.14 | 1.40 |
| Rocks2 | 2.04 | 2.44 | 1.02 | 3.26 | 1.08 |
| Average error | 8.30 | 5.58 | 5.42 | 4.67 | 3.33 |
DownLoad:
CSV
If the accuracy of the initial disparity image is higher, the accuracy of the final disparity image will also be higher. In order to improve the accuracy of the initial disparity image, it is very important to select appropriate parameters for local stereo matching. Therefore, we will discuss the influence of the selection of different parameters on stereo matching. The average percentage of bad pixels under different parameters is used as the evaluation criteria.
The factors affecting cost computation are α, τAD, τGrad, λcen, and λ′. Among them, α plays an important role in adjusting the proportion of color intensity and gradient cost in the combined cost function; the color intensity threshold τAD and gradient threshold τGrad can effectively suppress some noise interference; and λcen and λ′ control the proportion of iFCT cost and the combination cost of truncated color absolute difference and truncated gradient absolute difference in the fusion cost, respectively. In this paper, seven sets of images are selected as test images and the parameters are adjusted separately, while other parameters are kept constant. The quantitative relationships between α, τAD, τGrad, λcen, λ′ and the error matching rate are given in Figure 15(a)–(e) in detail. From Figure 15(a) to Figure 15(d), it can be concluded that the error matching rate of the disparity image increases when the parameter α increases, especially for the weak texture images, Plastic and Monopoly, which increases sharply. When τGrad≥2, most error matching rates of the images do not vary obviously, except for Plastic, whose error matching rate is still increasing. The error matching rates change little when λcen ranges from 20 to 40; the weak texture images, Plastic and Monopoly, are highly sensitive to the parameter λ′, whose error matching rate decreases sharply when λ′ increases. However, the other rich textured images are insensitive to λ′. From the experiments, we conclude that the overall performance is relatively better when α = 0.1, τAD = 7, τGrad = 2, λcen = 25, and λ′ = 700.

During the construction of the cross-based supporting window, the arm length threshold L1 and color similarity threshold τ1 are used to retain more useful pixels in weak texture regions, which makes the result more accurate and robust. As shown in Figure 15(f), (h), the error matching rate tends to be stable when L1≥34, while τ1 has little effect on it for most images. To avoid introducing more noise in the discontinuous disparity region when setting L1 and τ1, a stricter color similarity threshold τ2 is set when the arm length exceeds the threshold L2. In Figure 15(g), the parameter L2 has little effect on the error matching rate of most images. In Figure 15(i), the error matching rate of all images does not change much when the parameter τ2≥6. The gradient threshold β is set to determine whether the pixel point belongs to the weak texture region or the edge region. For the edge region, the scale factors λ1, λ2, and λ3 need to be set for reducing the corresponding distance thresholds L1, L2, and color similarity threshold τ2. In Figure 15(j), β reduces the error matching rate for most of the images, especially for the weak texture images Monopoly. However, for Plastic, the error matching rate increases sharply when β>0.6. Similarly, it can be seen from Figure 15(k) that when λ1≥0.15, the error matching rates tend to be stable for most images except for Plastic. Figure 15(l) that shows λ2 reduces the error matching rate especially for Art images and the error matching rate goes up, as λ2 increases. Figure 15(m) shows that the error matching rates of most images tend to be stable when λ3≥0.5. The λL is a variable color threshold. More constraints will be imposed on it when the arm length becomes longer. As shown in Figure 15(n), the error matching rates of the Plastic and Monopoly images fluctuate while those of other images are nearly kept unchanged. In this paper, to obtain a better matching rate, we set L1 = 34, L2 = 7, τ1 = 20, τ2 = 6, λ1 = 0.15, λ2 = 0.25, and λ3 = 0.5.
In order to improve the anti-noise robustness and obtain better disparity map in large weak texture regions, we propose a stereo matching algorithm, iFCTACP, which encompasses two innovative points. First, the iFCT, a model based on regional information coding, is used as a new and stable method for cost measurement, with the benefits of its strong noise resistance to illumination and exposure. Secondly, the adaptive cross pyramid model, ACP, can build connections among different regions with similar disparity to fully use image region features. The qualitative and quantitative experiments on the Middlebury dataset validate the effectiveness of iFCTACP, outperforming most known local stereo matching algorithms. Since the depth information can better distinguish between near and distant objects, the solution in this paper can be combined with other applications, such as 360 vision, to further improve the multi-target tracking performance.
The authors declare that they have not used artifcial intelligence tools in the creation of this article.
This research was funded by the 2023 Fujian Province Young and Middle-aged Teacher Education Research Project (Science and Technology), grant number JZ230076.
The authors declare there is no conflict of interest.
| [1] |
Cosnes J, Gower-Rousseau C, Seksik P, et al. (2011) Epidemiology and natural history of inflammatory bowel diseases. Gastroenterol 140: 1785–1794. doi: 10.1053/j.gastro.2011.01.055

|
| [2] |
Shanahan F, Bernstein CN (2009) The evolving epidemiology of inflammatory bowel disease. Curr Opin Gastroenterol 25: 301–305. doi: 10.1097/MOG.0b013e32832b12ef
|
| [3] | Economou M, Pappas G (2008) New global map of Crohn's disease: Genetic, environmental, and socioeconomic correlations. Inflamm Bowel Dis 4: 709–720. |
| [4] |
Mulder DJ, Noble AJ, Justinich CJ, et al. (2014) A tale of two diseases: the history of inflammatory bowel disease. J Crohns Colitis 8: 341–348. doi: 10.1016/j.crohns.2013.09.009
|
| [5] | Hanauer SB (2006) Inflammatory bowel disease: epidemiology, pathogenesis, and therapeutic opportunities. Inflamm Bowel Dis 12: S3–S9. |
| [6] |
Dubinsky M (2008) Special issues in pediatric inflammatory bowel disease. World J Gastroenterol 14: 413–420. doi: 10.3748/wjg.14.413
|
| [7] |
Diefenbach KA, Breuer CK (2006) Pediatric inflammatory bowel disease. World J Gastroenterol 12: 3204–3212. doi: 10.3748/wjg.v12.i20.3204
|
| [8] |
Ekbom A, Helmick C, Zack M, et al. (1991) The epidemiology of inflammatory bowel disease: a large, population-based study in Sweden. Gastroenterol 100: 350–358. doi: 10.1016/0016-5085(91)90202-V
|
| [9] |
CROHN BB, Rosenberg H (1925) The sigmoidoscopic picture of chronic ulcerative colitis (non-specific). Am J Med Sci 170: 220–227. doi: 10.1097/00000441-192508010-00006
|
| [10] |
Rutter MD, Saunders BP, Wilkinson KH, et al. (2006) Thirty-year analysis of a colonoscopic surveillance program for neoplasia in ulcerative colitis. Gastroenterol 130: 1030–1038. doi: 10.1053/j.gastro.2005.12.035
|
| [11] |
Beaugerie L, Svrcek M, Seksik P, et al. (2013) Risk of colorectal high-grade dysplasia and cancer in a prospective observational cohort of patients with inflammatory bowel disease. Gastroenterol 145: 166–175. doi: 10.1053/j.gastro.2013.03.044
|
| [12] |
Eaden J, Abrams K, Mayberry J (2001) The risk of colorectal cancer in ulcerative colitis: a meta-analysis. Gut 48: 526–535. doi: 10.1136/gut.48.4.526
|
| [13] |
Canavan C, Abrams K, Mayberry J (2006) Meta-analysis: colorectal and small bowel cancer risk in patients with Crohn's disease. Aliment Pharmacol Ther 23: 1097–1104. doi: 10.1111/j.1365-2036.2006.02854.x
|
| [14] | Itzkowitz SH, Yio X (2004) Inflammation and cancer IV. Colorectal cancer in inflammatory bowel disease: the role of inflammation. Am J Physiol Gastrointest Liver Physiol 287: G7–G17. |
| [15] | Kornfeld D, Ekbom A, Ihre T, et al. (1997) Is there an excess risk for colorectal cancer in patients with ulcerative colitis and concomitant primary sclerosing cholangitis? A population based study. Gut 41: 522–525. |
| [16] |
Matula S, Croog V, Itzkowitz S, et al. (2005) Chemoprevention of colorectal neoplasia in ulcerative colitis: the effect of 6-mercaptopurine. Clin Gastroenterol Hepatol 3: 1015–1021. doi: 10.1016/S1542-3565(05)00738-X
|
| [17] |
Terdiman JP, Steinbuch M, Blumentals WA, et al. (2007) 5-Aminosalicylic acid therapy and the risk of colorectal cancer among patients with inflammatory bowel disease. Inflamm Bowel Dis 13: 367–371. doi: 10.1002/ibd.20074
|
| [18] |
Kiesslich R, Goetz M, Lammersdorf K, et al. (2007) Chromoscopy-guided endomicroscopy increases the diagnostic yield of intraepithelial neoplasia in ulcerative colitis. Gastroenterol 132: 874–882. doi: 10.1053/j.gastro.2007.01.048
|
| [19] |
Schneider MR, Hoeflich A, Fischer JR, et al. (2000) Interleukin-6 stimulates clonogenic growth of primary and metastatic human colon carcinoma cells. Cancer Lett 151: 31–38. doi: 10.1016/S0304-3835(99)00401-2
|
| [20] |
Sakamoto K, Maeda S, Hikiba Y, et al. (2009) Constitutive NF-κB activation in colorectal carcinoma plays a key role in angiogenesis, promoting tumor growth. Clin Cancer Res 15: 2248–2258. doi: 10.1158/1078-0432.CCR-08-1383
|
| [21] |
Kang KA, Zhang R, Kim GY, et al. (2012) Epigenetic changes induced by oxidative stress in colorectal cancer cells: methylation of tumor suppressor RUNX3. Tumor Biol 33: 403–412. doi: 10.1007/s13277-012-0322-6
|
| [22] |
Ning Y, Manegold PC, Hong YK, et al. (2011) Interleukin-8 is associated with proliferation, migration, angiogenesis and chemosensitivity in vitro and in vivo in colon cancer cell line models. Int J Cancer 128: 2038–2049. doi: 10.1002/ijc.25562
|
| [23] |
Huch M, Koo BK (2015) Modeling mouse and human development using organoid cultures. Development 142: 3113–3125. doi: 10.1242/dev.118570
|
| [24] | Van Limbergen J, Geddes K, Henderson P, et al. (2013) Paneth cell marker CD24 in NOD2 knockout organoids and in inflammatory bowel disease (IBD). Gut:gutjnl-2013-305077. |
| [25] |
van de Wetering M, Francies HE, Francis JM, et al. (2015) Prospective derivation of a living organoid biobank of colorectal cancer patients. Cell 161: 933–945. doi: 10.1016/j.cell.2015.03.053
|
| [26] |
Fatehullah A, Tan SH, Barker N (2016) Organoids as an in vitro model of human development and disease. Nat Cell Biol 18: 246–254. doi: 10.1038/ncb3312
|
| [27] |
Dharmani P, Leung P, Chadee K (2011) Tumor necrosis factor-α and Muc2 mucin play major roles in disease onset and progression in dextran sodium sulphate-induced colitis. PLoS One 6: e25058. doi: 10.1371/journal.pone.0025058
|
| [28] |
Heazlewood CK, Cook MC, Eri R, et al. (2008) Aberrant mucin assembly in mice causes endoplasmic reticulum stress and spontaneous inflammation resembling ulcerative colitis. PLoS Med 5: e54. doi: 10.1371/journal.pmed.0050054
|
| [29] |
Half E, Bercovich D, Rozen P (2009) Familial adenomatous polyposis. Orphanet J Rare Dis 4: 22. doi: 10.1186/1750-1172-4-22
|
| [30] |
Fodde R, Smits R (2001) Disease model: familial adenomatous polyposis. Trends Mol Med 7: 369–373. doi: 10.1016/S1471-4914(01)02050-0
|
| [31] |
Quesada CF, Kimata H, Mori M, et al. (1998) Piroxicam and acarbose as chemopreventive agents for spontaneous intestinal adenomas in APC gene 1309 knockout mice. JPN J Cancer Res 89: 392–396. doi: 10.1111/j.1349-7006.1998.tb00576.x
|
| [32] | Corpet DE, Pierre F (2003) Point: From animal models to prevention of colon cancer. Systematic review of chemoprevention in min mice and choice of the model system. Cancer Epidemiol Biomarkers Prev 12: 391–400. |
| [33] |
Aoki K, Tamai Y, Horiike S, et al. (2003) Colonic polyposis caused by mTOR-mediated chromosomal instability in Apc+/Δ716 Cdx2+/− compound mutant mice. Nat Genet 35: 323–330. doi: 10.1038/ng1265
|
| [34] |
Heyer J, Yang K, Lipkin M, et al. (1999) Mouse models for colorectal cancer. Oncogene 18: 5325–5333. doi: 10.1038/sj.onc.1203036
|
| [35] |
Velcich A, Yang W, Heyer J, et al. (2002) Colorectal cancer in mice genetically deficient in the mucin Muc2. Science 295: 1726–1729. doi: 10.1126/science.1069094
|
| [36] |
Van der Sluis M, De Koning BA, De Bruijn AC, et al. (2006) Muc2-deficient mice spontaneously develop colitis, indicating that MUC2 is critical for colonic protection. Gastroenterol 131: 117–129. doi: 10.1053/j.gastro.2006.04.020
|
| [37] |
Zhu Y, Richardson JA, Parada LF, et al. (1998) Smad3 mutant mice develop metastatic colorectal cancer. Cell 94: 703–714. doi: 10.1016/S0092-8674(00)81730-4
|
| [38] |
Yang X, Letterio JJ, Lechleider RJ, et al. (1999) Targeted disruption of SMAD3 results in impaired mucosal immunity and diminished T cell responsiveness to TGF-β. EMBO J 18: 1280–1291. doi: 10.1093/emboj/18.5.1280
|
| [39] | Perše M, Cerar A (2012) Dextran sodium sulphate colitis mouse model: traps and tricks. Biomed Res Int 2012. |
| [40] |
Delker DA, McKnight SJ, Rosenberg DW (1998) The role of alcohol dehydrogenase in the metabolism of the colon carcinogen methylazoxymethanol. Toxicol Sci 45: 66–71. doi: 10.1093/toxsci/45.1.66
|
| [41] | Haase P, Cowen D, Knowles J (1973) Histogenesis of colonic tumours in mice induced by dimethyl hydrazine. J Pathol 109: Px. |
| [42] |
Neufert C, Becker C, Neurath MF (2007) An inducible mouse model of colon carcinogenesis for the analysis of sporadic and inflammation-driven tumor progression. Nat Protoc 2: 1998–2004. doi: 10.1038/nprot.2007.279
|
| [43] |
Tanaka T, Kohno H, Suzuki R, et al. (2003) A novel inflammation-related mouse colon carcinogenesis model induced by azoxymethane and dextran sodium sulfate. Cancer Sci 94: 965–973. doi: 10.1111/j.1349-7006.2003.tb01386.x
|
| [44] |
De Robertis M, Massi E, Poeta ML, et al. (2011) The AOM/DSS murine model for the study of colon carcinogenesis: From pathways to diagnosis and therapy studies. J Carcinog 10: 9. doi: 10.4103/1477-3163.78279
|
| [45] | Reddy BS, Ohmori T (1981) Effect of intestinal microflora and dietary fat on 3, 2'-dimethyl-4-aminobiphenyl-induced colon carcinogenesis in F344 rats. Cancer Res 41: 1363–1367. |
| [46] |
Hasegawa R, Sano M, Tamano S, et al. (1993) Dose-dependence of 2-amino-1-methy1-6-phen-ylimidazo [4, 5-b]-pyridine (PhIP) carcinogenicity in rats. Carcinogenesis 14: 2553–2557. doi: 10.1093/carcin/14.12.2553
|
| [47] |
Wanibuchi H, Salim EI, Morimura K, et al. (2005) Lack of large intestinal carcinogenicity of 2-amino-1-methyl-6-phenylimidazo [4, 5-b] pyridine at low doses in rats initiated with azoxymethane. Int J Cancer 115: 870–878. doi: 10.1002/ijc.20960
|
| [48] | Kobaek-Larsen M, Thorup I, Diederichsen A, et al. (2000) Review of colorectal cancer and its metastases in rodent models: comparative aspects with those in humans. Comp Med 50: 16–26. |
| [49] |
Narisawa T, Magadia NE, Weisburger JH, et al. (1974) Promoting effect of bile acids on colon carcinogenesis after intrarectal instillation of N-Methyl-N' nitro-N-nitrosoguanidine in Rats. J Natl Cancer Inst 53: 1093–1097. doi: 10.1093/jnci/53.4.1093
|
| [50] |
Einerhand AW, Renes IB, Makkink MK, et al. (2002) Role of mucins in inflammatory bowel disease: important lessons from experimental models. Eur J GastroenterolHepatol 14: 757–765. doi: 10.1097/00042737-200207000-00008
|
| [51] |
Randall-Demllo S, Fernando R, Brain T, et al. (2016) Characterisation of colonic dysplasia-like epithelial atypia in murine colitis. World J Gastroenterol 22: 8334–8348. doi: 10.3748/wjg.v22.i37.8334
|
| [52] |
Gorrini C, Harris IS, Mak TW (2013) Modulation of oxidative stress as an anticancer strategy. Nat Rev Drug Discov 12: 931–947. doi: 10.1038/nrd4002
|
| [53] |
Jackson AL, Loeb LA (2001) The contribution of endogenous sources of DNA damage to the multiple mutations in cancer. Mut Res Fund Mol Mech Mutagen 477: 7–21. doi: 10.1016/S0027-5107(01)00091-4
|
| [54] | Kawanishi S, Hiraku Y, Pinlaor S, et al. (2006) Oxidative and nitrative DNA damage in animals and patients with inflammatory diseases in relation to inflammation-related carcinogenesis. Biol Chem 387: 365–372. |
| [55] |
Tüzün A, Erdil A, İnal V, et al. (2002) Oxidative stress and antioxidant capacity in patients with inflammatory bowel disease. Clin Biochem 35: 569–572. doi: 10.1016/S0009-9120(02)00361-2
|
| [56] |
Nair J, Gansauge F, Beger H, et al. (2006) Increased etheno-DNA adducts in affected tissues of patients suffering from Crohn's disease, ulcerative colitis, and chronic pancreatitis. Antioxid Redox Signal 8: 1003–1010. doi: 10.1089/ars.2006.8.1003
|
| [57] |
Vong LB, Yoshitomi T, Matsui H, et al. (2015) Development of an oral nanotherapeutics using redox nanoparticles for treatment of colitis-associated colon cancer. Biomaterials 55: 54–63. doi: 10.1016/j.biomaterials.2015.03.037
|
| [58] | Solomon H, Brosh R, Buganim Y, et al. (2010) Inactivation of the p53 tumor suppressor gene and activation of the Ras oncogene: cooperative events in tumorigenesis. Discov Med 9: 448–454. |
| [59] | Huang H, Wang H, Lloyd RS, et al. (2008) Conformational interconversion of the trans-4-hydroxynonenal-derived (6S, 8R, 11S) 1, N 2-deoxyguanosine adduct when mismatched with deoxyadenosine in DNA. Chem Res Toxicol 22: 187–200. |
| [60] |
Barrett CW, Ning W, Chen X, et al. (2013) Tumor suppressor function of the plasma glutathione peroxidase gpx3 in colitis-associated carcinoma. Cancer Res 73: 1245–1255. doi: 10.1158/0008-5472.CAN-12-3150
|
| [61] |
Curtin NJ (2012) DNA repair dysregulation from cancer driver to therapeutic target. Nat Rev Cancer 12: 801–817. doi: 10.1038/nrc3399
|
| [62] |
Khor TO, Huang MT, Prawan A, et al. (2008) Increased susceptibility of Nrf2 knockout mice to colitis-associated colorectal cancer. Cancer Prev Res 1: 187–191. doi: 10.1158/1940-6207.CAPR-08-0028
|
| [63] | Meira LB, Bugni JM, Green SL, et al. (2008) DNA damage induced by chronic inflammation contributes to colon carcinogenesis in mice. J Clin Invest 118: 2516–2525. |
| [64] |
Sohn JJ, Schetter AJ, Yfantis HG, et al. (2012) Macrophages, nitric oxide and microRNAs are associated with DNA damage response pathway and senescence in inflammatory bowel disease. PLoS One 7: e44156. doi: 10.1371/journal.pone.0044156
|
| [65] | Kohonen-Corish MR, Daniel JJ, te Riele H, et al. (2002) Susceptibility of Msh2-deficient mice to inflammation-associated colorectal tumors. Cancer Res 62: 2092–2097. |
| [66] | Fleisher AS, Esteller M, Harpaz N, et al. (2000) Microsatellite instability in inflammatory bowel disease-associated neoplastic lesions is associated with hypermethylation and diminished expression of the DNA mismatch repair gene, hMLH1. Cancer Res 60: 4864–4868. |
| [67] |
Redston MS, Papadopoulos N, Caldas C, et al. (1995) Common occurrence of APC and K-ras gene mutations in the spectrum of colitis-associated neoplasias. Gastroenterol 108: 383–392. doi: 10.1016/0016-5085(95)90064-0
|
| [68] |
Burmer GC, Rabinovitch PS, Haggitt RC, et al. (1992) Neoplastic progression in ulcerative colitis: histology, DNA content, and loss of a p53 allele. Gastroenterol 103: 1602–1610. doi: 10.1016/0016-5085(92)91184-6
|
| [69] |
Yashiro M (2015) Molecular alterations of colorectal cancer with inflammatory bowel disease. Dig Dis Sci 60: 2251–2263. doi: 10.1007/s10620-015-3646-4
|
| [70] |
Mikami T, Yoshida T, Numata Y, et al. (2007) Low frequency of promoter methylation of O6-Methylguanine DNA methyltransferase and hMLH1 in ulcerative colitis-associated tumors. Am J Clin Pathol 127: 366–373. doi: 10.1309/RFETXN6387KLQ1LD
|
| [71] |
Foran E, Garrity-Park MM, Mureau C, et al. (2010) Upregulation of DNA methyltransferase-mediated gene silencing, anchorage-independent growth, and migration of colon cancer cells by interleukin-6. Mol Cancer Res 8: 471–481. doi: 10.1158/1541-7786.MCR-09-0496
|
| [72] | Hartnett L, Egan LJ (2012) Inflammation, DNA methylation and colitis-associated cancer. Carcinogenesis bgs006. |
| [73] |
Nakazawa T, Kondo T, Ma D, et al. (2012) Global histone modification of histone H3 in colorectal cancer and its precursor lesions. Hum Pathol 43: 834–842. doi: 10.1016/j.humpath.2011.07.009
|
| [74] |
Li Q, Chen H (2012) Silencing of Wnt5a during colon cancer metastasis involves histone modifications. Epigenetics 7: 551–558. doi: 10.4161/epi.20050
|
| [75] |
Binder H, Steiner L, Przybilla J, et al. (2013) Transcriptional regulation by histone modifications: towards a theory of chromatin re-organization during stem cell differentiation. Phys Biol 10: 026006. doi: 10.1088/1478-3975/10/2/026006
|
| [76] |
Bardhan K, Liu K (2013) Epigenetics and colorectal cancer pathogenesis. Cancers 5: 676–713. doi: 10.3390/cancers5020676
|
| [77] |
Klose RJ, Zhang Y (2007) Regulation of histone methylation by demethylimination and demethylation. Nat Rev Mol Cell Biol 8: 307–318. doi: 10.1038/nrm2143
|
| [78] |
Wong JJL, Hawkins NJ, Ward RL (2007) Colorectal cancer: a model for epigenetic tumorigenesis. Gut 56: 140–148. doi: 10.1136/gut.2005.088799
|
| [79] |
Portela A, Esteller M (2010) Epigenetic modifications and human disease. Nat Biotechnol 28: 1057–1068. doi: 10.1038/nbt.1685
|
| [80] |
Glauben R, Batra A, Fedke I, et al. (2006) Histone hyperacetylation is associated with amelioration of experimental colitis in mice. J Immunol 176: 5015–5022. doi: 10.4049/jimmunol.176.8.5015
|
| [81] |
Glauben R, Batra A, Stroh T, et al. (2008) Histone deacetylases: novel targets for prevention of colitis-associated cancer in mice. Gut 57: 613–622. doi: 10.1136/gut.2007.134650
|
| [82] |
Griffiths-Jones S, Grocock RJ, Van Dongen S, et al. (2006) miRBase: microRNA sequences, targets and gene nomenclature. Nucleic Acids Res 34: D140–D144. doi: 10.1093/nar/gkj112
|
| [83] |
Wu F, Zikusoka M, Trindade A, et al. (2008) MicroRNAs are differentially expressed in ulcerative colitis and alter expression of macrophage inflammatory peptide-2α. Gastroenterol 135: 1624–1635. doi: 10.1053/j.gastro.2008.07.068
|
| [84] |
Olaru AV, Selaru FM, Mori Y, et al. (2011) Dynamic changes in the expression of MicroRNA-31 during inflammatory bowel disease-associated neoplastic transformation. Inflamm Bowel Dis 17: 221–231. doi: 10.1002/ibd.21359
|
| [85] | Shi C, Yang Y, Xia Y, et al. (2015) Novel evidence for an oncogenic role of microRNA-21 in colitis-associated colorectal cancer. Gut 308–455. |
| [86] | Svrcek M, El-Murr N, Wanherdrick K, et al. (2013) Overexpression of microRNAs-155 and 21 targeting mismatch repair proteins in inflammatory bowel diseases. Carcinogenesis bgs408. |
| [87] |
Polytarchou C, Hommes DW, Palumbo T, et al. (2015) MicroRNA214 is associated with progression of ulcerative colitis, and inhibition reduces development of colitis and colitis-associated cancer in mice. Gastroenterol 149: 981–992. doi: 10.1053/j.gastro.2015.05.057
|
| [88] | Cristóbal I, Manso R, Gónzález-Alonso P, et al. (2015) Clinical value of miR-26b discriminating ulcerative colitis-associated colorectal cancer in the subgroup of patients with metastatic disease. Inflamm Bowel Dis 21: E24–E25. |
| [89] |
Ludwig K, Fassan M, Mescoli C, et al. (2013) PDCD4/miR-21 dysregulation in inflammatory bowel disease-associated carcinogenesis. Virchows Arch 462: 57–63. doi: 10.1007/s00428-012-1345-5
|
| [90] |
Yang L, Belaguli N, Berger DH (2009) MicroRNA and colorectal cancer. World J Surg 33: 638–646. doi: 10.1007/s00268-008-9865-5
|
| [91] |
Kanaan Z, Rai SN, Eichenberger MR, et al. (2012) Differential MicroRNA expression tracks neoplastic progression in inflammatory bowel disease-associated colorectal cancer. Hum Mutat 33: 551–560. doi: 10.1002/humu.22021
|
| [92] |
Feng R, Chen X, Yu Y, et al. (2010) miR-126 functions as a tumour suppressor in human gastric cancer. Cancer Lett 298: 50–63. doi: 10.1016/j.canlet.2010.06.004
|
| [93] |
Fasseu M, Tréton X, Guichard C, et al. (2010) Identification of restricted subsets of mature microRNA abnormally expressed in inactive colonic mucosa of patients with inflammatory bowel disease. PloS One 5: e13160. doi: 10.1371/journal.pone.0013160
|
| [94] | Wang W, Li X, Zheng D, et al. (2015) Dynamic changes and functions of macrophages and M1/M2 subpopulations during ulcerative colitis-associated carcinogenesis in an AOM/DSS mouse model. Mol Med Rep 11: 2397–2406. |
| [95] |
Francescone R, Hou V, Grivennikov SI (2015) Cytokines, IBD, and colitis-associated cancer. Inflamm Bowel Dis 21: 409–418. doi: 10.1097/MIB.0000000000000236
|
| [96] |
Sarra M, Pallone F, MacDonald TT, et al. (2010) IL-23/IL-17 axis in IBD. Inflamm Bowel Dis 16: 1808–1813. doi: 10.1002/ibd.21248
|
| [97] | Reinecker HC, Steffen M, Witthoeft T, et al. (1993) Enhand secretion of tumour necrosis factor-alpha, IL-6, and IL-1β by isolated lamina ropria monouclear cells from patients with ulcretive cilitis and Crohn's disease. Clin Exp Immunol 94: 174–181. |
| [98] | Banks C, Bateman A, Payne R, et al. (2003) Chemokine expression in IBD. Mucosal chemokine expression is unselectively increased in both ulcerative colitis and Crohn's disease. J Pathol 199: 28–35. |
| [99] |
Wiercinska-Drapalo A, Flisiak R, Jaroszewicz J, et al. (2005) Plasma interleukin-18 reflects severity of ulcerative colitis. World J Gastroenterol 11: 605–608. doi: 10.3748/wjg.v11.i4.605
|
| [100] |
Bisping G, Lügering N, Lütke-Brintrup S, et al. (2001) Patients with inflammatory bowel disease (IBD) reveal increased induction capacity of intracellular interferon-gamma (IFN-γ) in peripheral CD8+ lymphocytes co-cultured with intestinal epithelial cells. Clin Exp Immunol 123: 15–22. doi: 10.1046/j.1365-2249.2001.01443.x
|
| [101] | Hyun YS, Han DS, Lee AR, et al. (2012) Role of IL-17A in the development of colitis-associated cancer. Carcinogenesis bgs106. |
| [102] |
Onizawa M, Nagaishi T, Kanai T, et al. (2009) Signaling pathway via TNF-α/NF-κB in intestinal epithelial cells may be directly involved in colitis-associated carcinogenesis. Am J Physiol Gastrointest Liver Physiol 296: G850–G859. doi: 10.1152/ajpgi.00071.2008
|
| [103] |
Matsumoto S, Hara T, Mitsuyama K, et al. (2010) Essential roles of IL-6 trans-signaling in colonic epithelial cells, induced by the IL-6/soluble–IL-6 receptor derived from lamina propria macrophages, on the development of colitis-associated premalignant cancer in a murine model. J Immunol 184: 1543–1551. doi: 10.4049/jimmunol.0801217
|
| [104] |
Atreya R, Mudter J, Finotto S, et al. (2000) Blockade of interleukin 6 trans signaling suppresses T-cell resistance against apoptosis in chronic intestinal inflammation: evidence in crohn disease and experimental colitis in vivo. Nat Med 6: 583–588. doi: 10.1038/75068
|
| [105] | Popivanova BK, Kitamura K, Wu Y, et al. (2008) Blocking TNF-α in mice reduces colorectal carcinogenesis associated with chronic colitis. J Clin Invest 118: 560–570. |
| [106] |
Fukata M, Chen A, Vamadevan AS, et al. (2007) Toll-like receptor-4 promotes the development of colitis-associated colorectal tumors. Gastroenterol 133: 1869–1869. doi: 10.1053/j.gastro.2007.09.008
|
| [107] |
Garrett WS, Punit S, Gallini CA, et al. (2009) Colitis-associated colorectal cancer driven by T-bet deficiency in dendritic cells. Cancer Cell 16: 208–219. doi: 10.1016/j.ccr.2009.07.015
|
| [108] |
Allen IC, TeKippe EM, Woodford RMT, et al. (2010) The NLRP3 inflammasome functions as a negative regulator of tumorigenesis during colitis-associated cancer. J Exp Med 207: 1045–1056. doi: 10.1084/jem.20100050
|
| [109] |
Allen IC, Wilson JE, Schneider M, et al. (2012) NLRP12 suppresses colon inflammation and tumorigenesis through the negative regulation of noncanonical NF-κB signaling. Immunity 36: 742–754. doi: 10.1016/j.immuni.2012.03.012
|
| [110] |
Chen GY, Liu M, Wang F, et al. (2011) A functional role for Nlrp6 in intestinal inflammation and tumorigenesis. J Immunol 186: 7187–7194. doi: 10.4049/jimmunol.1100412
|
| [111] | Eckmann L, Greten T (2004) IKKbeta links inflam. mation and tumorigenesis in a mouse model of colitis-associated cancer. Cell 118: 285–296. |
| [112] |
Cooks T, Pateras IS, Tarcic O, et al. (2013) Mutant p53 prolongs NF-κB activation and promotes chronic inflammation and inflammation-associated colorectal cancer. Cancer Cell 23: 634–646. doi: 10.1016/j.ccr.2013.03.022
|
| [113] |
Grivennikov S, Karin E, Terzic J, et al. (2009) IL-6 and Stat3 are required for survival of intestinal epithelial cells and development of colitis-associated cancer. Cancer Cell 15: 103–113. doi: 10.1016/j.ccr.2009.01.001
|
| [114] |
Bollrath J, Phesse TJ, von Burstin VA, et al. (2009) gp130-mediated Stat3 activation in enterocytes regulates cell survival and cell-cycle progression during colitis-associated tumorigenesis. Cancer Cell 15: 91–102. doi: 10.1016/j.ccr.2009.01.002
|
| [115] |
Ghosh S, Karin M (2002) Missing pieces in the NF-κB puzzle. Cell 109: S81–S96. doi: 10.1016/S0092-8674(02)00703-1
|
| [116] |
Karin M (2006) Nuclear factor-κB in cancer development and progression. Nature 441: 431–436. doi: 10.1038/nature04870
|
| [117] |
Greten FR, Eckmann L, Greten TF, et al. (2004) IKKβ links inflammation and tumorigenesis in a mouse model of colitis-associated cancer. Cell 118: 285–296. doi: 10.1016/j.cell.2004.07.013
|
| [118] |
Rose-John S (2012) IL-6 trans-signaling via the soluble IL-6 receptor: importance for the pro-inflammatory activities of IL-6. Int J Biol Sci 8: 1237–1247. doi: 10.7150/ijbs.4989
|
| [119] |
Yu H, Pardoll D, Jove R (2009) STATs in cancer inflammation and immunity: a leading role for STAT3. Nat Rev Cancer 9: 798–809. doi: 10.1038/nrc2734
|
| [120] |
Pickert G, Neufert C, Leppkes M, et al. (2009) STAT3 links IL-22 signaling in intestinal epithelial cells to mucosal wound healing. J Exp Med 206: 1465–1472. doi: 10.1084/jem.20082683
|
| [121] |
Putoczki TL, Thiem S, Loving A, et al. (2013) Interleukin-11 is the dominant IL-6 family cytokine during gastrointestinal tumorigenesis and can be targeted therapeutically. Cancer Cell 24: 257–271. doi: 10.1016/j.ccr.2013.06.017
|
| [122] | Chichlowski M, Sharp JM, Vanderford DA, et al. (2008) Helicobacter typhlonius and Helicobacter rodentium differentially affect the severity of colon inflammation and inflammation-associated neoplasia in IL10-deficient mice. Comp Med 58: 534–541. |
| [123] |
Uronis JM, Mühlbauer M, Herfarth HH, et al. (2009) Modulation of the intestinal microbiota alters colitis-associated colorectal cancer susceptibility. PloS One 4: e6026. doi: 10.1371/journal.pone.0006026
|
| [124] |
O'mahony L, Feeney M, O'halloran S, et al. (2001) Probiotic impact on microbial flora, inflammation and tumour development in IL-10 knockout mice. Aliment Pharmacol Ther 15: 1219–1225. doi: 10.1046/j.1365-2036.2001.01027.x
|
| [125] |
Tözün N, Vardareli E (2016) Gut microbiome and gastrointestinal cancer: les liaisons dangereuses. J Clin Gastroenterol 50: S191–S196. doi: 10.1097/MCG.0000000000000714
|
| [126] | Yamamoto M, Matsumoto S (2016) Gut microbiota and colorectal cancer. Genes and Environ 38: 1–7. |
| [127] |
Abreu MT (2010) Toll-like receptor signalling in the intestinal epithelium: how bacterial recognition shapes intestinal function. Nat Rev Immunol 10: 131–144. doi: 10.1038/nri2707
|
| [128] | Grivennikov SI (2013) Inflammation and colorectal cancer: colitis-associated neoplasia, In: Seminars in immunopathology, Springer-Verlag, 229–244. |
| [129] |
Lowe EL, Crother TR, Rabizadeh S, et al. (2010) Toll-like receptor 2 signaling protects mice from tumor development in a mouse model of colitis-induced cancer. PloS One 5: e13027. doi: 10.1371/journal.pone.0013027
|
| [130] |
Fukata M, Chen A, Vamadevan AS, et al. (2007) Toll-like receptor-4 promotes the development of colitis-associated colorectal tumors. Gastroenterol 133: 1869–1869. doi: 10.1053/j.gastro.2007.09.008
|
| [131] | Araki T, Toiyama Y, Okita Y, et al. (2016) Surgical treatment for ulcerative colitis-associated cancer or dysplasia, In: Colitis-associated cancer, Springer-Verlag, 109–130. |
| [132] |
Nio K, Higashi D, Kumagai H, et al. (2016) Efficacy and safety analysis of chemotherapy for advanced colitis-associated colorectal cancer in Japan. Anticancer Drugs 27: 457–463. doi: 10.1097/CAD.0000000000000338
|
| [133] |
Impellizzeri D, Esposito E, Mazzon E, et al. (2011) Oleuropein aglycone, an olive oil compound, ameliorates development of arthritis caused by injection of collagen type II in mice. J Pharmacol Exp Ther 339: 859–869. doi: 10.1124/jpet.111.182808
|
| [134] |
Giner E, Recio MC, Ríos JL, et al. (2013) Oleuropein protects against dextran sodium sulfate-induced chronic colitis in mice. J Nat Prod 76: 1113–1120. doi: 10.1021/np400175b
|
| [135] | Acquaviva R, Di Giacomo C, Sorrenti V, et al. (2012) Antiproliferative effect of oleuropein in prostate cell lines. Int J Oncol 41: 31. |
| [136] |
Elamin MH, Daghestani MH, Omer SA, et al. (2013) Olive oil oleuropein has anti-breast cancer properties with higher efficiency on ER-negative cells. Food Chem Toxicol 53: 310–316. doi: 10.1016/j.fct.2012.12.009
|
| [137] |
Giner E, Recio MC, Ríos JL, et al. (2016) Chemopreventive effect of oleuropein in colitis-associated colorectal cancer in c57bl/6 mice. Mol Nutr Food Res 60: 242–255. doi: 10.1002/mnfr.201500605
|
| [138] |
Zhang M, Viennois E, Prasad M, et al. (2016) Edible ginger-derived nanoparticles: a novel therapeutic approach for the prevention and treatment of inflammatory bowel disease and colitis-associated cancer. Biomaterials 101: 321–340. doi: 10.1016/j.biomaterials.2016.06.018
|
| [139] | Lin L, Sun Y, Wang D, et al. (2015) Celastrol ameliorates ulcerative colitis-related colorectal cancer in mice via suppressing inflammatory responses and epithelial-mesenchymal transition. Front Pharmacol 6. |
| [140] |
Shaker ME, Ashamallah SA, Houssen ME (2014) Celastrol ameliorates murine colitis via modulating oxidative stress, inflammatory cytokines and intestinal homeostasis. Chem Biol Interact 210: 26–33. doi: 10.1016/j.cbi.2013.12.007
|
| [141] |
Fung KY, Cosgrove L, Lockett T, et al. (2012) A review of the potential mechanisms for the lowering of colorectal oncogenesis by butyrate. Br J Nutr 108: 820–831. doi: 10.1017/S0007114512001948
|
| [142] |
Hu Y, Le Leu RK, Christophersen CT, et al. (2016) Manipulation of the gut microbiota using resistant starch is associated with protection against colitis-associated colorectal cancer in rats. Carcinogenesis 37: 366–375. doi: 10.1093/carcin/bgw019
|
| [143] | Kong ZL, Kao NJ, Hu JY, et al. (2016) Fucoxanthin-rich brown algae extract decreases inflammation and attenuates colitis-associated colon cancer in mice. J Food Nutr Res 4: 137–147. |
| [144] |
Pandurangan AK, Saadatdoust Z, Hamzah H, et al. (2015) Dietary cocoa protects against colitis-associated cancer by activating the Nrf2/Keap1 pathway. Biofactors 41: 1–14. doi: 10.1002/biof.1195
|
| [145] | Wu WT, Tsai YT, Chen HL (2016) Konjac glucomannan and inulin oligosaccharide attenuated the progression of colitic-associated colon carcinogenesis and modulated immune response in mice. FASEB J 30: 1174. |
| [146] | Periasamy S, Liu CT, Wu WH, et al. (2015) Dietary Ziziphus jujuba fruit influence on aberrant crypt formation and blood cells in colitis-associated colorectal cancer in mice. Asian Pac J Cancer Prev:16: 7561–7566. |
| [147] |
Viennois E, Xiao B, Ayyadurai S, et al. (2014) Micheliolide, a new sesquiterpene lactone that inhibits intestinal inflammation and colitis-associated cancer. Lab Invest 94: 950–965. doi: 10.1038/labinvest.2014.89
|
| [148] | Kunchari Kalaimathi S, Sudhandiran G (2016) Fisetin ameolirates the azoxymethane and dextran sodium sulfate induced colitis associated colorectal cancer. Int J Pharm Clin Res 8: 551–560. |
| [149] |
Yasui Y, Hosokawa M, Mikami N, et al. (2011) Dietary astaxanthin inhibits colitis and colitis-associated colon carcinogenesis in mice via modulation of the inflammatory cytokines. Chem Biol Interact 193: 79–87. doi: 10.1016/j.cbi.2011.05.006
|
| [150] | Yang X, Zhang F, Wang Y, et al. (2013) Oroxylin A inhibits colitis-associated carcinogenesis through modulating the IL-6/STAT3 signaling pathway. Inflamm Bowel Dis 19: 1990–2000. |
| [151] |
Kannengiesser K, Maaser C, Heidemann J, et al. (2008) Melanocortin-derived tripeptide KPV has anti-inflammatory potential in murine models of inflammatory bowel disease. Inflamm Bowel Dis 14: 324–331. doi: 10.1002/ibd.20334
|
| [152] |
Viennois E, Ingersoll SA, Ayyadurai S, et al. (2016) Critical role of PepT1 in promoting colitis-associated cancer and therapeutic benefits of the anti-inflammatory PepT1-mediated tripeptide KPV in a murine model. CMGH Cell Mol Gastroenterol Hepatol 2: 340–357. doi: 10.1016/j.jcmgh.2016.01.006
|
| [153] |
Seraj MJ, Umemoto A, Kajikawa A, et al. (1997) Effects of dietary bile acids on formation of azoxymethane-induced aberrant crypt foci in F344 rats. Cancer Lett 115: 97–103. doi: 10.1016/S0304-3835(97)04719-8
|
| [154] |
Tung BY, Emond MJ, Haggitt RC, et al. (2001) Ursodiol use is associated with lower prevalence of colonic neoplasia in patients with ulcerative colitis and primary sclerosing cholangitis. Ann Intern Med 134: 89–95. doi: 10.7326/0003-4819-134-2-200101160-00008
|
| [155] |
Xie L, Jiang FC, Zhang LM, et al. (2016) Targeting of MyD88 homodimerization by novel synthetic inhibitor TJ-M2010-5 in preventing colitis-associated colorectal cancer. J Natl Cancer Inst 108: djv364. doi: 10.1093/jnci/djv364
|
| [156] |
Amini-Khoei H, Momeny M, Abdollahi A, et al. (2016) Tropisetron suppresses colitis-associated cancer in a mouse model in the remission stage. Int Immunopharmacol 36: 9–16. doi: 10.1016/j.intimp.2016.04.014
|
| [157] |
Drechsler S, Bruntsch U, Eggert J, et al. (1997) Comparison of three tropisetron-containing antiemetic regimens in the prophylaxis of acute and delayed chemotherapy-induced emesis and nausea. Support Care Cancer 5: 387–395. doi: 10.1007/s005200050097
|
| [158] |
Koh SJ, Kim JM, Kim I-K, et al. (2011) Fluoxetine inhibits NF-κB signaling in intestinal epithelial cells and ameliorates experimental colitis and colitis-associated colon cancer in mice. Am J Physiol Gastrointest Liver Physiol 301: G9–G19. doi: 10.1152/ajpgi.00267.2010
|
| [159] |
Tanaka T, Kochi T, Shirakami Y, et al. (2016) Cimetidine and clobenpropit attenuate inflammation-associated colorectal carcinogenesis in male ICR mice. Cancers 8: 25. doi: 10.3390/cancers8020025
|
| [160] |
Masini E, Fabbroni V, Giannini L, et al. (2005) Histamine and histidine decarboxylase up-regulation in colorectal cancer: correlation with tumor stage. Inflamm Res 54: S80–S81. doi: 10.1007/s00011-004-0437-3
|
| [161] |
Miyamoto S, Epifano F, Curini M, et al. (2008) A novel prodrug of 4'-geranyloxy-ferulic acid suppresses colitis-related colon carcinogenesis in mice. Nutr Cancer 60: 675–684. doi: 10.1080/01635580802008286
|
| [162] |
Yao J, Xie J, Xie B, et al. (2016) Therapeutic effect of hydroxychloroquine on colorectal carcinogenesis in experimental murine colitis. Biochem Pharmacol 115: 51–63. doi: 10.1016/j.bcp.2016.06.004
|
| [163] |
Dai Y, Jiao H, Teng G, et al. (2014) Embelin reduces colitis-associated tumorigenesis through limiting IL-6/STAT3 signaling. Mol Cancer Ther 13: 1206–1216. doi: 10.1158/1535-7163.MCT-13-0378
|
| [164] |
Liang J, Nagahashi M, Kim EY, et al. (2013) Sphingosine-1-phosphate links persistent STAT3 activation, chronic intestinal inflammation, and development of colitis-associated cancer. Cancer Cell 23: 107–120. doi: 10.1016/j.ccr.2012.11.013
|
| [165] | Kawamori T, Kaneshiro T, Okumura M, et al. (2009) Role for sphingosine kinase 1 in colon carcinogenesis. FASEB J 23: 405–414. |
| [166] |
Snider AJ, Kawamori T, Bradshaw SG, et al. (2009) A role for sphingosine kinase 1 in dextran sulfate sodium-induced colitis. FASEB J 23: 143–152. doi: 10.1096/fj.08-118109
|
| [167] |
Wang D, DuBois RN (2010) The role of COX-2 in intestinal inflammation and colorectal cancer. Oncogene 29: 781–788. doi: 10.1038/onc.2009.421
|
| [168] |
Kohno H, Suzuki R, Sugie S, et al. (2005) Suppression of colitis-related mouse colon carcinogenesis by a COX-2 inhibitor and PPAR ligands. BMC Cancer 5: 1. doi: 10.1186/1471-2407-5-1
|
| [169] |
Setia S, Nehru B, Sanyal SN (2014) The PI3K/Akt pathway in colitis associated colon cancer and its chemoprevention with celecoxib, a Cox-2 selective inhibitor. Biomed Pharmacother 68: 721–727. doi: 10.1016/j.biopha.2014.07.006
|
| [170] |
Glauben R, Sonnenberg E, Zeitz M, et al. (2009) HDAC inhibitors in models of inflammation-related tumorigenesis. Cancer Lett 280: 154–159. doi: 10.1016/j.canlet.2008.11.019
|
| [171] | Wei TT, Lin YT, Tseng RY, et al. (2016) Prevention of colitis and colitis-associated colorectal cancer by a novel polypharmacological Histone deacetylase inhibitor. Am Assoc Cancer Res 22: 4158–4169. |
| [172] |
Reinhard A, Bressenot A, Dassonneville R, et al. (2015) Photodynamic therapy relieves colitis and prevents colitis-associated carcinogenesis in mice. Inflamm Bowel Dis 21: 985–995. doi: 10.1097/MIB.0000000000000354
|
| [173] |
Zhang D, Mi M, Jiang F, et al. (2015) Apple polysaccharide reduces NF-kb mediated colitis-associated colon carcinogenesis. Nutr Cancer 67: 177–190. doi: 10.1080/01635581.2015.965336
|
| [174] |
Yang Y, Cai X, Yang J, et al. (2014) Chemoprevention of dietary digitoflavone on colitis-associated colon tumorigenesis through inducing Nrf2 signaling pathway and inhibition of inflammation. Mol Cancer 13: 48. doi: 10.1186/1476-4598-13-48
|
| [175] | Tian Y, Wang K, Wang Z, et al. (2013) Chemopreventive effect of dietary glutamine on colitis-associated colon tumorigenesis in mice. Carcinogenesis bgt088. |
| [176] |
Tian Y, Wang K, Fan Y, et al. (2016) Chemopreventive effect of dietary glutamineon colitis-associated colorectal cancer is associated with modulation of the DEPTOR/mTOR signaling pathway. Nutrients 8: 261. doi: 10.3390/nu8050261
|
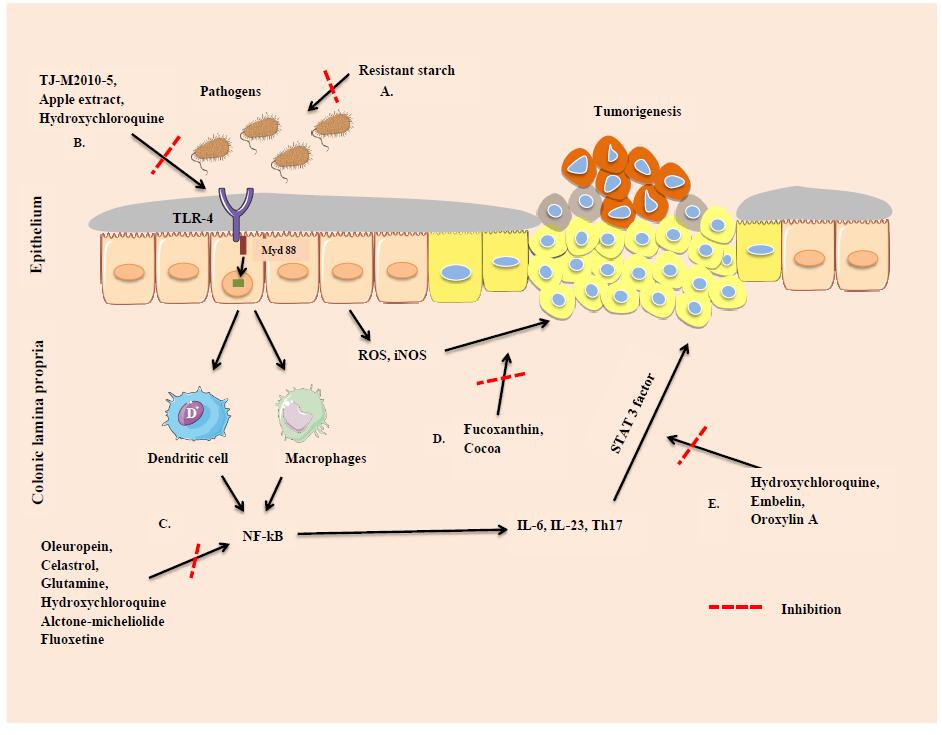
Figures(1) / Tables(1)

Sonia Shastri, Ravichandra Vemuri, Nuri Gueven, Madhur D. Shastri, Rajaraman Eri. Molecular mechanisms of intestinal inflammation leading to colorectal cancer[J]. AIMS Biophysics, 2017, 4(1): 152-177. doi: 10.3934/biophy.2017.1.152

| Parameters | α | τAD | τGrad | λcen | λ′ | L1 | L2 |
| Values | 0.1 | 7 | 2 | 25 | 700 | 34 | 7 |
| Parameters | τ1 | τ2 | β | λ1 | λ2 | λ3 | λL |
| Values | 20 | 6 | 0.6 | 0.15 | 0.25 | 0.5 | 3 |
DownLoad:
CSV
| Algorithms | Art | Dolls | Flowerpots | Moebius | Reindeer | Cloth1 | Avg |
| iFCT | 10.12 | 7.55 | 5.36 | 8.56 | 10.09 | 0.36 | 7.00 |
| CT | 10.53 | 9.21 | 5.60 | 8.92 | 10.59 | 0.37 | 7.54 |
| MCT | 12.34 | 9.84 | 5.99 | 9.28 | 10.86 | 0.42 | 8.12 |
| SCT | 14.13 | 11.60 | 6.94 | 10.68 | 15.80 | 0.54 | 9.95 |
| MRCT | 44.4 | 39.46 | 8.66 | 33.08 | 60.21 | 14.31 | 33.36 |
DownLoad:
CSV
| Algorithms | Art | Dolls | Flowerpots | Moebius | Reindeer | Cloth1 | Avg |
| iFCT | 14.35 | 7.25 | 14.85 | 9.94 | 10.77 | 0.63 | 9.63 |
| CT | 14.99 | 7.72 | 15.20 | 10.99 | 10.74 | 0.68 | 10.05 |
| MCT | 16.69 | 8.88 | 16.78 | 12.26 | 12.80 | 0.79 | 11.37 |
| SCT | 18.52 | 13.29 | 22.45 | 13.45 | 13.50 | 1.26 | 13.75 |
| MRCT | 60.45 | 61.64 | 59.90 | 49.78 | 62.04 | 22.12 | 52.66 |
DownLoad:
CSV
| Algorithms | Art | Dolls | Flowerpots | Moebius | Reindeer | Cloth1 | Avg |
| iFCT | 7.67 | 3.72 | 7.21 | 7.42 | 3.68 | 0.41 | 5.01 |
| CT | 6.74 | 3.14 | 6.51 | 7.21 | 3.38 | 0.41 | 4.57 |
| MCT | 6.77 | 4.98 | 11.81 | 10.47 | 6.63 | 0.34 | 6.83 |
| SCT | 6.77 | 3.06 | 8.17 | 7.43 | 3.28 | 0.36 | 4.85 |
| MRCT | 7.77 | 3.48 | 9.37 | 8.90 | 3.93 | 1.00 | 5.74 |
DownLoad:
CSV
| Algorithms | Art | Dolls | Flowerpots | Moebius | Reindeer | Cloth1 | Avg |
| iFCT | 17.90 | 12.34 | 33.54 | 16.84 | 24.35 | 0.47 | 17.57 |
| CT | 19.83 | 13.12 | 33.61 | 17.30 | 25.40 | 0.53 | 18.30 |
| MCT | 18.55 | 11.90 | 32.81 | 16.53 | 24.68 | 0.48 | 17.49 |
| SCT | 22.30 | 14.86 | 35.82 | 19.10 | 29.78 | 0.78 | 20.44 |
| MRCT | 35.06 | 23.87 | 48.78 | 30.23 | 45.88 | 5.95 | 31.63 |
DownLoad:
CSV
| Algorithms | Art | Dolls | Flowerpots | Moebius | Reindeer | Cloth1 | Avg |
| iFCT | 5.81 | 2.88 | 5.36 | 5.60 | 3.34 | 0.24 | 3.87 |
| CT | 6.07 | 2.69 | 5.60 | 5.89 | 3.12 | 0.23 | 3.93 |
| MCT | 7.59 | 3.35 | 5.99 | 6.74 | 4.17 | 0.24 | 4.68 |
| SCT | 6.06 | 2.69 | 6.94 | 6.39 | 3.11 | 0.26 | 4.24 |
| MRCT | 6.80 | 2.96 | 8.66 | 8.90 | 3.55 | 0.63 | 5.25 |
DownLoad:
CSV
| Algorithms | Lampshade1 | Lampshade2 | Midd1 | Midd2 | Monopoly | Plastic | Avg |
| ACP | 2.41 | 3.12 | 14.34 | 10.53 | 3.95 | 14.58 | 8.12 |
| AD-census | 10.34 | 10.69 | 11.82 | 12.35 | 5.44 | 32.07 | 13.79 |
| GF | 4.66 | 9.89 | 26.54 | 19.28 | 12.01 | 22.16 | 15.76 |
| PPEP-GF | 2.58 | 6.24 | 18.79 | 13.09 | 6.85 | 16.13 | 10.61 |
| Z2ZNCC | 3.12 | 9.56 | 24.12 | 17.75 | 11.44 | 22.80 | 14.8 |
DownLoad:
CSV
| Datasets | AD-census | AEGF | OLT | DDL | iFCTACP |
| Cones | 8.61 | 2.01 | 3.42 | 4.27 | 2.96 |
| Teddy | 6.48 | 5.21 | 7.69 | 6.59 | 7.45 |
| Tsukuba | 8.04 | 1.32 | 2.06 | 2.63 | 3.92 |
| Venus | 2.92 | 0.26 | 0.54 | 0.69 | 1.34 |
| Aloe | 5.18 | 5.25 | 2.91 | 5.28 | 2.83 |
| Art | 11.58 | 7.58 | 6.91 | 9.47 | 5.81 |
| Baby1 | 5.56 | 3.18 | 4.03 | 2.78 | 1.79 |
| Baby2 | 8.27 | 4.15 | 4.86 | 2.84 | 1.89 |
| Baby3 | 4.21 | 4.34 | 4.89 | 3.19 | 2.24 |
| Books | 11.05 | 8.05 | 8.07 | 8.16 | 6.87 |
| Bowling1 | 18.77 | 13.33 | 14.52 | 4.38 | 3.12 |
| Bowling2 | 13.27 | 7.13 | 6.11 | 4.43 | 2.69 |
| Cloth1 | 0.20 | 0.49 | 0.11 | 0.25 | 0.24 |
| Cloth2 | 4.15 | 2.88 | 1.30 | 2.14 | 1.17 |
| Cloth3 | 1.68 | 1.31 | 0.93 | 1.80 | 0.93 |
| Cloth4 | 1.32 | 1.54 | 0.74 | 1.21 | 0.77 |
| Dolls | 5.61 | 5.36 | 3.79 | 5.58 | 2.88 |
| Flowerpots | 17.26 | 5.36 | 11.35 | 6.80 | 5.36 |
| Lampshade1 | 12.27 | 11.43 | 8.27 | 5.66 | 2.41 |
| Lampshade2 | 15.23 | 16.98 | 12.20 | 4.08 | 3.12 |
| Laundry | 14.71 | 14.32 | 11.98 | 12.00 | 11.92 |
| Moebius | 9.97 | 8.71 | 8.25 | 9.60 | 5.60 |
| Reindeer | 16.70 | 3.57 | 4.11 | 5.40 | 3.34 |
| Rocks1 | 2.54 | 3.25 | 1.27 | 4.14 | 1.40 |
| Rocks2 | 2.04 | 2.44 | 1.02 | 3.26 | 1.08 |
| Average error | 8.30 | 5.58 | 5.42 | 4.67 | 3.33 |
DownLoad:
CSV
| Parameters | α | τAD | τGrad | λcen | λ′ | L1 | L2 |
| Values | 0.1 | 7 | 2 | 25 | 700 | 34 | 7 |
| Parameters | τ1 | τ2 | β | λ1 | λ2 | λ3 | λL |
| Values | 20 | 6 | 0.6 | 0.15 | 0.25 | 0.5 | 3 |
| Algorithms | Art | Dolls | Flowerpots | Moebius | Reindeer | Cloth1 | Avg |
| iFCT | 10.12 | 7.55 | 5.36 | 8.56 | 10.09 | 0.36 | 7.00 |
| CT | 10.53 | 9.21 | 5.60 | 8.92 | 10.59 | 0.37 | 7.54 |
| MCT | 12.34 | 9.84 | 5.99 | 9.28 | 10.86 | 0.42 | 8.12 |
| SCT | 14.13 | 11.60 | 6.94 | 10.68 | 15.80 | 0.54 | 9.95 |
| MRCT | 44.4 | 39.46 | 8.66 | 33.08 | 60.21 | 14.31 | 33.36 |
| Algorithms | Art | Dolls | Flowerpots | Moebius | Reindeer | Cloth1 | Avg |
| iFCT | 14.35 | 7.25 | 14.85 | 9.94 | 10.77 | 0.63 | 9.63 |
| CT | 14.99 | 7.72 | 15.20 | 10.99 | 10.74 | 0.68 | 10.05 |
| MCT | 16.69 | 8.88 | 16.78 | 12.26 | 12.80 | 0.79 | 11.37 |
| SCT | 18.52 | 13.29 | 22.45 | 13.45 | 13.50 | 1.26 | 13.75 |
| MRCT | 60.45 | 61.64 | 59.90 | 49.78 | 62.04 | 22.12 | 52.66 |
| Algorithms | Art | Dolls | Flowerpots | Moebius | Reindeer | Cloth1 | Avg |
| iFCT | 7.67 | 3.72 | 7.21 | 7.42 | 3.68 | 0.41 | 5.01 |
| CT | 6.74 | 3.14 | 6.51 | 7.21 | 3.38 | 0.41 | 4.57 |
| MCT | 6.77 | 4.98 | 11.81 | 10.47 | 6.63 | 0.34 | 6.83 |
| SCT | 6.77 | 3.06 | 8.17 | 7.43 | 3.28 | 0.36 | 4.85 |
| MRCT | 7.77 | 3.48 | 9.37 | 8.90 | 3.93 | 1.00 | 5.74 |
| Algorithms | Art | Dolls | Flowerpots | Moebius | Reindeer | Cloth1 | Avg |
| iFCT | 17.90 | 12.34 | 33.54 | 16.84 | 24.35 | 0.47 | 17.57 |
| CT | 19.83 | 13.12 | 33.61 | 17.30 | 25.40 | 0.53 | 18.30 |
| MCT | 18.55 | 11.90 | 32.81 | 16.53 | 24.68 | 0.48 | 17.49 |
| SCT | 22.30 | 14.86 | 35.82 | 19.10 | 29.78 | 0.78 | 20.44 |
| MRCT | 35.06 | 23.87 | 48.78 | 30.23 | 45.88 | 5.95 | 31.63 |
| Algorithms | Art | Dolls | Flowerpots | Moebius | Reindeer | Cloth1 | Avg |
| iFCT | 5.81 | 2.88 | 5.36 | 5.60 | 3.34 | 0.24 | 3.87 |
| CT | 6.07 | 2.69 | 5.60 | 5.89 | 3.12 | 0.23 | 3.93 |
| MCT | 7.59 | 3.35 | 5.99 | 6.74 | 4.17 | 0.24 | 4.68 |
| SCT | 6.06 | 2.69 | 6.94 | 6.39 | 3.11 | 0.26 | 4.24 |
| MRCT | 6.80 | 2.96 | 8.66 | 8.90 | 3.55 | 0.63 | 5.25 |
| Algorithms | Lampshade1 | Lampshade2 | Midd1 | Midd2 | Monopoly | Plastic | Avg |
| ACP | 2.41 | 3.12 | 14.34 | 10.53 | 3.95 | 14.58 | 8.12 |
| AD-census | 10.34 | 10.69 | 11.82 | 12.35 | 5.44 | 32.07 | 13.79 |
| GF | 4.66 | 9.89 | 26.54 | 19.28 | 12.01 | 22.16 | 15.76 |
| PPEP-GF | 2.58 | 6.24 | 18.79 | 13.09 | 6.85 | 16.13 | 10.61 |
| Z2ZNCC | 3.12 | 9.56 | 24.12 | 17.75 | 11.44 | 22.80 | 14.8 |
| Datasets | AD-census | AEGF | OLT | DDL | iFCTACP |
| Cones | 8.61 | 2.01 | 3.42 | 4.27 | 2.96 |
| Teddy | 6.48 | 5.21 | 7.69 | 6.59 | 7.45 |
| Tsukuba | 8.04 | 1.32 | 2.06 | 2.63 | 3.92 |
| Venus | 2.92 | 0.26 | 0.54 | 0.69 | 1.34 |
| Aloe | 5.18 | 5.25 | 2.91 | 5.28 | 2.83 |
| Art | 11.58 | 7.58 | 6.91 | 9.47 | 5.81 |
| Baby1 | 5.56 | 3.18 | 4.03 | 2.78 | 1.79 |
| Baby2 | 8.27 | 4.15 | 4.86 | 2.84 | 1.89 |
| Baby3 | 4.21 | 4.34 | 4.89 | 3.19 | 2.24 |
| Books | 11.05 | 8.05 | 8.07 | 8.16 | 6.87 |
| Bowling1 | 18.77 | 13.33 | 14.52 | 4.38 | 3.12 |
| Bowling2 | 13.27 | 7.13 | 6.11 | 4.43 | 2.69 |
| Cloth1 | 0.20 | 0.49 | 0.11 | 0.25 | 0.24 |
| Cloth2 | 4.15 | 2.88 | 1.30 | 2.14 | 1.17 |
| Cloth3 | 1.68 | 1.31 | 0.93 | 1.80 | 0.93 |
| Cloth4 | 1.32 | 1.54 | 0.74 | 1.21 | 0.77 |
| Dolls | 5.61 | 5.36 | 3.79 | 5.58 | 2.88 |
| Flowerpots | 17.26 | 5.36 | 11.35 | 6.80 | 5.36 |
| Lampshade1 | 12.27 | 11.43 | 8.27 | 5.66 | 2.41 |
| Lampshade2 | 15.23 | 16.98 | 12.20 | 4.08 | 3.12 |
| Laundry | 14.71 | 14.32 | 11.98 | 12.00 | 11.92 |
| Moebius | 9.97 | 8.71 | 8.25 | 9.60 | 5.60 |
| Reindeer | 16.70 | 3.57 | 4.11 | 5.40 | 3.34 |
| Rocks1 | 2.54 | 3.25 | 1.27 | 4.14 | 1.40 |
| Rocks2 | 2.04 | 2.44 | 1.02 | 3.26 | 1.08 |
| Average error | 8.30 | 5.58 | 5.42 | 4.67 | 3.33 |
